This prospective cohort study of over 11,000 adults shows that higher physical activity is associated with lower CKD risk, with stronger effects at higher BMI. Each 1000 MET-min/week increase was linked to greater risk reduction in obesity (HR = 0.72) than in overweight individuals (HR = 0.84).
Research Article
Body Mass Index Modifies The Protective Association of Physical Activity With Incident Chronic Kidney Disease: A Prospective Cohort Study
July 7th, 2026
Opens in a new tab
In This Article
Summary
Loading...
$$\rightleftharpoonup{xx}$$
$$\longleftharp{xx}$$,
$$\longrightharp{xx}$$,
Abstract
Loading...
$$\rightleftharpoonup{xx}$$
$$\longleftharp{xx}$$,
$$\longrightharp{xx}$$,
The interaction between physical activity (PA) and body mass index (BMI) on chronic kidney disease (CKD) risk is not well defined. This study aimed to investigate the independent and joint effects of PA and BMI on CKD incidence within the context of public health. This prospective cohort analysis included 11,597 adults with normal renal function from the Shanghai Suburban Adult Cohort and Biobank (SSACB). PA (MET-min/week) and BMI (kg/m2) were assessed at baseline and not updated during follow-up. Incident CKD was defined as an estimated glomerular filtration rate (eGFR) <60 mL/min/1.73 m2 and/or a urine albumin-to-creatinine ratio (ACR) ≥30 mg/g at follow-up, consistent with KDIGO criteria. Cox regression models were used to assess main effects and the PA×BMI interaction. Over a median follow-up of 3.0 years, 485 incident CKD cases occurred. Higher PA was associated with lower CKD risk (per 1000 MET-min/week: HR = 0.91, 95% CI: 0.84–0.98). A significant interaction was observed (P = 0.031), indicating that the protective effect of PA was more pronounced at higher BMI levels. Specifically, each 1000 MET-min/week increase in PA was associated with a greater reduction in CKD risk in individuals with obesity (HR = 0.72) compared with those with overweight (HR ≈ 0.84). The protective effect of PA on CKD risk is modified by BMI, with greater benefits observed in individuals with overweight or obesity. These findings support prioritizing combined PA and weight management strategies for high-risk populations.
Introduction
Loading...
$$\rightleftharpoonup{xx}$$
$$\longleftharp{xx}$$,
$$\longrightharp{xx}$$,
Chronic kidney disease (CKD) is a major and growing global public health concern, characterized by high prevalence and strong associations with cardiovascular morbidity, mortality, and reduced quality of life1. The burden is particularly substantial in China2, where rapid population aging and increasing prevalence of metabolic disorders, especially obesity and physical inactivity, have contributed to a large CKD population. This trend places considerable pressure on healthcare systems and highlights the need for effective, scalable prevention strategies targeting modifiable risk factors. Such priorities are reflected in national initiatives, which emphasize integrated lifestyle interventions to address obesity and related chronic diseases3.
Among the constellation of risk factors for CKD, two interrelated, modifiable lifestyle elements stand out due to their high prevalence and profound impact: physical inactivity and obesity4. Substantial epidemiological evidence has independently linked higher levels of habitual physical activity (PA) with a lower risk of incident CKD and a slower decline in kidney function5. The protective mechanisms are multifactorial, involving improvements in blood pressure control, insulin sensitivity, lipid metabolism, and systemic inflammation. Concurrently, elevated body mass index (BMI) and obesity are well-established, potent drivers of kidney disease, primarily through pathways of glomerular hyperfiltration, adipose tissue dysfunction, and the promotion of a pro-inflammatory, pro-fibrotic state, with longitudinal studies confirming the impact of lifelong BMI increase on cardio-renal-metabolic risk6. In clinical practice and public health guidance, promoting PA and weight management are often recommended in parallel as cornerstones of cardiorenal health.
From a biological perspective, an interaction between PA and BMI is plausible. Individuals with higher BMI often experience greater metabolic stress, systemic inflammation, endothelial dysfunction, and increased hemodynamic burden on the kidneys, all of which contribute to CKD development. Physical activity has been shown to improve these adverse pathways by enhancing insulin sensitivity, reducing inflammatory signaling, and improving vascular and metabolic function7. Because individuals with overweight or obesity typically begin with a greater cardiometabolic burden, the physiological benefits associated with increased physical activity may be more pronounced in this group. This provides a biological rationale for examining whether BMI modifies the association between physical activity and CKD risk.
However, a key gap remains in understanding how PA and BMI jointly influence CKD risk. Most studies have examined these factors as independent or additive contributors contributors7,8, while their potential interaction has been less frequently evaluated. From a physiological perspective, the effects of PA may vary across BMI levels, particularly in individuals with overweight or obesity. However, existing evidence regarding this potential interaction remains limited and inconsistent, and it is unclear whether the protective effect of PA differs across body weight categories. Clarifying this interaction is important for improving risk stratification and informing more targeted prevention strategies. Based on these considerations, we hypothesized that BMI modifies the association between physical activity and incident CKD risk. The objectives were to (1) examine the independent associations of PA and BMI with incident CKD risk; (2) assess the interaction between PA and BMI; and (3) evaluate the potential application of this interaction for risk stratification and personalized intervention.
Protocol
Loading...
$$\rightleftharpoonup{xx}$$
$$\longleftharp{xx}$$,
$$\longrightharp{xx}$$,
Informed consent was obtained from all subjects involved in the study. Written informed consent has been obtained from the patient(s) to publish this paper.
Study Design and Population
This prospective cohort study was based on the Shanghai Suburban Adult Cohort and Biobank (SSACB)9, an ongoing community-based study detailed in previous publications. In brief, the SSACB used a multi-stage, stratified, cluster sampling method to recruit adults aged 20–74 years from suburban communities in Shanghai using a multi-stage, stratified, cluster sampling design. The baseline survey was conducted from June 2016 to December 2017, with the first follow-up assessment occurring from June 2019 to August 2020. For the present analysis, we included participants who had complete baseline and follow-up data. We excluded individuals with: (1) baseline estimated glomerular filtration rate (eGFR) <60 mL/min/1.73 m2, a urine albumin-to-creatinine ratio (ACR) ≥30 mg/g, or a known history of CKD; (2) critical illness (e.g., cancer, stroke, cirrhosis); or (3) missing data on physical activity, BMI, serum creatinine, or key covariates. Participants with missing data were excluded prior to analysis, and a complete-case approach was applied. The proportion of excluded participants due to missing data was low (<5%), minimizing the likelihood of substantial bias. After exclusions, 11,597 participants with normal baseline renal function were included in the longitudinal analysis.
Assessment of Physical Activity (Primary Exposure)
At baseline, habitual PA was assessed using a validated questionnaire adapted from the International Physical Activity Questionnaire (IPAQ)10. Participants reported the frequency (days per week) and duration (minutes per day) of various activities across domains of work, transportation, housework, and leisure-time exercise during the past 7 days. The metabolic equivalent of task (MET) value for each activity was assigned according to the 2000 Compendium of Physical Activities11. Total weekly PA volume was calculated as the sum of MET-minutes per week (MET-min/week) across all domains. For primary analysis, PA was treated as a continuous variable, expressed per 1000 MET-min/week increment.
Assessment of Body Mass Index (Effect Modifier)
Body weight and height were measured in duplicate by trained staff using standardized protocols. BMI was calculated as weight (kg) divided by height squared (m2). For analysis, BMI was analyzed both as a continuous variable (per 1 kg/m2 increase) and as a categorical variable based on Chinese standards: underweight (<18.5 kg/m2), normal weight (18.5–23.9 kg/m2), overweight (24.0–27.9 kg/m2), and obese (≥28.0 kg/m2)12,13.
Ascertainment of Incident CKD (Primary Outcome)
The primary outcome was incident CKD, defined as the development of either: an eGFR < 60 mL/min/1.73 m2, or a urine albumin-to-creatinine ratio (ACR) ≥ 30 mg/g at the follow-up assessment, in participants with normal baseline kidney function. This definition aligns with the Kidney Disease: Improving Global Outcomes (KDIGO) criteria for CKD diagnosis14. Fasting venous blood and spot urine samples were collected at baseline and follow-up. Serum creatinine was measured using enzymatic methods on a Roche Cobas C702 analyzer. Urine albumin concentration was determined by immunoturbidimetry, and urine creatinine concentration was measured by the enzymatic method, both on a Roche Cobas C501 analyzer. ACR was calculated as urine albumin (mg/dL) / urine creatinine (mg/dL) and expressed in mg/g. The eGFR was calculated using the Chronic Kidney Disease Epidemiology Collaboration (CKD-EPI) equation adapted for the Chinese population15. Participants with baseline eGFR ≥ 60 mL/min/1.73 m2 and ACR < 30 mg/g, and no prior CKD diagnosis, were considered at risk. Follow-up time was calculated from the baseline survey date to the date of the follow-up assessment. Participants who met either the eGFR or ACR criterion at follow-up were classified as an incident CKD case.
Assessment of Covariates
Potential confounders were selected a priori based on established literature and assessed at baseline via questionnaire and clinical measurement. These included:
Demographic and Socioeconomic: Age (continuous), sex (male/female), education level (illiterate/no schooling, primary school, middle school, high school or above)16,17,18.
Lifestyle Behaviors19: Smoking status (yes/no; defined as >1 cigarette/day for ≥6 months), alcohol consumption (yes/no; defined as drinking >3 times/week for ≥6 months).
Medical History: Self-reported family history of CKD (yes/no), physician-diagnosed hypertension(yes/no; or SBP/DBP ≥140/90 mmHg), type 2 diabetes mellitus (yes/no; or fasting glucose ≥7.0 mmol/L or HbA1c ≥6.5%), and hyperlipidemia (yes/no; or meeting lipid criteria)20,21. Hypertension, diabetes, and hyperlipidemia were defined based on either self-reported physician diagnosis or clinical measurements obtained during the baseline examination.
Statistical Analysis
Baseline characteristics were compared between participants who developed incident CKD and those who did not. Continuous variables were analyzed using Welch’s t-test, and categorical variables were compared using Pearson’s chi-squared test. Data were presented as mean (SD) or number (percentage), as appropriate. The associations of PA, BMI, and their interaction with incident CKD risk were evaluated using Cox proportional hazards regression models. The proportional hazards assumption was assessed using Schoenfeld residuals.
Two models were constructed: a main effect model, which included PA (per 1000 MET-min/week) and BMI (per 1 kg/m2) as independent variables., and an interaction model, which included the main effects and a multiplicative interaction term (PA × BMI). The statistical significance of the interaction was evaluated using a likelihood ratio test comparing models with and without the interaction term.
All models were adjusted for predefined covariates selected a priori based on clinical relevance and previous literature, including age, sex, education level, smoking status, alcohol consumption, family history of CKD, hypertension, hyperlipidemia, and diabetes. These covariates were selected a priori based on clinical relevance and biological plausibility. Results were reported as hazard ratios (HRs) with 95% confidence intervals (CIs).
To further interpret the interaction between BMI and PA, conditional effects of PA on CKD risk were estimated at selected BMI values (21, 25, and 30 kg/m2), representing normal weight, overweight, and obesity categories, respectively13,22. These values were chosen based on commonly used reference points in epidemiological studies examining effect modification23. Predicted hazard ratios (HRs) across a range of PA levels were calculated using the fully adjusted interaction model and visualized accordingly. To further assess the potential non-linear association between BMI and incident CKD, restricted cubic spline (RCS) regression was performed within the Cox proportional hazards framework. BMI was modeled as a continuous variable using three to four knots placed at recommended percentiles. The overall and non-linear associations were evaluated using Wald tests.
For clinical interpretation, participants were categorized into 12 subgroups according to PA levels (<600, 600–3000, ≥3000 MET-min/week) based on WHO physical activity guidelines24 and BMI categories (underweight, normal weight, overweight, obesity). Incidence rates of CKD (per 100 person-years) were calculated for each subgroup. These subgroups were further grouped into three risk tiers (low, intermediate, and high) based on observed incidence patterns.
Absolute risk reduction (ARR) and number needed to treat (NNT) were calculated to estimate the potential impact of increasing PA from insufficient levels (<600 MET-min/week) to higher activity categories. All statistical analyses were performed using R software (version 4.5.2, RRID:SCR_001905; R Foundation for Statistical Computing). A two-sided P-value < 0.05 was considered statistically significant.
Results
Loading...
$$\rightleftharpoonup{xx}$$
$$\longleftharp{xx}$$,
$$\longrightharp{xx}$$,
Baseline Characteristics of the Study Population
This study ultimately included 11,597 participants with normal baseline renal function, with a median follow-up time of 3.0 years. The participant selection process is illustrated in Figure 1.
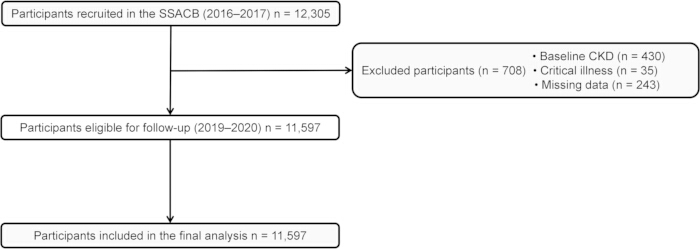
Figure 1: Flowchart of participant selection in the Shanghai Suburban Adult Cohort and Biobank (SSACB). Participants were recruited from the SSACB baseline survey (2016–2017). Individuals with baseline chronic kidney disease (CKD), critical illness (e.g., cancer, stroke, cirrhosis), or missing data on physical activity, body mass index, serum creatinine, or key covariates were excluded. The final analytic cohort included 11,597 participants with normal baseline renal function who were followed up from 2019 to 2020. Please click here to view a larger version of this figure.
As shown in Table 1, compared to the non-CKD group, participants in the incident CKD group were older (mean age: 59.2 vs. 57.8 years) and included a higher proportion of females (69.5% vs. 60.2%). Significant differences were observed between the two groups in terms of age, sex, education level, smoking status, alcohol consumption, and hyperlipidemia (all p<0.05). Participants who developed CKD had significantly lower levels of physical activity compared with those who did not develop CKD (p<0.05). Hypertension showed a borderline difference (p=0.059). No significant differences were found in body mass index (BMI, continuous), family history of CKD, or diabetes.
Association of Physical Activity, BMI, and Their Interaction with CKD Risk
Cox proportional hazards regression models were used to assess the independent and joint associations of physical activity (PA) and body mass index (BMI) with incident CKD (Table 2). In the main effect model, higher PA was independently associated with a lower risk of CKD (per 1000 MET-min/week: HR = 0.91, 95% CI: 0.84–0.98, P = 0.015), whereas BMI as a continuous variable was not significantly associated with CKD risk (HR = 0.98, 95% CI: 0.95–1.01, P = 0.205).
Given the potential interplay between activity and body weight25, we formally tested for effect modification. A significant interaction between PA and BMI was observed (P for interaction = 0.031), indicating that the association between PA and CKD risk varied across BMI levels. Conditional effect analysis showed that the protective association of PA was stronger at higher BMI levels. Specifically, under the same increment of physical activity (per 1000 MET-min/week), the associated reduction in CKD risk was greater at higher BMI levels. For example, this increase in PA was associated with a 28% lower risk of CKD (HR = 0.72) among individuals with obesity (BMI = 30 kg/m2), compared with a 16% lower risk (HR = 0.84) among those with overweight (BMI = 25 kg/m2). Consistent with these findings, the predicted hazard ratios across PA levels demonstrated a steeper decline in CKD risk among individuals with higher BMI (Figure 2).
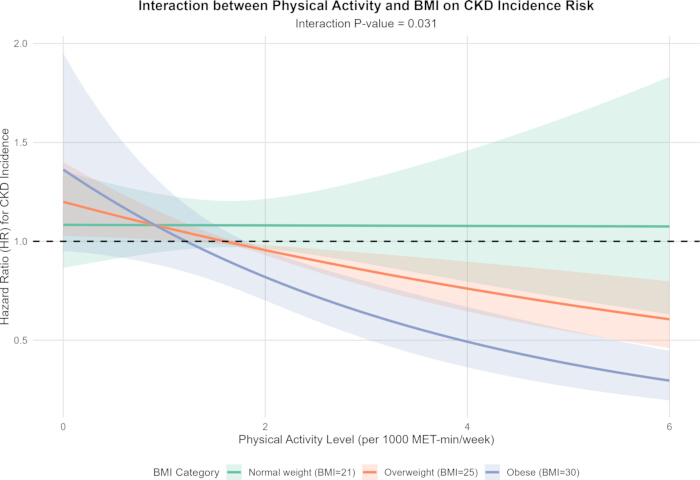
Figure 2: Moderating effect of body mass index on the association between physical activity and chronic kidney disease risk. Predicted hazard ratios (HRs) for chronic kidney disease (CKD), derived from the adjusted Cox regression interaction model, are plotted across a range of physical activity levels for three representative BMI values: 21 kg/m2 (normal weight, green line), 25 kg/m2 (overweight, orange line), and 30 kg/m2 (obesity, purple line). The steeper slope for higher BMI levels illustrates the stronger protective effect of increasing physical activity in individuals with overweight or obesity. Please click here to view a larger version of this figure.
Restricted cubic spline analysis was conducted to explore the potential non-linear association between BMI and CKD risk (Figure 3). The results did not demonstrate a significant non-linear relationship. In addition, BMI was not significantly associated with CKD risk in the overall model.
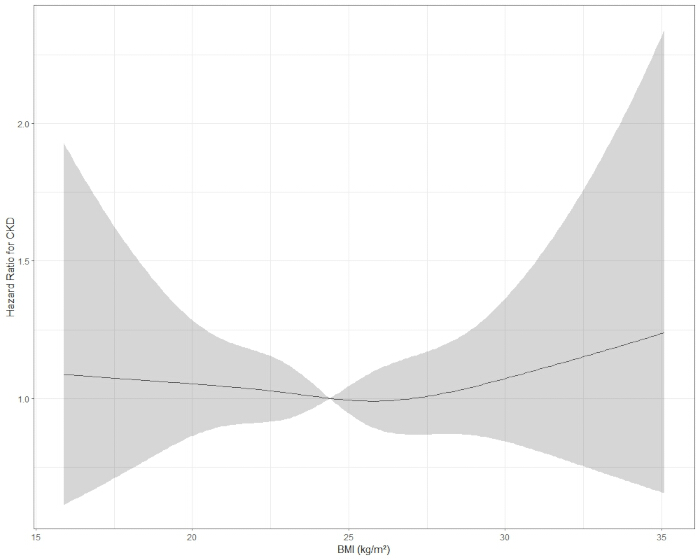
Figure 3: Restricted cubic spline analysis of the association between body mass index and incident chronic kidney disease. Hazard ratios (HRs) for incident chronic kidney disease (CKD) across the range of body mass index (BMI) were estimated using a restricted cubic spline model within the Cox proportional hazards framework. The solid line represents the adjusted hazard ratio, and the shaded area indicates the 95% confidence interval. The model was adjusted for age, sex, education level, smoking status, alcohol consumption, family history of CKD, hypertension, hyperlipidemia, and diabetes. The reference value was set at the median BMI. Please click here to view a larger version of this figure.
Risk Stratification and Estimated Intervention Impact
To further describe the joint distribution of CKD risk across BMI and physical activity categories, we summarized subgroup-specific sample sizes, event counts, and incidence rates in Table 3. In the overweight and obese groups, higher levels of physical activity were generally associated with lower CKD incidence rates. However, this pattern was less consistent in the normal-weight and underweight groups. In particular, some subgroups had relatively small sample sizes, which may have contributed to unstable estimates. Therefore, these stratified results should be interpreted as descriptive and exploratory. This classification is intended for pragmatic interpretation rather than strict monotonic risk ordering.
In summary, higher levels of physical activity were associated with a lower risk of incident CKD, and this protective association was more pronounced among individuals with higher BMI. The interaction analysis further supported that the effect of physical activity on CKD risk varied across BMI levels. Consistent findings from risk stratification and conditional analyses reinforce the robustness of these associations.
Data Availability Statement
The dataset analyzed in this study is derived from the Shanghai Suburban Adult Cohort and Biobank (SSACB) and contains individual-level health information. The anonymized dataset is uploaded as Supplementary File 1.
| Variable | No CKD (n = 11112)¹ | Incident CKD (n = 485)¹ | P-value² |
| Age (years) | 57.8 (9.6) | 59.2 (10.6) | 0.003 |
| Male | 4,422.0 (39.8%) | 148.0 (30.5%) | <0.001 |
| Education level | <0.001 | ||
| Illiterate/no schooling | 1,720.0 (15.5%) | 103.0 (21.2%) | |
| Primary school | 155.0 (1.4%) | 10.0 (2.1%) | |
| Middle school | 3,847.0 (34.6%) | 174.0 (35.9%) | |
| High school or above | 5,390.0 (48.5%) | 198.0 (40.8%) | |
| Body mass index (kg/m², continuous) | 24.5 (3.3) | 24.5 (3.3) | 0.954 |
| Smoking status | 2,567.0 (23.1%) | 79.0 (16.3%) | <0.001 |
| Alcohol consumption | 1,583.0 (14.2%) | 47.0 (9.7%) | 0.006 |
| Family history of CKD | 86.0 (0.8%) | 4.0 (0.8%) | 1 |
| Hypertension | 6,194.0 (55.7%) | 292.0 (60.2%) | 0.059 |
| Hyperlipidemia | 3,085.0 (27.8%) | 158.0 (32.6%) | 0.024 |
| Diabetes | 1,748.0 (15.7%) | 83.0 (17.1%) | 0.451 |
| PA (MET-min/week) | 1,723.3 (1,165.0) | 1,587.1 (1,064.7) | 0.006 |
Table 1: Baseline characteristics of study participants by incident CKD status. Data are presented as mean (SD) for continuous variables and n (%) for categorical variables. Participant characteristics were compared between those who did and did not develop chronic kidney disease (CKD) during follow-up using Welch's t-test (continuous) and Pearson's chi-squared test (categorical).
| Variable | Main Effect Model | Interaction Model | ||
| HR (95% CI) | P-value | HR (95% CI) | P-value | |
| PA (per 1000 MET-min/week) | 0.91 (0.84–0.98) | 0.015 | 1.80 (0.97–3.37) | 0.064 |
| BMI (per 1 kg/m² increase) | 0.98 (0.95–1.01) | 0.205 | 1.03 (0.98–1.08) | 0.306 |
| Interaction: PA × BMI | -- | -- | 0.97 (0.95–1.00) | 0.031 |
| Age (per 1 year) | 1.02 (1.01–1.04) | <0.001 | 1.02 (1.01–1.04) | <0.001 |
| Sex (Female vs. Male) | 1.06 (0.81–1.40) | 0.658 | 1.06 (0.81–1.40) | 0.668 |
| Education (Middle school vs. Illiterate) | 0.65 (0.50–0.83) | <0.001 | 0.65 (0.50–0.83) | <0.001 |
| Education (High school or above vs. Illiterate) | 0.52 (0.39–0.69) | <0.001 | 0.52 (0.39–0.69) | <0.001 |
| Smoking status(Yes vs. No) | 0.83 (0.60–1.14) | 0.252 | 0.83 (0.60–1.14) | 0.247 |
| Alcohol consumption(Yes vs. No) | 0.78 (0.55–1.09) | 0.149 | 0.78 (0.55–1.09) | 0.146 |
| Hyperlipidemia (Yes vs. No) | 1.18 (0.97–1.44) | 0.095 | 1.18 (0.97–1.44) | 0.093 |
Table 2: Cox regression results for the association of physical activity and body mass index with incident CKD. Hazard ratios (HR) with 95% confidence intervals (CI) are shown for both the main effect model (independent associations) and the interaction model (including a PA × BMI product term). All models are adjusted for age, sex, education, smoking, alcohol consumption, family history of CKD, hypertension, hyperlipidemia, and diabetes. A significant interaction was observed (P = 0.031).
| BMI Category | PA Level | n | CKD cases | Person-years | Incidence rate |
| (per 100 person-years) | |||||
| Underweight (<18.5) | Insufficient (<600) | 49 | 2 | 147 | 1.36 |
| Underweight (<18.5) | Sufficient (600–3000) | 284 | 13 | 858 | 1.51 |
| Underweight (<18.5) | Highly active (≥3000) | 51 | 0 | 155 | 0 |
| Normal (18.5–24) | Insufficient (<600) | 670 | 31 | 2027 | 1.53 |
| Normal (18.5–24) | Sufficient (600–3000) | 3395 | 145 | 10225 | 1.42 |
| Normal (18.5–24) | Highly active (≥3000) | 610 | 26 | 1819 | 1.43 |
| Overweight (24–28) | Insufficient (<600) | 677 | 31 | 2047 | 1.51 |
| Overweight (24–28) | Sufficient (600–3000) | 3584 | 148 | 10783 | 1.37 |
| Overweight (24–28) | Highly active (≥3000) | 610 | 16 | 1845 | 0.87 |
| Obese (≥28) | Insufficient (<600) | 244 | 14 | 734 | 1.91 |
| Obese (≥28) | Sufficient (600–3000) | 1218 | 51 | 3654 | 1.4 |
| Obese (≥28) | Highly active (≥3000) | 205 | 8 | 618 | 1.3 |
Table 3: Distribution of CKD incidence across combined BMI and physical activity categories. Participants were cross-classified into actionable risk tiers (High, Intermediate, Low) using WHO-aligned PA categories and Chinese BMI standards. The incidence rate of CKD (per 100 person-years) and recommended physical activity (PA) targets (in MET-min/week) are provided for each subgroup to guide personalized intervention.
Supplementary File 1: Anonymized Participant-Level Analytical Dataset. This supplemental file contains the anonymized participant-level analytical dataset used in this study, including baseline demographic characteristics, body mass index, physical activity measures, clinical covariates, laboratory indicators, follow-up information, and incident chronic kidney disease outcomes. Please click here to download this File.
Discussion
Loading...
$$\rightleftharpoonup{xx}$$
$$\longleftharp{xx}$$,
$$\longrightharp{xx}$$,
This prospective cohort study demonstrates a statistical interaction between PA and BMI in the prevention of CKD. Higher PA was associated with a lower risk of CKD, and a significant interaction indicated that this protective association was stronger at higher BMI levels. The apparent attenuation of the association in normal-weight individuals should be interpreted cautiously, as it likely reflects lower baseline risk rather than a true absence of benefit. Translating this interaction into a risk-stratification framework, individuals with low PA and overweight or obesity exhibited the highest CKD incidence, suggesting that increasing PA may yield greater relative benefits in these groups26. From a methodological perspective, alternative approaches such as time-varying exposure models or intervention studies with repeated measurements may further clarify these relationships. The observed interaction may reflect underlying biological mechanisms, including improvements in metabolic and inflammatory pathways, particularly among individuals with higher BMI; however, these interpretations remain hypothesis-generating, as no direct biomarkers were measured and require validation in future studies.
The significant interaction between PA and BMI may reflect multiple overlapping biological mechanisms. Individuals with overweight or obesity often exhibit cardiometabolic disturbances, including insulin resistance27, chronic low-grade inflammation, endothelial dysfunction, and hypertension, all of which contribute to increased CKD risk28. Physical activity may improve these pathways, and because individuals with higher BMI typically have a greater baseline metabolic burden, the absolute benefit associated with PA may be larger in this group29. In addition, adipose tissue dysfunction may play a role. Visceral adiposity is associated with increased secretion of pro-inflammatory cytokines and altered adipokine profiles, which can contribute to renal injury30. Exercise has been shown to reduce visceral fat and improve inflammatory and metabolic profiles31, which may partially explain the stronger association observed among individuals with higher BMI. Emerging evidence also suggests a role for the muscle-kidney axis32. Skeletal muscle functions as an endocrine organ, releasing myokines that may have anti-inflammatory and metabolic effects. In individuals with higher BMI, who may have relative sarcopenia or altered muscle composition33, increased physical activity may enhance muscle function and metabolic regulation34. Together, these mechanisms may contribute to the observed effect modification, although they remain hypothetical and require further validation.
It is noteworthy that in our risk stratification (Table 3), the aggregated incidence rate in the low-risk tier (4.09 per 100 person-years) was slightly higher than that in the intermediate-risk tier (3.81 per 100 person-years). This apparent inconsistency may be explained by two factors. First, individuals with overweight or obesity in the intermediate-risk tier may derive substantial protective benefits from higher levels of physical activity, thereby reducing their overall risk. Second, the low-risk tier includes underweight individuals, who may have an elevated risk due to factors such as malnutrition, frailty, or underlying chronic conditions. Importantly, despite this overlap between adjacent categories, the high-risk tier consistently exhibited the highest incidence rate, supporting the overall discriminative ability of the risk stratification framework. These subgroup findings should be interpreted as descriptive and exploratory, particularly given the variability across categories and the limited sample size in some subgroups. These findings highlight the importance of considering heterogeneity within BMI categories when applying risk stratification in clinical practice.
Our finding that PA is inversely associated with CKD risk is consistent with prior cohort studies and meta-analyses35. Importantly, our study further extends this evidence by demonstrating that the protective association between physical activity and CKD risk varies across BMI levels, highlighting a potential interaction between lifestyle factors in CKD prevention. The underlying biological pathways, including improvements in hemodynamics, metabolic control, and inflammation, have been widely reported36. In our study, we observed a significant interaction between PA and BMI, indicating that the protective association of physical activity with CKD risk was stronger among individuals with higher BMI. This finding adds further nuance to the existing literature, where PA and BMI are often examined as independent or additive factors and their interaction in relation to CKD outcomes has been less frequently evaluated. Our findings suggest that the protective effect of PA may differ across BMI levels, which is consistent with evidence from cardiometabolic research showing greater exercise-related benefits among individuals with obesity37. Similar patterns have been reported in studies examining improvements in glycemic control, blood pressure, and lipid profiles following exercise in populations with obesity38. This highlights the importance of considering interaction effects when evaluating lifestyle interventions, as ignoring such relationships may underestimate their impact in specific subgroups39. From a clinical and public health perspective, these findings support the use of combined lifestyle strategies targeting both physical activity and body weight. The proposed risk stratification framework may help identify individuals at higher risk and facilitate more targeted interventions in community and primary care settings40. This approach is consistent with prior efforts to implement risk-based prevention strategies in real-world practice41. It may also support more efficient allocation of resources and improved delivery of lifestyle interventions42, particularly within multidisciplinary care models43.
The credibility of our conclusions is bolstered by key methodological strengths: the prospective design mitigates reverse causation; the large, community-derived sample enhances generalizability within the population and provides power to detect interaction effects; the use of physician-adjudicated CKD outcomes based on serial serum creatinine measurements minimizes outcome misclassification; and the comprehensive adjustment for confounders strengthens internal validity. A conscientious consideration of limitations is essential. First, the definition of incident CKD in this study was based on a single follow-up measurement of eGFR and ACR. According to KDIGO guidelines, a diagnosis of CKD requires evidence of persistent kidney dysfunction over at least three months. Therefore, our definition may have introduced potential misclassification, as transient reductions in eGFR or temporary elevations in ACR could have been included. However, this approach is commonly adopted in large-scale epidemiological studies where repeated measurements are not always feasible. Moreover, because the same definition was applied consistently across all exposure groups, any misclassification is likely to be non-differential, which would tend to bias the results toward the null. As such, the observed associations may be conservative estimates, although caution is warranted in interpretation. Second, PA was measured by self-report, which, despite using a structured metric (MET-min/week), is susceptible to recall and social desirability biases compared to objective accelerometry. In addition, physical activity and BMI were assessed only at baseline and not updated during follow-up. Therefore, potential changes in these exposures over time could not be captured, which may have led to exposure misclassification. Third, although we adjusted for major clinical conditions, residual confounding from unmeasured or imperfectly measured factors (e.g., detailed dietary composition, sodium/potassium intake, or sleep apnea severity) cannot be entirely excluded. Fourth, the observational nature of the study precludes definitive causal inference, despite the temporal sequence and biological plausibility supporting a potential causal relationship. Fifth, the cohort is ethnically homogeneous, meaning that the BMI thresholds and magnitude of interaction observed may require calibration when applied to other populations with different adiposity patterns and CKD risk profiles. Sixth, the proposed clinical tool, while derived from observational data, requires prospective validation to confirm its effectiveness in improving long-term behavioral and clinical outcomes. Finally, our risk stratification categorized underweight individuals (BMI < 18.5 kg/m2) into the low-risk tier regardless of physical activity level, which may have contributed to the slightly higher aggregated incidence in this tier compared to the intermediate-risk tier. Future refinements could consider underweight as a distinct risk category.
These findings suggest several directions for future research, including mechanistic studies to clarify the biological basis of the PA–BMI interaction, and intervention studies to evaluate the effectiveness of combined physical activity and weight management strategies in high-risk populations. In summary, this study demonstrates that the protective association between physical activity and CKD is modified by BMI, with greater benefits observed in individuals with overweight or obesity. These findings support a more integrated and individualized approach to lifestyle-based CKD prevention.
Disclosures
Loading...
$$\rightleftharpoonup{xx}$$
$$\longleftharp{xx}$$,
$$\longrightharp{xx}$$,
The authors declare no conflicts of interest.
Acknowledgements
Loading...
$$\rightleftharpoonup{xx}$$
$$\longleftharp{xx}$$,
$$\longrightharp{xx}$$,
This work was supported by The Shanghai new three-year action plan for public health (Grant No. GWVl-11.1-23), and Fudan School of Public Health-Jiading CDC key disciplines and key special projects for the high-quality development of public health (Grant No. GWGZLXK-2023-02). Support was also received from The local high-level discipline construction project of Shanghai, and the National Key Research and Development Program of China (Grant No. 2017YFC0907000) and Shanghai Eastern Talent Plan Top-notch Project 2025 (Grant.BJWS2025025).
Author Contributions: Conceptualization, Yuting Yu and Yonggen Jiang; methodology, Yuting Yu; software, Yuting Yu; validation, Yuting Yu and Yonggen Jiang; formal analysis, Yonggen Jiang; investigation, Yuting Yu; resources, Yonggen Jiang; data curation, Yuting Yu; writing—original draft preparation, Yuting Yu; writing—review and editing, Yonggen Jiang; visualization, Yuting Yu; supervision, Yonggen Jiang; project administration, Yonggen Jiang; funding acquisition, Yonggen Jiang. All authors have read and agreed to the published version of the manuscript.
Materials
| Name | Company | Catalog Number | Comments |
|---|---|---|---|
| Item | Manufacturer / Source | Identifier | |
| Biochemical analyzer | Roche Diagnostics | Cobas C702 | |
| Biochemical analyzer | Roche Diagnostics | Cobas C501 | |
| Physical activity questionnaire | nternational Physical Activity Questionnaire (IPAQ) | https://sites.google.com/site/theipaq/ | |
| Statistical software | R Foundation for Statistical Computing | RRID:SCR_001905 |
Reprints and Permissions
Request permission to reuse the text or figures of this JoVE article
Request Permission