Study examines China’s sharing economy from 2005 to 2020 using a quantile autoregressive distributed lag model. Sharing economy positively correlates with gross domestic product per capita across most quantiles, but nuclear energy consumption only at the highest quantiles. Heterogeneous bidirectional relationships suggest dynamic feedback; causality is unestablished due to observational design and proxy measures.
A subscription to JoVE is required to view this content. Sign in or start your free trial.
Research Article
Synergies of the Sharing Economy: Its Role in China's Energy Transition and Sustainable Development
In This Article
Summary
Abstract
The sharing economy (SECO) has become a disruptive economic model with implications for both economic performance and energy systems. This paper analyzes the relationships among SECO, GDP per capita, and nuclear energy consumption (NEC) in China from 2005 to 2020. The analysis addresses heterogeneous associations among various points of the conditional distribution by using a quantile autoregressive distributed lag (QARDL) framework. The findings show that SECO correlates positively with GDP per capita across most quantiles, suggesting that it contributes to improving economic activity by better resource use and the adoption of digital platforms. On the contrary, the dependency between SECO and NEC is observed to be strong only at the higher quantiles, indicating that its impact on energy dynamics is more significant under conditions of high energy demand. The results also indicate a high degree of heterogeneity and two-way predictive relationships among variables, suggesting the presence of dynamic feedback mechanisms rather than unidirectional influence. The results should be considered indicative associations rather than causal relationships, given the use of proxy measures, the small sample size, and the observational design. Overall, the research provides fine-tuning evidence on the context-specificity of the sharing economy in shaping economic and energy-related dynamics in China's changing development environment.
Introduction
The sharing economy (SECO) has become an innovative economic paradigm that reorganizes the patterns of production and consumption in the traditional economic model with the principles of access, collaboration, and optimization of resources1. The sharing economy, which has been made possible by the fast development of digital technologies, mobile apps, and platform-based business models, helps to utilize underutilized assets more efficiently, which may lead to a decrease in waste and better sustainability results. This change of ownership into access has gained wide acknowledgment as a fundamental element of the current economic restructuring, especially with the growing levels of environmental concern and the world becoming more oriented towards sustainable development2. The topicality of the sharing economy has increased over the past few years because of increasing global challenges (concerns) associated with climate change, environmental degradation, and shortage of resources3. There has been a growing interest of policymakers and researchers in finding new mechanisms that can bring the two (economic growth and ecological sustainability) into harmony4. In this respect, the sharing economy has been framed as a promising paradigm with the potential to minimize environmental footprints by enhancing efficiency, decreasing the amount of material usage, and lowering the emissions brought on by production and ownership5,6.
The Chinese context offers a uniquely valuable example of analyzing these dynamics because of its unique characteristics of high rates of economic development, a huge population, and serious environmental issues. Being the largest energy user and a major contributor to the global greenhouse gas emissions, China is a key factor in the global sustainability pathway7. Given China’s long-standing extensive growth model characterized by high energy consumption, environmental pollution, and rising carbon emissions, and in the context of its ‘Dual Carbon’ goals and global climate governance, promoting green innovation (GIP) is imperative for sustainable development8. China, in turn, has responded to this by a series of policy initiatives geared towards a shift towards a more sustainable and cleaner energy source, which includes large-scale investments in renewable energy and nuclear energy. Nuclear power, as a relatively stable and low-emission source of energy, can provide an alternative to fossil fuels suitable to fuel large-scale production of electricity with the lowest levels of carbon emissions9,10. The development of nuclear power facilities is a sign of what China is willing to do to get to carbon neutrality and to minimize its environmental impact11. However, the effectiveness of this transition depends not only on supply-side energy policies but also on demand-side dynamics, including consumption patterns, technological adoption, and economic structures12,13. A growing body of literature recognizes a close relationship between productivity upgrading and high-quality economic development, with innovation-driven improvements in productivity widely regarded as a core determinant of high-quality growth14,15, more overall consumption may be induced, which cancels out environmental benefits16. In the case of shared services, increased usage might be promoted by convenience and affordability, which can lead to higher energy consumption instead of lowering it17. Existing literature on the sharing economy has primarily focused on its economic, social, and environmental implications in isolation18. A growing body of research has examined the role of SECO in promoting economic growth, innovation, and entrepreneurship, highlighting its potential to generate new income streams and improve market efficiency19. Other studies have explored its environmental impacts, with mixed conclusions regarding its ability to reduce carbon emissions and resource consumption20. More recent research has begun to integrate these perspectives, emphasizing the need to consider the interconnected nature of economic and environmental systems21.
More recent research has enriched the concept of sustainability transitions by including the financial, technological, and decision-support lenses22. To give an example, studies on green financing point out the importance of such tools as green bonds in reducing environmental degradation and promoting energy transitions towards sustainability23. Equally, the multi-criteria decision-making models have been used in urban sustainability and green economy policies, highlighting the need to have integrated and data-based policy appraisal24. Also, there is emerging evidence of the asymmetric impacts of climate vulnerability and adaptive capability on economic growth in developing economies, highlighting the complications of the sustainability dynamics. Moreover, the expansion of artificial intelligence use in the corporate environment has proven to improve environmental and economic performance, which suggests the growing importance of digital transformation in sustainability trajectories25. Despite these improvements, there are still several significant gaps. The first one is that there is little empirical data on the connection between the sharing economy and energy use, specifically with nuclear power. Although much has been written on renewable energy sources, nuclear energy has been a subject of under-research despite its increasing role in energy changes in the world. Second, the majority of the literature uses linear/mean-based econometric models that may not be effective in defining the nonlinearity and heterogeneity of relationships that define complex economies. Third, it is deficient in thorough studies that focus on the interrelationships among SECO, economic performance, and energy dynamics, in a single study.
To fill these gaps, the current paper explores the interconnection between the sharing economy, GDP, and nuclear energy consumption (NEC) in China between the years 2005 and 2020. GDP per capita to its ability to reflect the economic aspect of sustainable development, and nuclear energy consumption is used as a measure of energy transition dynamics. Control variables are added, including birth rate (BR), unemployment rate (UNR), real interest rate (RIR), and energy prices (EP), which makes the analysis of the macroeconomic and demographic variables that impact sustainability outcomes more comprehensive. These variables have been chosen based on theoretical and empirical factors. Resource consumption and environmental impact are directly related to economic growth, which is an important metric of sustainability. The use of nuclear energy portrays how much the cleaner sources of energy are being embraced in the energy mix26. Population growth and, by extension, energy demand are affected by demographic issues, including birth rate27. The conditions of the labor market in terms of unemployment rate impact the level of income and consumption, interest rates and energy prices impact the investment decision and consumption of energy28. The methodologically used approach is the quantile autoregressive distributed lag (QARDL) to represent the heterogeneous impacts of the sharing economy and various levels of economic performance and energy use. The QARDL model can be used to estimate the relationship between variables at various levels of the distributions of the dependent variables, as opposed to the traditional regression procedures, which estimate the average effects. This is especially crucial given the fact that the economic environment in China is diverse and changing, and the effects of SECO can thus differ greatly at various levels of economic growth29.
The choice of the QARDL framework is motivated not only by the non-normal distribution of the data but, more fundamentally, by well-grounded economic expectations of distributional heterogeneity. At lower quantiles of GDP per capita, representing periods of economic slack or recessionary conditions, the sharing economy is likely to exert a stronger marginal effect on economic performance by enabling underutilized labor and physical assets to enter productive use, reducing transaction costs for low-income households, and providing income-smoothing opportunities through flexible platform work30. In contrast, at higher quantiles corresponding to periods of robust economic expansion, the marginal contribution of the sharing economy may diminish or shift in nature, operating less through resource-access channels and more through efficiency-enhancing digital integration and innovation spillovers like mixed order of integration31. Similarly, for nuclear energy consumption, the effect of sharing economy activity is expected to be negligible at low quantiles, where energy demand is subdued and infrastructure constraints bind32,33, but increasingly pronounced at high quantiles, where heightened economic activity amplifies both the digital infrastructure demands of platform operations and the electrification of shared mobility services, the incremental supply of which is met disproportionately by nuclear baseload capacity under China's decarbonization policy regime34. Moreover, another study stated that, although technological innovation has grown in importance, previous studies have generally examined corporate governance, audit quality, and technological innovation as separate factors influencing firm performance, rather than considering their potential interconnections35.
While a direct causal link between platform-based mobility services and nuclear electricity output is not immediately apparent, this study posits a multi-stage, indirect transmission mechanism grounded in the literature on energy economics, digital transformation, and sustainable consumption. The authors do not argue that shared bicycles or ride-hailing apps directly "produce" nuclear energy. Rather, the authors theorize that the sharing economy influences nuclear energy consumption through three interconnected pathways: (1) aggregate electricity demand effects via digital infrastructure expansion, (2) structural shifts in the energy mix driven by policy and efficiency gains, and (3) macroeconomic feedback loops that alter the scale and composition of national energy consumption.
Access restricted. Please log in or start a trial to view this content.
Protocol
This study exclusively uses publicly available secondary data from the World Development Indicators, international energy statistics databases, and news sources (Factiva, LexisNexis). No human subjects, personal data, or experimental interventions were involved. Therefore, ethical approval was not required. All data sources are cited transparently to ensure reproducibility. The proposed study is based on a quantitative time-series design, which is used to analyze the relationships between the sharing economy (SECO), GDP, and nuclear energy consumption (NEC) in China during the years ‘2005–2020’. The data are all gathered based on publicly accessible sources to ensure transparency and replication. This study uses GDP per capita as the dependent variable, which is abbreviated as GDP in the text, following the established practice of treating per capita income as a core indicator of the economic dimension of sustainable development. While not a direct environmental measure, sustained economic performance provides the resource base necessary for investments in clean energy and environmental protection. Please see (Table of Materials).
Data compilation and variable construction
Macroeconomic variables (GDP per capita, birth rate, unemployment rate, real interest rate, energy prices) are annual data (constant 2015 USD) from World Development Indicators (WDI). Nuclear energy consumption (NEC) comes from international energy statistics databases (IEA/BP Statistical Review). The sharing economy (SECO) proxy is constructed as follows. On 1 March 2023, the authors searched Factiva, LexisNexis, and major Chinese media outlets (Caixin, China Daily, Xinhua) using the Boolean string: (“ride-sharing” OR “car-sharing” OR “Didi” OR “Uber China”) AND (“growth” OR “utilization” OR “regulation” OR “market”). Inclusion criteria: reports on operational growth, platform utilization, regulatory developments, or market dynamics of ride-sharing in China, 2005–2020. Exclusion: duplicates, irrelevant mentions (e.g., unrelated Uber global news), and non-substantive entries (<50 words). Two reviewers independently screened titles/abstracts, resolving disagreements by consensus. Duplicates were removed via RefWorks’ automated deduplication followed by manual verification. Annual counts of validated reports were summed, then natural-log-transformed to produce the SECO index. The full search protocol, screening log, and annual raw counts are available in the supplementary materials.
This proxy has several limitations. First, it is narrowly confined to ride-sharing, excluding other sharing economy sectors (accommodation, peer-to-peer finance, goods sharing). Second, media report frequency is an indirect, noisy measure, potentially influenced by journalistic attention or regulatory announcements rather than direct transaction volumes. Third, ridesharing in China became substantial only after 2010, yielding sparse observations in early sample years. Finally, no consistent alternative proxy exists for robustness checks due to the lack of official time-series data on transaction volumes or user penetration in China, 2005–2020. Thus, the SECO index is an exploratory indicator of platform-based mobility activity, and findings are indicative associations, not definitive causal estimates. All non-percentage variables are natural-log-transformed. Descriptive statistics were computed to examine distributions and outliers.
The narrow scope of the SECO proxy limited to ride-sharing media reports means that the empirical patterns identified in this study cannot be directly generalized to the wider sharing economy, which encompasses accommodation sharing, peer-to-peer finance, goods exchange, and other collaborative activities. Moreover, a media-based index is susceptible to fluctuations driven by regulatory announcements, public controversies, or editorial attention rather than by actual changes in sharing-economy transactions. This measurement noise may attenuate or inflate the observed associations in ways that cannot be fully disentangled. The extremely sparse news coverage before 2010 further reduces the information content at the early part of the sample; consequently, the quantile estimates at the lower tail of the distribution may primarily reflect post-2010 dynamics and should not be interpreted as capturing a genuine pre-emergence phase of the sharing economy. In light of these constraints, all findings reported in this study are best viewed as tentative, ride-sharing-specific correlations that describe how a particular sector of platform-based mobility covaries with macroeconomic and energy indicators under different economic regimes. Cautious extrapolation to the broader sharing economy is warranted only after future research validates these relationships using more direct, multi-sector measures of sharing economy activity.
Detailed variable definitions and transformations
All variables used in the analysis are compiled as annual time-series data for China over the period 2005–2020. The exact sources, units, transformations, and operational definitions are specified as follows: nuclear energy consumption (NEC). NEC is measured as total nuclear energy consumption in terawatt-hours (TWh), obtained from international energy statistics databases (e.g., IEA/BP Statistical Review). The variable is transformed to natural logarithms (lnNEC) to stabilize variance and reduce skewness. Energy prices (EP), EP is proxied by global crude oil prices (US dollars per barrel), sourced from the World Development Indicators (WDI). The series is converted to natural logarithms (lnEP) to ensure comparability and reduce heteroscedasticity. Birth Rate (BR) is measured as the crude birth rate (births per 1,000 people), obtained from WDI. As this variable is expressed as a percentage, it is used at the level without a logarithmic transformation. Unemployment Rate (UNR), UNR represents the total unemployment rate as a percentage of the labor force, sourced from WDI. This variable is also retained in level form due to its percentage-based measurement. Real interest rate (RIR) is derived using the standard Fisher equation:

where i denotes the nominal interest rate, and ππ represents the inflation rate measured by the consumer price index (CPI). Both components are obtained from the World Development Indicators (WDI). The resulting real interest rate is expressed as a percentage and used in level form. Prior to estimation, all logarithmically transformed variables are checked for stationarity, and consistency in units is maintained across the dataset to ensure comparability.
Estimation procedure
The empirical analysis follows a structured multi-step procedure:
Stationarity testing
The Augmented Dickey Fuller (ADF) test is applied to examine the stationarity properties of each variable. To account for potential structural breaks, the Zivot–Andrews unit root test is additionally employed, allowing for one endogenous break in the time series. Variables are classified according to mixed order of integration, ensuring compatibility with the ARDL framework.
Lag length selection
Optimal lag lengths for the ARDL and QARDL models are selected using the Schwarz Information Criterion (SIC). The SIC is preferred because it provides more parsimonious specifications, which is particularly appropriate given the relatively small sample size. The same lag structure is maintained across quantiles to ensure consistent estimation and comparable results.
Model specification
Two models are specified: Model 1: GDP as a function of SECO, BR, UNR, and RIR. Model 2: NEC as a function of SECO, BR, and EP. These models are estimated within the Quantile Autoregressive Distributed Lag (QARDL) framework to capture heterogeneous effects across different quantiles τ = 0.05–0.95.
QARDL estimation
The Quantile Autoregressive Distributed Lag (QARDL) model is employed to explore how the associations among the sharing economy, macroeconomic factors, and the dependent variables (GDP per capita and nuclear energy consumption) may differ across the conditional distribution. In contrast to mean-based ARDL models, the QARDL framework estimates separate coefficients for each quantile τ (τ = 0.05–0.95), thereby capturing potential heterogeneity that would be averaged out in linear models. The error correction term (ECT) is derived from the long-run relationship at each quantile; a negative and statistically significant ECT coefficient is interpreted as evidence of mixed order of integration around the quantile-specific long-run equilibrium.
Caveat on sample size and interpretation
The analysis is constrained by a small annual time series (16 observations, 2005–2020). To mitigate the risk of over-parameterization, lag orders are selected using the Schwarz Information Criterion (SIC), which favors parsimonious specifications. The resulting lag structures are short (typically no more than 1 lag per variable), limiting the number of estimated parameters per quantile. Despite these precautions, the limited degrees of freedom reduce the precision of estimates, especially at the extreme tails (τ = 0.05, τ = 0.95), where data density is lowest. Therefore, all results from the QARDL model should be interpreted as exploratory, indicative associations rather than definitive causal effects. The coefficient magnitudes and significance levels are used to describe patterns of covariation at different economic and energy-use regimes, not to quantify structural impacts. Robustness checks, including alternative lag specifications and a placebo permutation test, support the qualitative stability of the patterns, but the study’s inferential scope remains circumscribed. The authors underscore the need for future research employing larger samples or higher-frequency data to validate and extend these preliminary findings.
Hypothesis testing and decision rules
Statistical significance is evaluated at conventional levels (1%, 5%, and 10%). The Wald test is used to examine parameter constancy across quantiles; rejection of the null hypothesis indicates the presence of asymmetry. Quantile Granger causality tests are conducted to determine the direction of causal relationships between variables.
Robustness and diagnostics
Diagnostic checks employed the Breusch-Godfrey Lagrange Multiplier (LM) test for serial correlation (Stata command estat bgodfrey), accepting no serial correlation at p > 0.05. The Jarque–Bera test (jb in Stata) assessed normality of residuals; non-normality was tolerated given quantile regression assumptions, but consistency of coefficient signs across quantiles was verified. Model stability was evaluated using the cumulative sum (CUSUM) and CUSUM of squares (estat stability) tests, with stability inferred when plots remained within the 5% critical bounds. Heteroskedasticity was tested via the White test (estat hettest), accepting homoskedasticity at p > 0.05. Results that varied across quantiles indicated heterogeneous effects, whereas consistent estimates across quantiles indicated robustness. All tests were implemented in Stata 17.0 with default threshold parameters.
Replication guidance
To facilitate full replication, all data sources (World Development Indicators and international energy statistics databases), variable definitions, transformations (natural logarithm for non-percentage variables), and estimation procedures are explicitly documented. An independent researcher can reproduce the analysis by retrieving the identical annual datasets for China (2005–2020), applying the specified logarithmic transformations, and estimating the Quantile Autoregressive Distributed Lag models using conventional econometric software (e.g., Stata 17.0) with the Schwarz Information Criterion for lag selection and quantile range τ = 0.05 to 0.95.
Software and implementation
All the econometric analyses were made in Stata. Quantile Autoregressive Distributed Lag (QARDL) model was applied using user-written routines relying on quantile regression and ARDL models. Quantile Granger causality analysis and Wald tests of parameter constancy were done with built-in post-estimation commands and established quantile regression-based procedures, respectively. All analyses, including unit root tests (ADF, Zivot-Andrews), lag selection, and diagnostic tests, were conducted in Stata to ensure consistency and reproducibility.
Research model of the study
The authors put out two approaches to evaluate how a shared resource economy would affect equitable development and power transformation. The first approach evaluates the connection between long-term prosperity and a communal economy while accounting for price hikes, joblessness, and rising populations. The second approach calculates the correlation between a sharing society and energy conservation, accounting for growing populations and power price fluctuations. Figure 1A illustrates Model 1, in which the sharing economy (SECO), unemployment rate (UNR), real interest rate (RIR), and birth rate (BR) are hypothesized to influence GDP per capita (GDP). Figure 1B illustrates Model 2, in which the sharing economy (SECO), birth rate (BR), and energy prices (EP) are hypothesized to influence nuclear energy consumption (NEC).
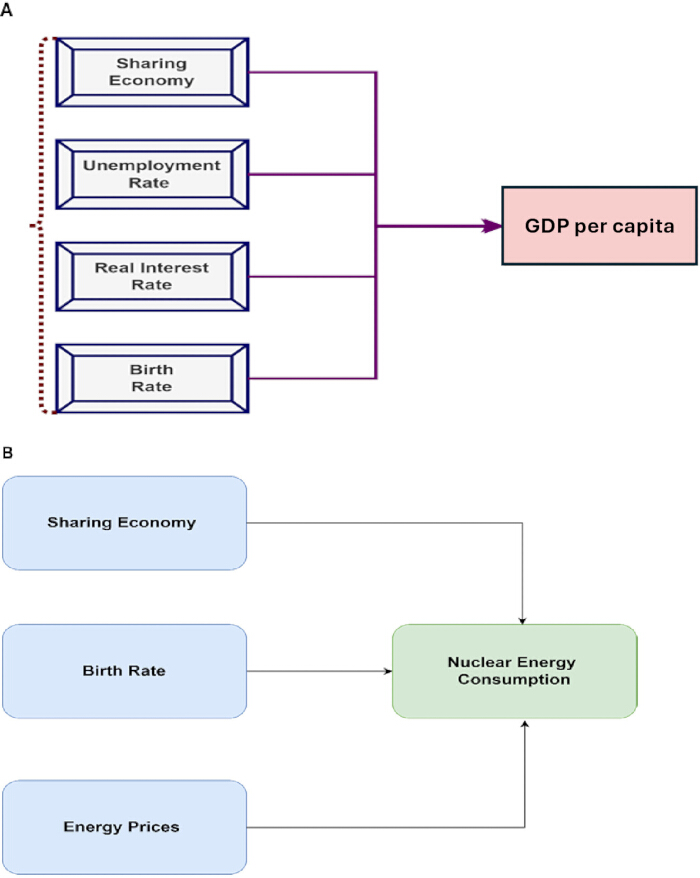
Figure 1: Conceptual frameworks for Model 1 and Model 2. (A) illustrates the hypothesized relationships in which the sharing economy, unemployment rate, real interest rate, and birth rate influence green economic performance, as measured by GDP per capita (GDP). (B) presents the framework for nuclear energy consumption, with the sharing economy, birth rate, and energy prices as main determinants. Arrows indicate the directional effects proposed in each model. Please click here to view a larger version of this figure.
 (2)
GDP is the abbreviation for the nation's economic output per individual, SECO stands for the sharing economy, BR is the Birth Rate, and RIR is the Real Interest Rate. In a comparable vein, the second version is defined as follows:
 (3)
EP is an acronym for energy prices, and NEC is for nuclear energy Consumption (NEC).
Different metrics and resources for data
Economic performance and green development are measured with the help of GDP per capita (GDP). The energy transition dimension is nuclear energy consumption (NEC). The sharing economy index (SECO) is estimated using a proxy index of media coverage of platform-based mobility services (e.g., Didi and Uber China). The rate of unemployment (UNR) is given as a percentage of the working population, whereas the birth rate (BR) is used to show population dynamics. Nominal interest rates and inflation (CPI) determine the real interest rate (RIR), and the prices of energy (EP) are proxied by the world crude oil prices. All macroeconomic data are obtained from the World Development Indicators (WDI).
| Variable | Abbreviation | Proxy / Measurement | Unit | Data source |
| GDP per capita | GDP | GDP per capita (constant 2015 US dollars) | US dollars (log-transformed) | World Development Indicators (WDI) |
| Sharing economy index | SECO | Annual count of validated news reports on ride-sharing platforms (Didi, Uber China), natural-log-transformed | Index (log-transformed) | National and international news databases (Factiva, LexisNexis, Chinese media) |
| Nuclear energy consumption | NEC | Total nuclear energy consumption | Terawatt-hours (TWh), log-transformed | International Energy Statistics (e.g., IEA / BP Statistical Review) |
| Energy prices | EP | Global crude oil price | US dollars per barrel, log-transformed | World Development Indicators (WDI) |
| Birth rate | BR | Crude birth rate | Births per 1,000 people (level form) | World Development Indicators (WDI) |
| Unemployment rate | UNR | Total unemployment rate | Percentage of labour force (level form) | World Development Indicators (WDI) |
| Real interest rate | RIR | Derived via Fisher equation: nominal interest rate minus CPI inflation | Percentage (level form) | World Development Indicators (WDI) |
Table 1: The parameters' descriptions. Descriptions of variables, their proxies, and the data sources used in the study. GDP per capita is used as a measure of economic growth. The Sharing Economy (SECO) is measured using media reports on China's car-sharing platforms.
Table 1 summarizes all variables used in the study, their abbreviations, empirical proxies, measurement units, and data sources. The dependent variables are GDP per capita (GDP, from WDI) for economic performance and nuclear energy consumption (NEC, from energy statistics) for energy transition. The main independent variable is the sharing economy index (SECO), constructed as a log-transformed count of ride-sharing news reports (Didi, Uber China) from Factiva, LexisNexis, and Chinese media. Control variables include energy prices (EP, global crude oil prices), birth rate (BR), unemployment rate (UNR), and real interest rate (RIR), all sourced from WDI. Percentage-based variables (BR, UNR, RIR) remain in level form, while GDP, SECO, NEC, and EP are natural-log-transformed to stabilize variance. The SECO proxy is limited to ride-sharing and should be interpreted as an exploratory indicator (see methodology for limitations).
Estimating methods
Testing for roots of units (Testing ADF sans structural damage)
In many real-world investigations, the enhanced Dickey-Fuller (ADF) test is one of the most frequently used techniques for establishing the existence of a single core. The ADF test supplements the Dickey-Fuller test by accounting for delayed outcomes in the outcome indicator. Second, disparities are regressed on variations between delayed and k-lagged initial values, with consistent and linear causal movements, as seen in the following example.
 (4)
Where Δ represents the GDP succession, Y is the initial variance, and ε_t is a random term. The t-sig technique is used in this test to select the ideal lag duration. According to the examination's null hypotheses, the series has a unit root, but the alternative theory claims the opposite. Meanwhile, structural discontinuities exist in the time sequence; the ADF test may result in a biased determination of a single core. When the show is cut short, a problem develops since the shock may have a long-term effect on the show. If the sequence stays still, the problem gets worse. The jolt, firstly, merely has a passing effect, but where the structure collapses, the shock has a lasting effect. Unintentionally, the base root of the unit may not be denied because of this. As a result, multiple research studies have shown that a mysterious gap in the sequence reduces the skewed results of root-based testing. Created the methodical trend-breaking model by expanding on the idea and including an exogenous breaking. The model differs from that of D(TB), the incident's victim varying, is not present. The names of these automobiles are, respectively, Models A, B, and C. In models A and B, only modifications to the intersection are allowed, while model C allows modifications to both the intersection and the gradient.
 (5)
 (6)
 (7)
Equations (4), (5), and (6) extend the standard augmented Dickey-Fuller (ADF) regression by allowing for exogenous structural breaks, thereby addressing the loss of power that occurs when a time series contains a break but the conventional ΔYt = µ + αYt-1 + βt + ΣcjΔYt-j + εt model is used. Equation (4) (Model A) includes only an intercept-break dummy DUt (with coefficient ϑ), which equals 0 before a break date and 1 afterward, capturing a one-time shift in the level of the series. Equation (5) (Model B) includes only a trend-break dummy DTt^* (with coefficient γ), which equals *t* T_B after the break and 0 otherwise, allowing a change in the slope of the trend. Equation (6) (Model C) includes both DUt and DTt^, with coefficients ϑ and γ, respectively, thereby permitting simultaneous shifts in both the intercept and the trend. In all three equations, ΔYt is the first difference of the series, Yt-1 is the lagged level, µ is a constant, β is the coefficient on the linear time trend *t*, ΣcjΔYt-j* adds lagged differences to correct serial correlation, and εt is the error term. The null hypothesis of a unit root (α = 0) is tested against the alternative of trend stationarity with a structural break, and each break date is evaluated separately (or treated as unknown) to avoid the biased failure to reject the unit-root null that plagues the standard ADF test when a break is present.
Stationarity testing
To guarantee the validity of time-series analysis and prevent spurious regression, the stationarity of all variables is analyzed with the help of various unit root tests. The augmented Dickey Fuller (ADF) test is first used as a null method since it is used to test the presence of unit roots by assuming that there are no structural breaks. Nonetheless, macroeconomic time series tend to have structural changes because of policy changes, economic crises, or foreign shocks. To do this, the ZivotAndrews (ZA) unit root test is utilized, which also enables one endogenous structural break in the intercept and/or the trend of the series. All the variables are thus tested by ADF and ZA tests to provide a consistent and reliable determination of the mixed order of integration before the model is estimated.
QARDL model
The Quantile Autoregressive Distributed Lag (QARDL) model is used to estimate both short-run and long-run relationships across conditional quantiles ‘τ = 0.05–0.95’. For each quantile, the dependent variable is expressed as a function of its lagged values and lagged explanatory variables. The coefficients, therefore, vary across quantiles, allowing the effects to differ across the distribution while maintaining a consistent lag structure.
Version 1:
 (8)
Version 2:
 (9)
The delay phases p and q are selected using the Schwartz informational criteria, and t stands for the white noisy inaccuracy term. In the specified models, GDP represents GDP per capita (proxy for green economic performance), SECO denotes the sharing economy index, BR is the birth rate, UNR is the unemployment rate, RIR is the real interest rate, and EP represents energy prices. Formulas (i) and (ii) are converted into percentile form, as suggested in formulas (iii) and (iv) below.
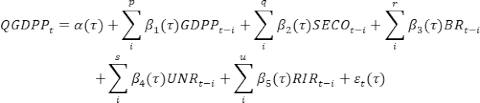 (10)
 (11)
In the quantile specification, the dependent variables GDP (Model 1) and NEC (Model 2) are estimated across quantiles ‘0.05–0.95’. The error term captures deviations from the conditional quantile of the respective dependent variable. This formulation ensures consistency with the variables included in each model. Potentially successive connection is considered by the white noise disruption factor in formulas (v) and (VI):
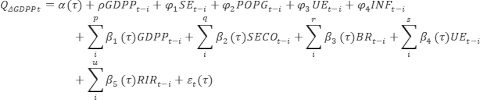 (12)
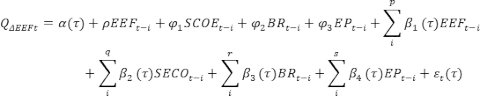 (13)
An error-correcting model (ECM) can represent the previous formulas, whereby formulas (vii) and (viii) compensate for the measure of the ARDL strategy.
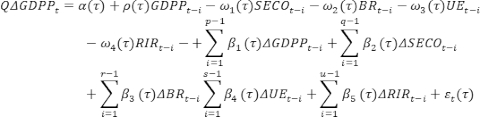 (14)
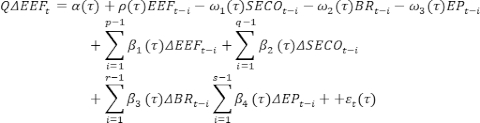 (15)
The error correction term (ECT) represents the speed of adjustment toward the long-run equilibrium. A negative and statistically significant ECT coefficient indicates convergence to equilibrium following short-run deviations. The short-run coefficients capture immediate dynamic effects, while the long-run coefficients are derived from the lagged level relationships within the QARDL framework.
The Granger causality test and the Wald test
The authors use the Wald equation to determine all self-sufficient covariates' long- and short-term asymmetry impact (the rate of feature adjustment), with H0 * (0.05) = * (0.10)...* (0.95). An identical theory is explored for the long run: SECO, UNR, BR, and RIR. The percentage Granger causality test, which is used to examine the causative quantile relationships between the two types of variables, is introduced. When a factor (Xi) does not affect the estimate of another factor (Yi), there is no Granger causality between the two variables. The previous indicator group of Xi, Nix, is assumed to be (Ni = Niy, Nix)' Re, s = o + q, where Nix is equal to (Xi-1, Xi-q)' Rq, a causal relationship exists involving Xi and Yi, and this is H0:
 (16)
Since (NiY, NiX) and Yi are Fy, the interim allocation aim corresponds to (.| NiY, NiX). According to the null assumption that there is no Kendall direct relationship, considering the DT test conducted by classifying A QAR technique m (•) for the entire [0,1] population as follows:
Minimum probability estimation is used to determine the variables [() = (1() 2 ()] and t, and 1Y (.) is the inverse of a general distributed functional. The QAR (1) formula, which relies on equations (xi), is finally:
 (17)
Although the SECO proxy is built on the foundation of ride-sharing services and applications, the strategy aligns with the current body of literature that considers shared mobility as a dominant and quantifiable element of the overall sharing economy, especially in China, where shared mobility platforms are the primary drivers of digital collaborative consumption. Due to the constraints of data and the absence of national indicators of the sharing economy that are standardized in a single form, platform-based proxies have become popular in empirical studies. Nevertheless, it is recognized that such a measure might not be necessarily adequate to capture all aspects of the sharing economy, especially during the initial phases, 2005–2010, when there was little adoption and mainstream media coverage of platforms. This is considered during the interpretation of the results.
The data analysis is performed on the data covering the period ‘2005–2020’ annually, which provides a rather small sample size. Although the QARDL paradigm can be used in small-sample time-series analysis, multiple econometric tests, such as structural-break unit root testing, quantile estimation with multiple quantiles, Wald tests, and quantile Granger causality, can create limitations in the stability of the parameters and the statistical power. To reduce the chances of over-parameterization, lag lengths are chosen by the Schwarz Information Criterion (SIC), which has a bias towards more parsimonious model specifications. However, the findings need to be taken with caution, especially in the extreme quantiles, where fewer observations can impact the accuracy of estimation.
Access restricted. Please log in or start a trial to view this content.
Results
Preliminary data and structural break analysis
Descriptive statistics for all variables are reported in Table 2, based on an effective sample size of 16 annual observations from 2005 to 2020. The table presents the mean, minimum, maximum, standard deviation (as the measure of variability), and the Jarque–Bera (J‑B) test for normality with exact p‑values. Among the variables, GDP per capita (GDP) has the highest mean (55.5), while nuclear energy consumption (NEC) has the lowest mean (...
Access restricted. Please log in or start a trial to view this content.
Discussion
This paper examined how the sharing economy (SECO) is associated with China's sustainable development path as seen in terms of its relationships with GDP and nuclear energy consumption (NEC). Using the Quantile Autoregressive Distributed Lag (QARDL) framework, the results provide a more detailed picture of the varying associations based on different levels of economic performance and energy consumption. The quantile‑based approach adds to the accumulating literature on the importance of heterogeneous effects in...
Access restricted. Please log in or start a trial to view this content.
Disclosures
All authors declare no conflicts of interest.
Acknowledgements
The authors have no acknowledgments and receive no external funding for this study.
Access restricted. Please log in or start a trial to view this content.
Materials
| Name | Company | Catalog Number | Comments |
|---|---|---|---|
| Factiva database | Dow Jones | https://global.factiva.com[reference:3] | Secondary news database used to collect annual counts of ride-sharing reports (keyword search: “ride-sharing”, “car-sharing”, “Didi”, “Uber China”) for constructing the SECO proxy index. |
| International energy statistics databases (e.g., IEA / BP Statistical Review) | International Energy Agency (IEA) / BP | https://www.iea.org/data-and-statistics | Source for nuclear energy consumption (NEC) measured in terawatt-hours (TWh). |
| LexisNexis database | RELX Group | https://advance.lexis.com[reference:4] | Secondary news database used alongside Factiva to collect ride-sharing related reports for the SECO proxy index. |
| Major Chinese media outlets (e.g., Xinhua, China Daily, Caixin) | Various (state and private) | N/A | Additional secondary sources for news reports on ride-sharing platforms (Didi Chuxing, Uber China) to ensure comprehensive coverage for the SECO index. |
| QARDL estimation routines (user-written) | N/A (community-contributed) | N/A | Stata routines implementing Quantile Autoregressive Distributed Lag models for short-run and long-run estimation across quantiles (τ = 0.05 to 0.95). |
| Stata (version 17.0) | StataCorp LLC | SCR_012763 | Primary software for all econometric analyses: QARDL estimation, unit root tests (ADF, KPSS, Zivot-Andrews), lag selection (SIC), Wald tests, and quantile Granger causality. |
| World Development Indicators (WDI) database | World Bank | https://databank.worldbank.org/source/world-development-indicators | Source for macroeconomic annual data (2005–2020): GDP per capita (GDPP), birth rate (BR), unemployment rate (UNR), real interest rate (RIR), and energy prices (EP, proxied by global crude oil prices). |
| Zivot-Andrews unit root test routine (user-written) | N/A (community-contributed) | N/A | Stata routine employed to test stationarity with one endogenous structural break (Models A, B, C). |
References
- Li Y, Oberheitmann A. Challenges of rapid economic growth in China: reconciling sustainable energy use, environmental stewardship and social development. Energy Policy. 2009 Apr 1;37(4):1412-22.
- Ye J, Moslehpour M, Tu YT, Ngo TQ, Nguyen SV. Investment in environmental, social, and governance activities and their impact on achieving sustainable development goals: evidence from Chinese manufacturing firms. Economic research-Ekonomska istraživanja. 2023 Mar 31;36(1):333-56.
- Nie Y. Analysis of the impact of green economic policies on the sharing economy and the synergistic mechanism of business analysis. J Educ Humanit Soc Sci. 2025;61:65-70.
- Shang Y, Lee H, Ma J. A Study on the Spatial Effects of the Digital Economy on Regional Economic Growth in China. Sustainability. 2025 Mar 5;17(5):22-59.
- Niaz MS, Khoso AK, Talpur KR, Talpur BA. Beyond the curve: how economic complexity and pandemics reshape the energy‑emissions nexus in Asia. IEEE Access. 2026;14:22946-22957.
- Lyaskovskaya E, Khudyakova T. Sharing economy: For or against sustainable development. Sustainability. 2021 Oct 6;13(19):11056.
- Ling S, Gao H, Yuan D. Catalytic role of the digital economy in fostering corporate green technology innovation: A mechanism for sustainability transformation in China. Economic Analysis and Policy. 2024 Dec 1;84:278-92.
- Huang J, Zhou L, Yi S. Has the integration of digital and real economies promoted green innovation in the Yangtze River Economic Belt? J Financ Econ Dyn (JFED). 2026;1(1):1-20.
- Wang Z, Zhang H, Wang B, Ding Y. Towards a synergistic future: the impact of power sector decarbonization on Sustainable Development Goals in China. Sustain Prod Consum. 2025;56:385-395.
- Xu M, Tan R. Digital economy as a catalyst for low-carbon transformation in China: new analytical insights. Humanities and Social Sciences Communications. 2024 Jun 27;11(1):1-4.
- Liu H, Zhu Q, Khoso WM, Khoso AK. Spatial pattern and the development of green finance trends in China. Renew Energy. 2023;211:370-378.
- Ma N, Deng Y. Synergistic governance of digital economy development and carbon reduction: evidence from Chinese cities. Ecol Chem Eng S. 2024;31(2):203-213.
- Luo K, Liu Y, Chen PF, Zeng M. Assessing the impact of digital economy on green development efficiency in the Yangtze River Economic Belt. Energy Economics. 2022 Aug 1;(112):106-127.
- Geng K, Zhang X. How new quality productive forces interact with high‑quality economic development: spatiotemporal evidence from China. J Financ Econ Dyn (JFED). 2026;1(1): 62-88.
- Ren S, Li L, Han Y, Hao Y, Wu H. The emerging driving force of inclusive green growth: does digital economy agglomeration work? Business Strategy and the Environment. 2022 May;31(4):1656-78.
- Yu S, Liu J, Zhou S. Synergy evaluation of China’s economy–energy low‑carbon transition and its improvement strategy for structure optimization. Environ Sci Pollut Res. 2022;29(43):65061-65076.
- Li Y, Hanif MW, Wen M, Khoso AK, Khoso WM. Geopolitical risks and the global renewable energy transition: Implications for energy security and economic resilience. Energy Reports. 2026 Jun 1;15:108-875.
- Kostis P, Dinçer H, Yüksel S. Knowledge-based energy investments of European economies and policy recommendations for sustainable development. Journal of the Knowledge Economy. 2023 Sep;14(3):2630-62.
- Yang B, Wang Y, Yang H, Chen F. How does regional economic integration affect carbon emission efficiency? Evidence from the Yangtze River Delta, China. Environmental Science and Pollution Research. 2024 Apr;31(16):23766-79.
- Winans K, Kendall A, Deng H. The history and current applications of the circular economy concept. Renewable and Sustainable Energy Reviews. 2017 Feb 1;68:825-33.
- Song M, Zheng C, Wang J. The role of digital economy in China's sustainable development in a post-pandemic environment. J Enterp Inf Manag. 2022;35(1):58-77.
- Hou J. Transforming energy for sustainability: The digital economy's role in reducing industrial hazards. Energy Exploration & Exploitation. 2025 Sep;43(5):1916-47.
- Sahoo SK, Goswami SS, Božanić D, Mitra S. Evaluating green economy strategies through multi-criteria decision analysis: a systematic review. Int J Econ Sci. 2025;14(1):385-407.
- Liu Q, Yang X, Shen Z, Štreimikienė D. Digital economy and substantial green innovation: empirical evidence from Chinese listed companies. Technology analysis & strategic management. 2024 Oct 2;36(10):2609-23.
- Guo C, Lin W, Jin S, Zhao D, Feng M. Regional coupling coordination and driving mechanisms of high-quality economic development and carbon emission intensity in Chinese provinces. Ecological Frontiers. 2025 Apr 1;45(2):463-71.
- Ranjbari M, Morales-Alonso G, Carrasco-Gallego R. Conceptualizing the sharing economy through presenting a comprehensive framework. Sustainability. 2018 Jul 5;10(7):23-36.
- Amrutha VN, Geetha SN. A systematic review on green human resource management: Implications for social sustainability. Journal of Cleaner Production. 2020 Feb 20;(247):119-131.
- Arif U, Rana SL, Azhar S, Ahmad MB, Shaukat F. Asymmetric impact of climate change vulnerability and adaptive capacity on economic growth in developing economies. Int J Econ Sci. 2025;14(1):211-226.
- Zeng J, Tong W, Tang T. How do energy policies affect industrial green development in China: renewable energy, energy conservation, or industrial upgrading?. Chinese Journal of Population, Resources and Environment. 2020 Jun 1;18(2):79-86.
- Taghizadeh-Hesary F, Dong K, Zhao C, Phoumin H. Can financial and economic means accelerate renewable energy growth in the climate change era? The case of China. Economic Analysis and Policy. 2023 Jun 1;(78):730-43.
- Kahrl F, Roland-Holst D. Growth and structural change in China's energy economy. Energy. 2009 Jul 1;34(7):894-903.
- Petrov S, Aleksandrova S, Kirova S. Environmental effects of green bonds and other forms of financing in the European Union. Int J Econ Sci. 2024;13(1):81-105.
- Özekenci EK. A Multi-Criteria Framework for Economic Decision Support in Urban Sustainability: Comparative Insights from European Cities. International Journal of Economic Sciences. 2025 Jun 20;14(1):162-81.
- Liu XY, Shao X, Li XF, Dong C. The impact of renewable energy technology innovation on the low-carbon economic transition. Global Journal of Environmental Science and Management. 2025 Jul 1;11(3):1241-58.
- Lim Siau Shiong J. Board independence, audit quality, and financial performance with the mediating role of technological innovation in China. J Financ Econ Dyn (JFED). 2026;1(1) 89-113;https://doi.org/10.66361/jfed.55.
- Kusnadi Y, Leong KS, Suwardy T, Wang J. Audit committees and financial reporting quality in Singapore. Journal of Business Ethics. 2016 Nov;139(1):197-214.
- Amin A, Yusoff NYBM, Peng S, Işık C, Ullah A, Akbar M. The influence of energy transition and natural resources on carbon emissions in China: an augmented ARDL application. Environ Dev Sustain. 2025;27(6):12605-12623.
- Khan U, Liu W. The link between green innovations, corporate performance, ESG activities, and the sharing economy. Environ Sci Pollut Res. 2023;30(32):78763-78775.
- Liu L, Wang H, Wang Z, Ding T, Wu M. The coupling coordination between the digital economy and green high-quality development of industries in China’s Yangtze River Economic Belt. Polish Journal of Environmental Studies. 2024 Apr 18;33(4):3799-812.
- Gielen D, Boshell F, Saygin D, Bazilian MD, Wagner N, Gorini R. The role of renewable energy in the global energy transformation. Energy Strategy Rev. 2019;24:38-50.
Access restricted. Please log in or start a trial to view this content.