This prospective observational study describes the development and internal validation of a predictive model using first-stage transabdominal and transperineal ultrasound parameters combined with maternal clinical characteristics to facilitate early identification of women at risk for prolonged second-stage labor.
Research Article
Development and Internal Validation of a Predictive Model for Prolonged Second-Stage Labor Using First-Stage Data: A Prospective Observational Study
43 views
⸱
September 11th, 2026
* These authors contributed equally
In This Article
Summary
Abstract
Prolongation of the second stage of labor is associated with adverse maternal and neonatal outcomes, making early risk identification clinically important. This study assessed whether combining transabdominal and transperineal ultrasound parameters obtained during the first stage of labor could predict a prolonged second stage. This prospective observational study enrolled primiparas who underwent transabdominal and transperineal ultrasound during the active first stage of labor. Fetal position, angle of progression (AOP), head–pubic symphysis distance, head–perineum distance, and maternal clinical characteristics were recorded. Participants were classified into normal (≤120 min) and prolonged (>120 minutes) second-stage groups. Least absolute shrinkage and selection operator (LASSO) regression was used to select key predictors, and multivariable logistic regression identified independent predictors for model development. Predictive performance was evaluated using receiver operating characteristic (ROC) curve analysis, calibration, and decision curve analysis (DCA) during internal validation. The analysis included 159 primiparas (95 normal and 64 prolonged). Compared with the normal group, the prolonged group had higher incidences of fetal distress (31.2% vs 15.8%, p = 0.035) and low Appearance, Pulse, Grimace, Activity, and Respiration (Apgar) scores (70.3% vs 36.8%, p < 0.001). LASSO regression identified four key predictors—maternal age, gestational body mass index increase, neonatal birth weight, and AOP—all of which remained independent predictors (p < 0.05). The predictive model achieved an area under the ROC curve of 0.927 and demonstrated good discrimination, calibration, and clinical utility in internal validation. First-stage ultrasound parameters combined with maternal clinical characteristics may facilitate the early identification of high-risk primiparas and support intrapartum management.
Introduction
Prolonged labor has long been a major concern in obstetric practice. In particular, prolongation of the second stage not only increases maternal pain but also contributes to adverse neonatal outcomes1. According to the latest guidelines issued by the World Health Organization (WHO), the normal duration of the second stage of labor is ≤120 min. In other words, a second stage lasting >120 min is considered prolonged. The global incidence of prolonged second stage is estimated to be 3%–8%1,2. Such prolongation increases the risks of maternal infection, cesarean section (C-section), postpartum hemorrhage, fetal distress, low Appearance, Pulse, Grimace, Activity, and Respiration (Apgar) scores, and perinatal mortality1. Previous studies have demonstrated that maternal age, gestational body mass index (BMI) increase, and neonatal birth weight are associated with a prolonged second stage of labor; however, their predictive value remains limited3. Therefore, identifying more effective predictors is of considerable importance for facilitating timely clinical interventions, optimizing labor progression, reducing the occurrence of prolonged labor, and improving maternal and neonatal outcomes.
In recent years, ultrasound imaging has become increasingly integrated into obstetric care, particularly in intrapartum management, because it enables real-time, objective assessment of fetal position, orientation, and descent3,4. Evidence suggests that intrapartum ultrasound plays an important role in predicting labor progression, evaluating fetal status, and guiding clinical decision-making regarding the mode of delivery5. Nevertheless, important gaps remain in the current literature. First, relatively few studies have specifically investigated the use of ultrasound parameters to predict a prolonged second stage of labor. Second, although fetal head position, fetal position, and their spatial relationship to the maternal pelvis during the first stage of labor may directly influence the duration of the second stage6, studies evaluating these first-stage ultrasound parameters in relation to second-stage prolongation remain limited.
Against this backdrop, the present prospective observational study collected delivery data from a single center during the first stage of labor. Ultrasound parameters were obtained using transabdominal and transperineal scanning, including head–symphysis distance (HSD), angle of progression (AOP), and head–perineum distance (HPD). Unlike previous ultrasound-based studies that primarily focused on predicting immediate delivery outcomes or the need for operative intervention during the second stage of labor, the present study specifically investigated the early prediction of prolonged second-stage labor using first-stage ultrasound parameters. These parameters were combined with maternal demographic and clinical characteristics to evaluate their predictive value for prolonged second-stage labor. This approach addresses an important knowledge gap because no previous study has integrated multidimensional first-stage ultrasound findings with maternal clinical characteristics into a predictive model for second-stage prolongation. Accordingly, a predictive model was developed and internally validated. This study is expected to provide clinicians with an objective tool for the early identification of primiparas at risk of prolonged second-stage labor during the first stage of labor, thereby supporting more individualized intrapartum management and improved maternal and neonatal outcomes.
Protocol
This study was conducted in accordance with the Declaration of Helsinki and approved by the Ethics Committee of Yuyao Maternal and Child Health Hospital (Yuyao Second People’s Hospital) (approval No. YMCH-EC-2023KT-0012). All participants provided written informed consent.
Study Participants
Primiparous women with spontaneous onset of labor who successfully achieved vaginal delivery were included. This enabled precise recording of the second-stage duration required for the predictive model. The eligibility criteria were as follows: (1) singleton pregnancy with a gestational age of ≥37 weeks; (2) cephalic presentation; and (3) informed consent obtained from both the participant and her family. The exclusion criteria included the following: (1) absolute contraindications to trial of labor identified during the active phase (e.g., placenta previa, vasa previa, cord prolapse); and/or (2) secondary uterine inertia (defined as failure of cervical dilation or fetal descent to progress for ≥4 h despite oxytocin augmentation or amniotomy). Women undergoing induction of labor were also excluded.
Notably, women who required emergency surgical intervention (C-section or instrumental delivery) due to acute fetal distress during the second stage were managed according to clinical guidelines but were not included in this analysis in order to preserve the completeness of the labor duration records.
The sample size was calculated based on the results of a preliminary trial (n = 30, in which the incidence of second-stage prolongation was 20%). With α set at 0.05 and β at 0.20, assuming an estimated incidence of second-stage prolongation of approximately 20%, a minimum of 150 participants was required to detect a significant predictor with an odds ratio (OR) ≥ 2.5. A total of 159 women were included in the final analysis.
Acquisition of Clinical Data
Maternal variables included age, gestational body mass index (BMI) increase (defined as the difference between pre-pregnancy BMI and pre-delivery BMI), gestational diabetes, gestational hypertension, mental state (assessed using the Self-Rating Anxiety Scale, with a score ≥50 indicating anxiety), uterine inertia (specifically referring to a clinically assessed hypotonic contraction pattern, defined as uterine contractions occurring at intervals >5 min or lasting <30 s, distinguished from the American College of Obstetricians and Gynecologists [ACOG] definition of labor arrest), and parity. Neonatal variables included birth weight (kg), fetal distress (defined as recurrent late or variable decelerations on cardiotocography or a baseline fetal heart rate of <110 beats/min or >160 beats/min), and Apgar score (with a 1-min score of <7 classified as low).
Gestational diabetes was diagnosed according to the International Association of Diabetes and Pregnancy Study Groups criteria (fasting glucose 5.1–6.9 mmol/L or 1 h ≥10.0 mmol/L or 2 h 8.5–11.0 mmol/L on the 75 g Oral Glucose Tolerance Test at 24–28 weeks). Gestational hypertension was defined according to ACOG guidelines (systolic blood pressure ≥140 mmHg or diastolic blood pressure ≥90 mmHg measured twice ≥4 h apart after 20 weeks of gestation, without proteinuria). Fetal distress on cardiotocography was defined as recurrent late decelerations (≥50% of contractions), recurrent variable decelerations lasting >60 s, prolonged deceleration lasting 2–10 min, or a baseline fetal heart rate of <110 or >160 beats/min for ≥10 min (National Institute for Health and Care Excellence [NICE] criteria). Uterine inertia (hypotonic contractions) was defined as contraction intervals >5 min or contraction duration of <30 s over 30 min, as assessed by palpation or tocodynamometry. Mental state (anxiety) was assessed using the Self-Rating Anxiety Scale at admission (cervical dilation < 4 cm), with a raw score of ≥50 (standardized index) classified as abnormal. A low Apgar score was defined as a 1-min score of <7 (WHO).
Because this was an observational study, labor management followed routine clinical practice without a standardized protocol. However, epidural analgesia (yes/no, timing, duration), oxytocin augmentation (yes/no, total dose, duration), artificial rupture of membranes (yes/no, cervical dilation at the procedure), and mode of delivery (spontaneous vaginal delivery only, according to the inclusion criteria) were systematically recorded. No significant interaction between these variables and the primary model predictors was observed.
Transabdominal and Transperineal Ultrasound Examination at the Early First Stage of Labor
Ultrasound scanning was conducted at the beginning of the active phase of labor (cervical dilation ≥4 cm). The parturient was placed in the supine position with a 15° left lateral tilt after bladder emptying. For transperineal scanning, the thighs were slightly abducted and flexed. All images were captured at the peak of a uterine contraction, which was identified by clinical palpation in conjunction with external tocodynamometry (cardiotocography) to confirm the peak of each contraction. Each measurement was repeated during three separate contractions, with the mean value used for analysis. Ultrasound examinations were performed using a portable diagnostic ultrasound system (see Table of Materials). For transabdominal imaging, a convex probe (2–5 MHz) was used; for transperineal imaging, a high-frequency linear or small-footprint convex probe (5–8 MHz) was used. Imaging settings were standardized (depth 6–10 cm, gain optimized, and a single focal zone positioned at the pubic symphysis).
For fetal position assessment, a transabdominal transverse scan identified the fetal orbit, cerebellum, and thalamic midline relative to the maternal pelvis to determine occiput anterior (OA), transverse, or posterior position. For transperineal measurements, the transducer was covered with a sterile sheath and placed on the perineum in the midsagittal plane without excessive pressure. Anatomical landmarks included the entire pubic symphysis, the fetal skull contour, and the anorectal junction.
The following parameters were measured (Figure 1A–D): angle of progression (AOP), defined as the angle between the long axis of the pubic symphysis and a line extending from its inferior edge to the deepest point of the fetal skull; midline angle (MLA), defined as the angle between the fetal skull midline (falx cerebri) and the maternal pelvic anteroposterior axis; head–symphysis distance (HSD), defined as the distance from the inferior edge of the pubic symphysis to the nearest point on the fetal skull; and head–perineum distance (HPD), defined as the shortest distance from the outer fetal skull to the perineal skin7.
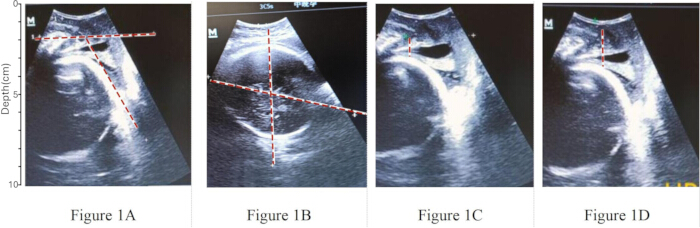
Figure 1. Ultrasound measurements obtained during the first stage of labor. (A) Measurement of the angle of progression (AOP), defined as the angle between the long axis of the pubic symphysis and a line extending from its inferior edge to the deepest point of the fetal skull. (B) Measurement of the midline angle (MLA), defined as the angle between the fetal skull midline (falx cerebri) and the maternal pelvic anteroposterior axis. (C) Measurement of the head–symphysis distance (HSD), defined as the distance from the inferior edge of the pubic symphysis to the nearest point on the fetal skull. (D) Measurement of the head–perineum distance (HPD), defined as the shortest distance from the outer surface of the fetal skull to the maternal perineal skin. Please click here to view a larger version of this figure.
Each measurement was performed three times during three separate contraction peaks, and the average value was used for analysis. All examinations were conducted by three experienced sonographers (each with ≥10 years of experience in obstetric ultrasound), who completed standardized training in intrapartum transperineal ultrasound measurements before the study. Competency was confirmed by achieving an intraclass correlation coefficient (ICC) of ≥0.90 against a gold-standard assessor (senior author). Inter-observer and intra-observer reproducibility were assessed during a pilot phase involving 10 patients (not included in the main study), yielding ICCs ranging from 0.89 to 0.96 for all parameters (AOP, HSD, HPD, and MLA).
Image acceptance required clear visualization of the pubic symphysis, fetal skull contour, and anorectal junction. Images with excessive transducer pressure or poorly visualized anatomical landmarks were discarded and reacquired. Sonographers were blinded to group assignment (normal versus prolonged second stage) and to clinical data during image acquisition and measurement. Data were double-entered with range checks, and out-of-range values triggered image re-review. Missing data (<5%) were handled using complete-case analysis after confirming that the data were missing at random (Little’s missing completely at random test, p > 0.05).
Recording and Grouping of Labor Duration
Throughout the labor process, the course of labor for each participant was carefully documented. The first stage of labor was defined as the period from the onset of regular uterine contractions to complete cervical dilation (10 cm). The active phase of labor was defined as cervical dilation ≥4 cm accompanied by intensified, regular uterine contractions. The second stage of labor was defined as the period from complete cervical dilation (10 cm) to complete fetal expulsion. Ultrasound examinations were performed during the active phase of the first stage of labor to assess fetal head position, fetal position, and related ultrasound parameters. According to the World Health Organization (WHO) guidelines, a normal second stage of labor should not exceed 120 min2. To maintain a standardized research threshold for all primiparas in this study, participants were categorized according to this 120-min criterion into two groups: a normal second-stage group (≤120 min) and a prolonged second-stage group (>120 min).
Statistical Analysis
All statistical analyses were performed using SPSS version 26.0 (RRID:SCR_002865) and R version 4.1.0 (RRID:SCR_001905) (see Table of Materials). The following R packages were used: glmnet (version 4.1-2) for least absolute shrinkage and selection operator (LASSO) regression, rms (version 6.2-0) for nomogram construction and calibration, pROC (version 1.18.0) for receiver operating characteristic (ROC) analysis, and rmda (version 1.6) for decision curve analysis (DCA). Normality of continuous variables was assessed using the Shapiro–Wilk test to guide the choice of descriptive statistics and comparison methods. Normally distributed data were presented as mean ± standard deviation (x̄ ± s) and compared using the independent-samples t-test, which is robust to mild deviations from normality when sample sizes are adequate. Non-normally distributed data were presented as the median with interquartile range (M [P25, P75]) and compared using the Mann–Whitney U test, which evaluates whether one distribution tends to have larger values than the other rather than strictly testing differences in medians. Categorical variables were presented as counts and percentages (n [%]) and compared using the chi-square (χ2) test or Fisher’s exact test when the expected frequency was <5. All tests were two-tailed, and a p-value <0.05 was considered statistically significant. Variables with p <0.1 in the univariate analysis were entered into the LASSO regression for variable selection. LASSO regression was performed using the glmnet package with 10-fold cross-validation to determine the optimal regularization parameter (λ). The one-standard-error criterion (the largest λ within one standard error of the minimum cross-validation error) was applied to select the most parsimonious set of predictors with non-zero coefficients. Before LASSO fitting, all continuous predictors (maternal age, gestational BMI increase, AOP, HSD, HPD, and neonatal birth weight) were centered and standardized to z-scores using the default glmnet setting (standardize = TRUE) so that coefficients were penalized equally regardless of measurement units. The selected variables were subsequently entered into a multivariable logistic regression model (enter method) to calculate adjusted odds ratios (aORs) and 95% confidence intervals (CIs). Model significance was assessed using the likelihood ratio test.
Based on the logistic regression coefficients, a predictive model was constructed as Logit(P) = β0 + Σ(βiXi). This model was visualized as a nomogram using the rms package, in which each predictor was assigned a point value proportional to its regression coefficient, and the total points were mapped to predicted probabilities. Discrimination was evaluated by plotting the ROC curve and calculating the area under the curve (AUC) with its 95% CI using the pROC package (bootstrap method with 1,000 resamples). The optimal cutoff probability was determined by maximizing the Youden index (sensitivity + specificity − 1), with the corresponding sensitivity and specificity reported. Calibration was assessed using a calibration curve generated from 1,000 bootstrap resamples (rms package), supplemented by the Hosmer–Lemeshow goodness-of-fit test (a non-significant p-value indicates good calibration). Clinical utility was evaluated using DCA with the rmda package, which calculates the net benefit across a range of threshold probabilities (0%–100%). Net benefit was defined as (true positives / n) − (false positives / n) × (threshold probability / [1 − threshold probability]). The overall study workflow is described above and illustrated in Supplementary Figure 1. This model is exploratory; the predictor neonatal birth weight refers to actual weight measured after delivery, and clinical prediction would require model refitting using estimated fetal weight (EFW) obtained before delivery.
Results
Study Population and Group Assignment
A total of 159 parturients were included in the final analysis. Of these, 95 had a normal second-stage duration, whereas 64 experienced a prolonged second stage (Table 1). Compared with the normal group, the prolonged group had significantly higher incidences of fetal distress and low Apgar scores (both p < 0.05). No significant difference in perinatal mortality was observed between the groups (p > 0.05).
| Variable | All (N = 159) | Normal second stage (N = 95) | Prolonged second stage (N = 64) | P value |
| Second-stage duration (min) | 109 [40.5; 172] | 88.4 [40.5; 125] | 139 [100; 172] | <0.0001 |
| Fetal distress | 0.0347 | |||
| Absent | 124 (78.0%) | 80 (84.2%) | 44 (68.8%) | |
| Present | 35 (22.0%) | 15 (15.8%) | 20 (31.2%) | |
| Low Apgar score | 0.0001 | |||
| No | 79 (49.7%) | 60 (63.2%) | 19 (29.7%) | |
| Yes | 80 (50.3%) | 35 (36.8%) | 45 (70.3%) | |
| Perinatal mortality | 0.5653 | |||
| Absent | 156 (98.1%) | 94 (98.9%) | 62 (96.9%) | |
| Present | 3 (1.89%) | 1 (1.05%) | 2 (3.12%) |
Table 1: Effect of prolonged second-stage labor on neonatal clinical outcomes. Continuous variables are presented as median [interquartile range (IQR)], and categorical variables are presented as number (%). The normal second-stage labor group comprised participants with a second-stage duration of ≤120 min, whereas the prolonged second-stage labor group comprised participants with a second-stage duration of >120 min. A low Appearance, Pulse, Grimace, Activity, and Respiration (Apgar) score was defined as a 1-min Apgar score <7. P values represent comparisons between the normal and prolonged second-stage labor groups.
A comparison of demographic and clinical characteristics between the two groups is presented in Table 2. Parturients with a prolonged second stage had a higher median maternal age and greater gestational BMI increase than those with a normal second stage. The frequencies of gestational diabetes, uterine inertia, and altered mental state were also significantly higher in the prolonged group (all p < 0.05). No significant between-group differences were observed in gestational hypertension or gestational age at delivery (both p > 0.05).
| Variable | All (N = 159) | Normal second stage (N = 95) | Prolonged second stage (N = 64) | P value |
| Age (years) | 28.8 [19.4; 44.9] | 26.3 [19.4; 33.2] | 32.4 [22.3; 44.9] | <0.0001 |
| Gestational BMI increase (kg/m²) | 11.4 ± 3.62 | 10.1 ± 3.33 | 13.3 ± 3.17 | <0.0001 |
| Gestational diabetes | 0.0002 | |||
| Absent | 141 (88.7%) | 92 (96.8%) | 49 (76.6%) | |
| Present | 18 (11.3%) | 3 (3.16%) | 15 (23.4%) | |
| Gestational hypertension | 0.8723 | |||
| Absent | 124 (78.0%) | 75 (78.9%) | 49 (76.6%) | |
| Present | 35 (22.0%) | 20 (21.1%) | 15 (23.4%) | |
| Neonatal birth weight (kg) | 2.61 [1.68; 4.60] | 2.46 [1.68; 2.85] | 3.39 [1.71; 4.60] | <0.0001 |
| Mental state | 0.0017 | |||
| Altered | 139 (87.4%) | 90 (94.7%) | 49 (76.6%) | |
| Healthy | 20 (12.6%) | 5 (5.26%) | 15 (23.4%) | |
| Uterine inertia | <0.0001 | |||
| Absent | 123 (77.4%) | 85 (89.5%) | 38 (59.4%) | |
| Present | 36 (22.6%) | 10 (10.5%) | 26 (40.6%) | |
| Gestational age (weeks) | 38.1 ± 2.02 | 38.1 ± 1.99 | 37.9 ± 2.06 | 0.5156 |
Table 2: Comparison of demographic and clinical characteristics between groups. Continuous variables are presented as either mean ± standard deviation (SD) or median [interquartile range (IQR)], as appropriate. Categorical variables are presented as number (%). Body mass index (BMI) increase was defined as the difference between pre-pregnancy BMI and BMI before delivery. The normal second-stage labor group comprised participants with a second-stage duration of ≤120 min, whereas the prolonged second-stage labor group comprised participants with a second-stage duration of >120 min. P values represent comparisons between the two groups.
Clinical and Ultrasound Parameters at the Active First Stage
First-stage transabdominal and transperineal ultrasound parameters were compared between the normal and prolonged second-stage groups (Table 3). The proportion of OA fetal position was significantly lower in the prolonged group than in the normal group. In addition, AOP, HSD, and HPD were significantly greater among parturients who experienced a prolonged second stage (all p < 0.05).
| Variable | All (N = 159) | Normal second stage (N = 95) | Prolonged second stage (N = 64) | P value |
| Fetal position | <0.0001 | |||
| OA | 74 (46.5%) | 60 (63.2%) | 14 (21.9%) | |
| Non-OA | 85 (53.5%) | 35 (36.8%) | 50 (78.1%) | |
| AOP (°) | 124 [64.3; 158] | 111 [64.3; 142] | 138 [123; 158] | <0.0001 |
| HSD (cm) | 1.97 ± 0.39 | 1.81 ± 0.33 | 2.21 ± 0.34 | <0.0001 |
| HPD (cm) | 4.61 ± 0.71 | 4.23 ± 0.56 | 5.17 ± 0.51 | <0.0001 |
Table 3: Comparison of transabdominal and transperineal ultrasound parameters during the first stage of labor. Continuous variables are presented as either mean ± standard deviation (SD) or median [interquartile range (IQR)], as appropriate. Categorical variables are presented as number (%). OA, occiput anterior; non-OA, non-occiput anterior; AOP, angle of progression; HSD, head–symphysis distance; HPD, head–perineum distance. AOP was measured in degrees (°), whereas HSD and HPD were measured in centimeters (cm). The normal second-stage labor group comprised participants with a second-stage duration of ≤120 min, whereas the prolonged second-stage labor group comprised participants with a second-stage duration of >120 min. P values represent comparisons between the two groups.
Univariate Analysis of Potential Predictors
Univariate analyses were performed to identify variables associated with prolonged second-stage labor (Table 4). Ten variables differed significantly between the normal and prolonged groups (p < 0.10): maternal age, gestational BMI increase, gestational diabetes, neonatal birth weight, mental state, uterine inertia, fetal position, AOP, HSD, and HPD. No significant between-group differences were observed for gestational hypertension or gestational age (both p > 0.10). Variables with p < 0.10 were subsequently entered into the LASSO regression model for variable selection.
| Variable | All (N = 159) | Normal second stage (N = 95) | Prolonged second stage (N = 64) | Statistic | P value |
| Demographic and clinical characteristics | |||||
| Age (years) | 28.8 [19.4; 44.9] | 26.3 [19.4; 33.2] | 32.4 [22.3; 44.9] | Z = −5.891 | <0.001 |
| Gestational BMI increase (kg/m²) | 11.4 ± 3.62 | 10.1 ± 3.33 | 13.3 ± 3.17 | t = −5.912 | <0.001 |
| Gestational diabetes, n (%) | 18 (11.3) | 3 (3.2) | 15 (23.4) | χ² = 15.207 | <0.001 |
| Gestational hypertension, n (%) | 35 (22.0) | 20 (21.1) | 15 (23.4) | χ² = 0.135 | 0.872 |
| Neonatal birth weight (kg) | 2.61 [1.68; 4.60] | 2.46 [1.68; 2.85] | 3.39 [1.71; 4.60] | Z = −6.234 | <0.001 |
| Altered mental state, n (%) | 139 (87.4) | 90 (94.7) | 49 (76.6) | χ² = 10.912 | 0.001 |
| Uterine inertia, n (%) | 36 (22.6) | 10 (10.5) | 26 (40.6) | χ² = 20.156 | <0.001 |
| Gestational age (weeks) | 38.1 ± 2.02 | 38.1 ± 1.99 | 37.9 ± 2.06 | t = 0.654 | 0.516 |
| Ultrasound parameters during the first stage of labor | |||||
| Fetal position (non-OA), n (%) | 85 (53.5) | 35 (36.8) | 50 (78.1) | χ² = 26.543 | <0.001 |
| AOP (°) | 124 [64.3; 158] | 111 [64.3; 142] | 138 [123; 158] | Z = −6.781 | <0.001 |
| HSD (cm) | 1.97 ± 0.39 | 1.81 ± 0.33 | 2.21 ± 0.34 | t = −7.445 | <0.001 |
| HPD (cm) | 4.61 ± 0.71 | 4.23 ± 0.56 | 5.17 ± 0.51 | t = −9.332 | <0.001 |
Table 4: Univariate analysis of factors associated with prolonged second-stage labor. Continuous variables are presented as either mean ± standard deviation (SD) or median [interquartile range (IQR)], as appropriate. Categorical variables are presented as number (%). BMI, body mass index; OA, occiput anterior; non-OA, non-occiput anterior; AOP, angle of progression; HSD, head–symphysis distance; HPD, head–perineum distance. Normally distributed continuous variables were compared using the independent-samples t-test, non-normally distributed continuous variables were compared using the Mann–Whitney U test (reported as the Z statistic), and categorical variables were compared using the chi-square (χ2) test. Variables with P <0.10 were considered eligible for inclusion in the least absolute shrinkage and selection operator (LASSO) regression analysis.
Variable Selection by Least Absolute Shrinkage and Selection Operator Regression
To construct a parsimonious predictive model while reducing the risk of overfitting and the influence of multicollinearity, the 10 candidate predictors identified by the univariate analysis (p < 0.10; Table 4) were entered into the LASSO regression model for variable selection. The optimal regularization parameter (λ) was determined using 10-fold cross-validation. The coefficient path plot (Figure 2A) illustrates the progressive shrinkage of regression coefficients toward zero as λ increases. The corresponding cross-validation curve (Figure 2B) shows the relationship between the cross-validation error and different λ values. The left vertical dashed line indicates the λ value that minimized the cross-validation error, whereas the right vertical dashed line indicates the largest λ within one standard error of the minimum (one-standard-error criterion). The latter was selected to obtain a more parsimonious model. Using the one-standard-error criterion, four predictors with non-zero coefficients were retained: neonatal birth weight (coefficient = 0.50), gestational BMI increase (coefficient = 0.12), maternal age (coefficient = 0.05), and AOP (coefficient = 0.03). These coefficients represent the standardized penalized coefficients from the final LASSO model at the selected λ value. The remaining candidate variables—HSD, HPD, gestational diabetes, mental state, uterine inertia, and fetal position—had coefficients that were shrunk to zero and were therefore excluded from the final predictor set. The retained variables were subsequently entered into the multivariable logistic regression model to estimate adjusted ORs with corresponding 95% CIs.
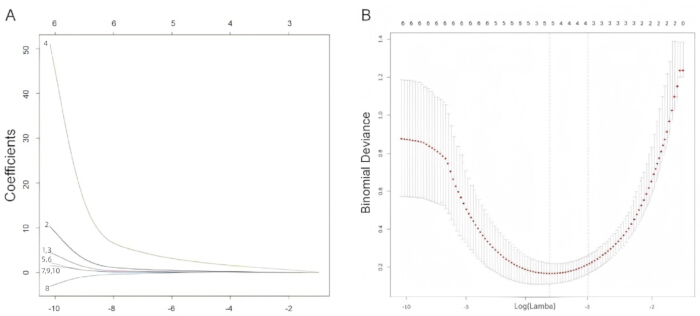
Figure 2. Least absolute shrinkage and selection operator (LASSO) regression analysis for predictor selection. (A) Coefficient paths generated during least absolute shrinkage and selection operator (LASSO) regression. The x-axis represents the logarithm of the regularization parameter (log λ), and the y-axis represents the standardized regression coefficients. Each curve illustrates the progressive shrinkage of an individual predictor coefficient toward zero as the regularization penalty increases. Numbers shown at the top indicate the number of variables retained at each value of λ. The numbered coefficient paths correspond to the following candidate predictors: (1) maternal age, (2) gestational body mass index (BMI) increase, (3) gestational diabetes, (4) neonatal birth weight, (5) mental state, (6) uterine inertia, (7) fetal position, (8) angle of progression (AOP), (9) head–symphysis distance (HSD), and (10) head–perineum distance (HPD). (B) Ten-fold cross-validation plot used to determine the optimal regularization parameter. The x-axis represents log(λ), and the y-axis represents the binomial deviance. Points indicate the mean cross-validation error, and error bars represent ±1 standard error. The left vertical dashed line indicates the value of λ that minimizes the cross-validation error, whereas the right vertical dashed line indicates the largest λ within one standard error of the minimum (one-standard-error criterion). Please click here to view a larger version of this figure.
Multivariable Logistic Regression and Independent Predictors
The four predictors retained by the LASSO regression model—maternal age, gestational BMI increase, neonatal birth weight, and AOP—were entered into a multivariable logistic regression model (Table 5). All four variables remained independently associated with prolonged second-stage labor after mutual adjustment (all p < 0.05). In the refitted multivariable logistic regression model, neonatal birth weight had the largest adjusted OR (aOR = 8.45, 95% CI: 3.21–22.24). Gestational BMI increase was also independently associated with prolonged second-stage labor (aOR = 1.38, 95% CI: 1.15–1.66). Maternal age (aOR = 1.18, 95% CI: 1.05–1.32) and AOP (aOR = 1.07, 95% CI: 1.02–1.12) were likewise independently associated with prolonged second-stage labor. The multivariable logistic regression model was statistically significant according to the likelihood ratio test (p < 0.001). Because neonatal birth weight was measured after delivery, the current model is exploratory and would require refitting using estimated fetal weight before clinical application.
| Variable | β | SE | Wald χ² | P value | aOR | 95% CI |
| Intercept | −15.92 | 3.01 | 27.98 | <0.001 | — | — |
| Maternal age (years) | 0.16 | 0.06 | 7.11 | 0.008 | 1.18 | 1.05–1.32 |
| Gestational BMI increase (kg/m²) | 0.32 | 0.09 | 12.65 | <0.001 | 1.38 | 1.15–1.66 |
| Neonatal birth weight (kg) | 4.26 | 0.9 | 22.41 | <0.001 | 8.45 | 3.21–22.24 |
| AOP (°) | 0.07 | 0.02 | 10.76 | 0.001 | 1.07 | 1.02–1.12 |
Table 5: Multivariable logistic regression analysis identifying independent predictors of prolonged second-stage labor. The table presents the results of the multivariable logistic regression model constructed using variables selected by least absolute shrinkage and selection operator (LASSO) regression. β, regression coefficient; SE, standard error; Wald χ2, Wald chi-square statistic; aOR, adjusted odds ratio; CI, confidence interval; BMI, body mass index; AOP, angle of progression. The intercept represents the model constant. Overall model significance was assessed using the likelihood ratio test (χ2 = 85.34, P <0.001).
Predictive Model Construction and Nomogram
Based on the independent predictors and their regression coefficients identified by the multivariable logistic regression analysis (Table 5), a patient-specific predictive model was constructed to estimate the probability of prolonged second-stage labor in primiparas. The model is expressed as follows:
Logit(P) = —15.92 + 0.16 ( maternal age ) +. 0.32 ( gestational BMI increase ) + 4.26 ( neonatal birth weight ) + 0.07( AOP )
Here, P represents the predicted probability of prolonged second-stage labor.
To facilitate visualization of the model, the regression equation was presented as a nomogram (Figure 3). Each predictor corresponds to an individual point scale. For example, a parturient with a maternal age of 28 years, a gestational BMI increase of 12 kg/m2, a neonatal birth weight (actual birth weight measured after delivery) of 3.6 kg, and an AOP of 115° can be scored by locating each value on its corresponding axis, projecting vertically to the Points axis, summing the individual point values to obtain the Total Points, and projecting the total score downward to the Risk of Prolonged Second Stage axis to estimate the predicted probability. This nomogram is presented for illustrative purposes only because it incorporates actual neonatal birth weight. Clinical application would require refitting the model using estimated fetal weight.
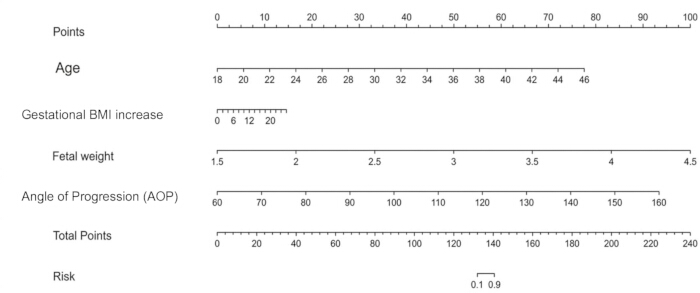
Figure 3. Nomogram for predicting the probability of prolonged second-stage labor. The nomogram was constructed from the multivariable logistic regression model using four predictors: maternal age, gestational BMI increase, neonatal birth weight (actual birth weight measured after delivery), and AOP. To estimate the predicted probability of prolonged second-stage labor, locate each predictor value on its corresponding axis and project vertically to the Points axis to determine the assigned score. Sum the individual scores to obtain the Total Points, and then project the total score to the Risk axis to estimate the predicted probability of prolonged second-stage labor. The nomogram is presented for illustrative purposes only because it incorporates actual neonatal birth weight, which is unavailable before delivery. Clinical application would require refitting the model using EFW. Please click here to view a larger version of this figure.
Model Validation: Discrimination, Calibration, and Clinical Utility
The predictive performance of the model was internally evaluated with respect to discrimination, calibration, and clinical utility. Model discrimination was assessed using the ROC curve (Figure 4). The model achieved an AUC of 0.927 (95% CI: 0.879–0.961), indicating excellent discrimination. Using the maximum Youden index, the optimal probability cutoff was 0.48. At this threshold, the model demonstrated a sensitivity of 85.9% and a specificity of 84.2% (Table 6).
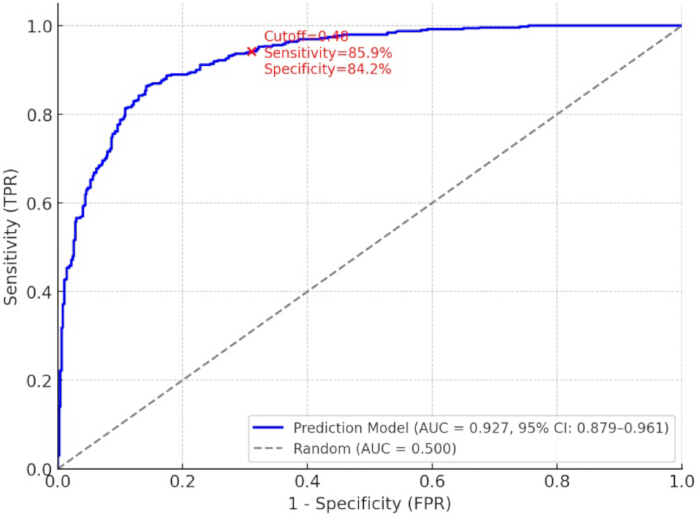
Figure 4. Receiver operating characteristic (ROC) curve evaluating the performance of the predictive model. The receiver operating characteristic (ROC) curve demonstrates the ability of the predictive model to discriminate between normal and prolonged second-stage labor. The blue curve represents the predictive model, with an area under the curve (AUC) of 0.927 (95% confidence interval [CI]: 0.879–0.961). The optimal probability cutoff was 0.48, corresponding to a sensitivity of 85.9% and a specificity of 84.2%. The gray dashed diagonal line represents random classification (AUC = 0.500). The x-axis represents 1 − specificity (false-positive rate [FPR]), and the y-axis represents sensitivity (true-positive rate [TPR]). Please click here to view a larger version of this figure.
| Parameter | Value | 95% CI |
| AUC | 0.927 | 0.879–0.961 |
| Optimal cutoff | 0.480 | — |
| Sensitivity | 85.90% | 75.0%–93.4% |
| Specificity | 84.20% | 75.3%–90.9% |
| PPV | 78.60% | 67.5%–87.3% |
| NPV | 89.80% | 81.9%–95.0% |
| Accuracy | 84.90% | 78.3%–90.1% |
Table 6: Performance of the predictive model at the optimal probability cutoff. The predictive performance of the multivariable logistic regression model was evaluated using the area under the receiver operating characteristic (ROC) curve (AUC). The optimal probability cutoff of 0.48 was determined by maximizing the Youden index. Sensitivity represents the proportion of true-positive cases correctly identified, specificity represents the proportion of true-negative cases correctly identified, positive predictive value (PPV) represents the probability that participants classified as positive truly had prolonged second-stage labor, and negative predictive value (NPV) represents the probability that participants classified as negative truly did not have prolonged second-stage labor. CI, confidence interval.
Model calibration was evaluated using a bootstrap calibration curve generated from 1,000 resamples together with the Hosmer–Lemeshow goodness-of-fit test (Figure 5A). The calibration curve closely followed the ideal reference line, indicating good agreement between predicted and observed probabilities. The Hosmer–Lemeshow goodness-of-fit test was not statistically significant (χ2 = 6.15, p = 0.630), which was consistent with adequate calibration in this internally validated model. Clinical utility was evaluated using DCA (Figure 5B). Within the threshold probability range of approximately 10%–70%, the predictive model provided greater net benefit than either the treat-all or treat-none strategy. At threshold probabilities below approximately 10%, the treat-none strategy provided greater net benefit, whereas at threshold probabilities above approximately 70%, the treat-all strategy performed similarly or better. These findings indicate that the model may provide clinical benefit within an intermediate range of threshold probabilities. Overall, the predictive model demonstrated excellent discrimination, adequate calibration, and favorable clinical utility during internal validation. However, because validation was limited to the study dataset and the model incorporated actual neonatal birth weight, external validation and refitting using estimated fetal weight are required before clinical implementation.
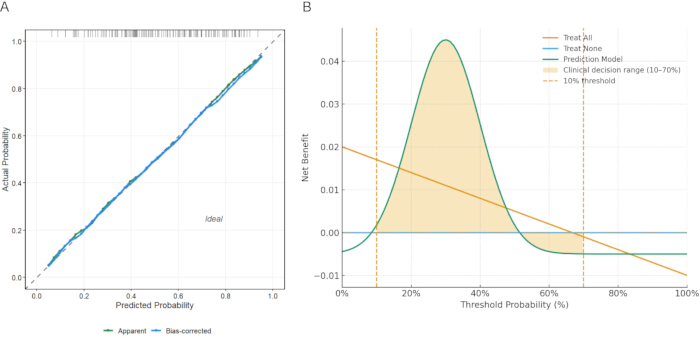
Figure 5. Calibration and decision curve analyses of the predictive model. (A) Calibration curve of the predictive model generated using 1,000 bootstrap resamples. The apparent curve represents the model performance in the study dataset, the bias-corrected curve represents the bootstrap-adjusted calibration, and the diagonal dashed line indicates ideal agreement between predicted and observed probabilities. The Hosmer–Lemeshow goodness-of-fit test yielded χ2 = 6.15 and p = 0.630. (B) Decision curve analysis (DCA) evaluating the clinical utility of the predictive model across a range of threshold probabilities. The green curve represents the predictive model, the orange line represents the treat-all strategy, and the blue line represents the treat-none strategy. The shaded region indicates the threshold probability range of 10%–70% evaluated in this study, with vertical dashed lines marking the lower (10%) and upper (70%) thresholds. The x-axis represents the threshold probability, and the y-axis represents the net benefit. Please click here to view a larger version of this figure.
Data Availability:
The de-identified participant-level dataset supporting the findings of this study is provided in Supplementary Table 1. This dataset contains the raw data used for all statistical analyses, model development, internal validation, and preparation of the reported tables and figures.
Supplementary Figure 1. Overall study workflow for development and internal validation of the predictive model. The workflow illustrates participant recruitment and eligibility assessment, acquisition of maternal clinical characteristics and intrapartum ultrasound measurements during the active first stage of labor, classification into normal and prolonged second-stage labor groups according to the World Health Organization (WHO) 120-minute criterion, predictor selection using least absolute shrinkage and selection operator (LASSO) regression, construction of the multivariable logistic regression model and nomogram, and internal model evaluation using receiver operating characteristic (ROC) analysis, calibration analysis, and decision curve analysis (DCA). Please click here to download this file.
Supplementary Table 1. Participant-level dataset used for model development and internal validation. This table contains the de-identified participant-level data used for all statistical analyses, including the development and internal validation of the predictive model. Variables include second-stage labor outcome, second-stage duration, neonatal outcomes, maternal demographic and clinical characteristics, and transabdominal and transperineal ultrasound measurements obtained during the first stage of labor. Body mass index (BMI) = body mass index; occiput anterior (OA) = fetal occiput anterior position; angle of progression (AOP) = angle of progression; head–symphysis distance (HSD) = head–symphysis distance; and head–perineum distance (HPD) = head–perineum distance. Please click here to download this file.
Discussion
With continuous improvements in obstetric management, prolonged second-stage labor has become an increasingly important factor affecting maternal and neonatal outcomes. Previous studies have shown that prolonged second-stage labor is associated with increased labor complexity, higher rates of cesarean delivery, and lower neonatal Apgar scores1,2. These findings highlight the clinical importance of optimizing perinatal management and implementing strategies for the early identification of women at increased risk of prolonged second-stage labor. Using demographic characteristics, clinical features, and ultrasound parameters, this study developed and internally validated a predictive model for prolonged second-stage labor and evaluated its potential clinical utility. The results demonstrated that maternal age, gestational BMI increase, neonatal birth weight, and AOP were independently associated with prolonged second-stage labor in the final multivariable model, whereas gestational diabetes, uterine inertia, and altered mental state were associated with prolonged second-stage labor in the univariate analysis but were not retained in the final predictive model. By integrating demographic, clinical, and ultrasound data into a multidimensional predictive model, this study provides an objective framework for identifying women at increased risk of prolonged second-stage labor during the first stage of labor. Such early risk stratification may facilitate individualized intrapartum management, including closer monitoring of labor progress and timely clinical decision-making, with the goal of improving maternal and neonatal outcomes.
Our findings indicated that prolonged second-stage labor was strongly associated with unfavorable fetal outcomes. Consistent with previous reports, prolonged second-stage labor significantly increased the risks of low Apgar scores and fetal distress3,8. Mechanistically, this association may be attributable to fetal hypoxia and increased intrauterine stress during prolonged labor. When the fetal head remains compressed within the maternal pelvis for an extended period, placental perfusion may become inadequate, resulting in oxygen deprivation and abnormal fetal heart rate patterns that may compromise immediate neonatal condition9. From a demographic perspective, this study showed that advanced maternal age, greater gestational BMI increase, and gestational diabetes were associated with prolonged second-stage labor. In particular, older mothers were at a higher risk of prolonged labor, consistent with previous research10. Physiologically, advancing maternal age may impair cervical ripening and uterine contractility, thereby delaying labor progression. Greater gestational BMI increase and gestational diabetes may further influence labor progression by increasing fetal size and altering uterine contraction patterns. In addition, uterine inertia and altered mental state were significantly associated with prolonged second-stage labor in the univariate analysis. These findings underscore the importance of carefully monitoring uterine contractility and maternal psychological well-being during labor because both factors may indirectly contribute to prolonged labor by influencing the rhythm and strength of uterine contractions. Ultrasound parameters also play an important role in predicting prolonged second-stage labor11,12,13,14. In the present study, the multivariable logistic regression analysis identified AOP as an independent predictor of prolonged second-stage labor (p < 0.05). HSD and HPD were significantly associated with prolonged second-stage labor in the univariate analysis but were not retained in the final predictive model after LASSO variable selection. An increased HSD indicates that the fetal head remains at a higher station within the pelvic inlet, suggesting impaired descent and an increased likelihood of prolonged second-stage labor15,16,17. The AOP reflects both fetal head descent and rotation and therefore has a direct relationship with labor progression6,18. Although fetal position determined by transabdominal ultrasound was not retained in the final predictive model, transabdominal ultrasound remains clinically useful for identifying fetal malpositions (e.g., occiput posterior or transverse positions) that may warrant closer intrapartum assessment. Collectively, these findings suggest that intrapartum ultrasound provides objective information on fetal position and head descent that may assist in the early assessment of women at increased risk of prolonged second-stage labor. By integrating demographic characteristics with ultrasound parameters, this study developed an internally validated predictive model. LASSO regression identified four variables with non-zero coefficients—maternal age, gestational BMI increase, neonatal birth weight, and AOP—which were subsequently entered into the multivariable logistic regression model for estimation of adjusted effect sizes. Using the one-standard-error criterion for model selection, the model achieved an AUC of 0.927 during internal validation, indicating excellent discriminatory performance. However, because the model incorporated actual neonatal birth weight measured after delivery, it should be considered exploratory and illustrative rather than directly applicable in clinical practice. Future clinical implementation would require model refitting using estimated fetal weight together with independent external validation. Within these limitations, integrating demographic characteristics and ultrasound parameters may facilitate earlier risk stratification and support individualized intrapartum management19,20,21,22.
Compared with previous investigations, the present study has several important strengths. First, integrating demographic characteristics, clinical variables, and ultrasound parameters enabled a multidimensional assessment of factors associated with prolonged second-stage labor. Second, LASSO regression was used for variable selection and coefficient shrinkage, which can help manage multicollinearity and improve model stability when correlated predictors are present. Third, the sample size provided sufficient statistical power for model development and internal validation. Despite these strengths, several limitations should be acknowledged. First, this was a single-center prospective study, and only women who ultimately achieved vaginal delivery were included. Consequently, women who underwent operative vaginal delivery or cesarean delivery during the second stage were excluded, introducing selection bias and limiting the generalizability of the findings. Furthermore, the outcome definition did not account for operative delivery as a competing outcome in women with prolonged labor. Therefore, external validation in independent multicenter prospective cohorts is required before clinical application. Second, all model performance assessments, including ROC analysis, calibration, and DCA, were based on internal validation using the same study population, and no independent external validation cohort was available. Third, although epidural analgesia, oxytocin augmentation, and artificial rupture of membranes were recorded, these variables were not incorporated into the final predictive model. Other potentially important factors, including uterine contraction characteristics, labor management strategies, and maternal pain scores, may also influence labor progression and should be evaluated in future studies. Fourth, some ultrasound measurements remain operator dependent despite standardized training and high interobserver reproducibility, and only a single assessment obtained during the active first stage of labor was analyzed. Because labor is a dynamic process, averaging three measurements obtained during separate contractions may reduce random measurement error but may also obscure rapid changes in fetal descent. Future studies incorporating serial time-stamped ultrasound assessments, such as changes in AOP over time, may improve predictive performance23,24. Finally, the predictive model was developed using actual neonatal birth weight measured after delivery to establish the physiological association with prolonged second-stage labor. Accordingly, the model should be regarded as exploratory and is not directly applicable for intrapartum clinical prediction. Clinical implementation would require redevelopment and external validation of the model using estimated fetal weight obtained before delivery rather than simple substitution into the current equation. Because estimated fetal weight is subject to inherent measurement error (typically ±10%–15%), the model coefficients and performance should be re-estimated in an independent cohort before clinical use. In addition, uterine inertia in this study was defined according to observed contraction frequency and duration rather than the diagnostic criteria for labor arrest recommended by ACOG or NICE, which may limit direct comparison with other studies. Finally, the use of a fixed 120-min threshold to define prolonged second-stage labor, without accounting for the longer durations that may be acceptable in women receiving epidural analgesia, may further limit the generalizability of the model.
Future research should explore alternative approaches to investigating the hypothesis examined in this study. First, whereas this study used a single ultrasound assessment at the onset of the active phase of labor, serial measurements (e.g., changes in AOP or head progression distance over time) may better capture the dynamic process of fetal descent and could improve predictive performance, as suggested by recent studies23,24. Second, although the combination of LASSO regression and multivariable logistic regression produced a parsimonious and interpretable model, other machine learning approaches, including random forests, support vector machines, and gradient boosting, may better capture nonlinear relationships and complex interactions among predictors, although potentially at the expense of interpretability. Third, because definitions of prolonged second-stage labor vary among clinical guidelines, including longer thresholds for women receiving epidural analgesia, recalibration of the model for alternative outcome definitions should be investigated. Fourth, future models should be developed using estimated fetal weight rather than actual neonatal birth weight, and alternative sonographic methods for estimating fetal weight, including three-dimensional ultrasound techniques, may help reduce measurement error. Finally, incorporation of continuous intrapartum monitoring data, such as uterine contraction strength or automated cardiotocography analysis, may further improve risk stratification. Comparative evaluation of these approaches may help identify the optimal strategy for predicting prolonged second-stage labor.
An additional limitation of this study is that only women who successfully achieved vaginal delivery were included to ensure accurate measurement of second-stage duration. Consequently, women who underwent operative vaginal delivery or cesarean delivery after prolonged second-stage labor were excluded, although they would have met the study definition of prolonged labor. This selection criterion may have underestimated the true incidence of prolonged second-stage labor and introduced outcome ascertainment bias. Furthermore, operative delivery before completion of the second stage represents a competing outcome rather than a simple non-event and was therefore not incorporated into the predictive model. Accordingly, the present model estimates the probability of prolonged second-stage labor only among women who ultimately achieve vaginal delivery and should not be used to predict the need for operative delivery. External validation in broader, unselected obstetric populations that include operative deliveries will be necessary to determine the generalizability and clinical applicability of the model. The observed association between prolonged second-stage labor and adverse outcomes, including fetal distress and low Apgar scores, even within a cohort limited to women who achieved vaginal delivery, underscores the importance of early risk assessment. The high vaginal delivery rate in this cohort reflects the study inclusion criteria and should not be interpreted as indicating that operative intervention was unnecessary in routine clinical practice.
The predictive model has several potential applications. Following redevelopment using estimated fetal weight and independent external validation, it could be integrated into electronic health record systems to estimate an individual's risk of prolonged second-stage labor during the active first stage, facilitating real-time identification of women at increased risk. Using the optimal probability cutoff identified in this study (0.48), the model may help support individualized intrapartum management, including closer maternal and fetal surveillance and timely clinical decision-making. In addition, the model could facilitate risk stratification in future interventional studies evaluating labor management strategies, epidural protocols, or uterine stimulation by enabling more balanced allocation of baseline risk. Because the required input variables are routinely collected during clinical care, the model may also provide a practical framework for future external validation and adaptation to other obstetric populations, including multiparous women and women undergoing induction of labor. In summary, integrating first-stage transabdominal and transperineal ultrasound parameters with maternal demographic and clinical characteristics enabled the development of an internally validated predictive model for prolonged second-stage labor. The multidimensional assessment demonstrated that maternal age, gestational BMI increase, neonatal birth weight, and AOP were independently associated with prolonged second-stage labor and showed that the model achieved excellent discrimination with good calibration during internal validation. Although these findings support the potential value of this approach for early intrapartum risk assessment, the model should be considered exploratory because it incorporates actual neonatal birth weight and has undergone internal validation only. Before clinical implementation, the model should be redeveloped using estimated fetal weight and externally validated in independent, multicenter cohorts. Future studies should also investigate the incorporation of additional predictors, including uterine contraction characteristics, pain management variables, and intrapartum interventions, to develop a more comprehensive and generalizable predictive model for individualized labor management.
Disclosures
Conflict of Interest:
The authors declare no competing financial or non-financial interests related to this work.
Acknowledgements
The authors thank the nursing and medical staff of the Department of Obstetrics at Yuyao Maternal and Child Health Hospital (Yuyao Second People’s Hospital) for their assistance with participant recruitment and data collection. This work was supported by the 2024 Yuyao Municipal Health Science and Technology Program (Grant No. 2024YYB03).
Materials
| Name | Company | Catalog Number | Comments |
|---|---|---|---|
| Portable diagnostic ultrasound system | Mindray | CAU-01040644 | Portable diagnostic ultrasound system used for transabdominal and transperineal imaging; see Protocol for imaging settings |
| Convex ultrasound probe (2–5 MHz) | Mindray | C5-2 | Used for transabdominal ultrasound imaging |
| High-frequency linear or small-footprint convex ultrasound probe (5–8 MHz) | Mindray | 75L38EA | Used for transperineal ultrasound imaging |
| R software | R Foundation for Statistical Computing | Version 4.1.0 | Statistical computing software (RRID:SCR_001905) |
| SPSS software | IBM Corp. | Version 26.0 | Statistical analysis software (RRID:SCR_002865) |
| Self-Rating Anxiety Scale | Published questionnaire (Zung Self-Rating Anxiety Scale) | Not applicable | Anxiety assessment questionnaire used at admission |
References
- American College of Obstetricians and Gynecologists, Society for Maternal-Fetal Medicine. Obstetric Care Consensus No. 1: Safe prevention of the primary cesarean delivery. Obstet Gynecol. 2014;123(3):693-711. doi:10.1097/01.AOG.0000444441.04111.1d.
- World Health Organization. WHO Guidelines Approved by the Guidelines Review Committee. World Health Organization; Geneva; 2015.
- Miyamoto K, et al. Prolonged second stage of labor in delivery using epidural analgesia is a risk factor for postpartum urinary retention. J Obstet Gynaecol Res. 2024;50(3):424-429. doi:10.1111/jog.15867.
- Kahrs BH. Ultrasound before operative vaginal delivery: Why and how. Minerva Obstet Gynecol. 2021;73(1):67-73. doi:10.23736/S2724-606X.20.04667-5.
- Yano E, et al. Anatomical identification of ischial spines applicable to intrapartum transperineal ultrasound based on magnetic resonance imaging of pregnant women. J Matern Fetal Neonatal Med. 2022;35(25):9736-9741. doi:10.1080/14767058.2022.2051007.
- Kahrs BH, Eggebø TM. Intrapartum ultrasound in women with prolonged first stage of labor. Am J Obstet Gynecol MFM. 2021;3(6):100427. doi:10.1016/j.ajogmf.2021.100427.
- Lee NMW, et al. Implementation of sonopartogram: Multicenter feasibility study. Ultrasound Obstet Gynecol. 2024;64(2):214-221. doi:10.1002/uog.27634.
- Saucedo AM, et al. First and second stage risk factors associated with perineal lacerations. Matern Child Health J. 2024;28(7):1228-1233. doi:10.1007/s10995-024-03919-1.
- Zhang M, et al. Risk factors for episiotomy during vaginal childbirth: A retrospective cohort study in Western China. J Evid Based Med. 2018;11(4):233-241. doi:10.1111/jebm.12316.
- Friedman EA, Cohen WR. The active phase of labor. Am J Obstet Gynecol. 2023;228(5 Suppl):S1037-S1049. doi:10.1016/j.ajog.2021.12.269.
- Kalache KD, et al. Transperineal ultrasound imaging in prolonged second stage of labor with occipitoanterior presenting fetuses: How well does the angle of progression predict the mode of delivery? Ultrasound Obstet Gynecol. 2009;33(3):326-330. doi:10.1002/uog.6294.
- Chan YT, et al. Relationship between intrapartum transperineal ultrasound measurement of angle of progression and head-perineum distance with correlation to conventional clinical parameters of labor progress and time to delivery. J Matern Fetal Neonatal Med. 2015;28(12):1476-1481. doi:10.3109/14767058.2014.958459.
- Chor CM, et al. Prediction of labor outcome using serial transperineal ultrasound in the first stage of labor. J Matern Fetal Neonatal Med. 2019;32(1):31-37. doi:10.1080/14767058.2017.1369946.
- Maged AM, et al. Measurement of the fetal occiput-spine angle during the first stage of labor as predictor of the progress and outcome of labor. J Matern Fetal Neonatal Med. 2019;32(14):2332-2337. doi:10.1080/14767058.2018.1432589.
- Gimovsky AC, Berghella V. Evidence-based labor management: Second stage of labor (part 4). Am J Obstet Gynecol MFM. 2022;4(3):100548. doi:10.1016/j.ajogmf.2021.100548.
- Barak O, et al. The routine use of intrapartum ultrasound in clinical decision-making during the second stage of labor: Does it have any impact on delivery outcomes? Gynecol Obstet Invest. 2018;83(1):9-14. doi:10.1159/000455847.
- Beck R, et al. Intrapartum sonography of fetal head in second stage of labor with neuraxial analgesia: A literature review and possible medicolegal aftermath. Eur Rev Med Pharmacol Sci. 2019;23(8):3159-3166. doi:10.26355/eurrev_201904_17673.
- Li N, et al. Risk factors and clinical prediction of shoulder dystocia in non-macrosomia. Zhonghua Fu Chan Ke Za Zhi. 2015;50(1):17-21. doi:10.3760/cma.j.issn.0529-567X.2015.01.005.
- Carvalho Neto RH, et al. Assessment of the angle of progression and distance perineum-head in the prediction of type of delivery and duration of labor using intrapartum ultrasonography. J Matern Fetal Neonatal Med. 2021;34(14):2340-2348. doi:10.1080/14767058.2019.1666818.
- Haberman S, et al. A novel partogram for stages 1 and 2 of labor based on fetal head station measured by ultrasound: A prospective multicenter cohort study. Am J Perinatol. 2021;38(S01):e14-e20. doi:10.1055/s-0040-1702989.
- Pan WL, et al. Accuracy of non-invasive methods for assessing the progress of labor in the first stage: A systematic review and meta-analysis. BMC Pregnancy Childbirth. 2022;22(1):608. doi:10.1186/s12884-022-04938-y.
- Ghi T, Dall'Asta A. Sonographic evaluation of the fetal head position and attitude during labor. Am J Obstet Gynecol. 2024;230(3 Suppl):S890-S900. doi:10.1016/j.ajog.2022.06.003.
- Nassr AA, et al. Intrapartum ultrasound measurement of angle of progression at the onset of the second stage of labor for prediction of spontaneous vaginal delivery in term singleton pregnancies: A systematic review and meta-analysis. Am J Obstet Gynecol. 2022;226(2):205-214. https://doi.org/10.1016/j.ajog.2021.07.031.
- Hans R, Reddy D, Shetty J. Serial intrapartum ultrasound to predict vaginal delivery using angle of progression and head-progression distance in term nulliparous women. Eur J Obstet Gynecol Reprod Biol. 2025;293:18-23.