This protocol describes standardized sampling, staining, image acquisition, and automated web-based quantification of isolated human and rodent pancreatic islets using deep-learning-assisted image analysis and visual quality control.
Method Article
A Web Platform for Automated Image-Based Quantification of Human and Rodent Isolated Pancreatic Islets
In This Article
Summary
Abstract
The purpose of this publication is to provide a written and live-action video step-by-step protocol for standardized use of IsletNet, a web-based platform for automated quantification of isolated pancreatic islets in images, starting from sampling and image acquisition to image upload, visual validation, and automatic report generation. The platform was developed for standardized, automated assessment of two-dimensional microscopic images of isolated pancreatic islets to support clinical and experimental islet isolation workflows. Deep-learning-based image segmentation is used to identify islets and exocrine tissue from which contours are extracted for image analysis. Computational algorithms subsequently quantify islet count, volume, and purity. The visual Quality Control tool supports expert validation of automatic image analyses by allowing users to accept, manually correct, or exclude invalid images. The Clinical Islet Isolation module supports purity-fraction batch analysis and generates automatic PDF reports together with downloadable image and tabular data files for record keeping and analysis. The Simple Comparison module compares automated estimates with locally obtained reference results submitted with the corresponding sample images to evaluate the suitability of locally standardized images for automated analysis. The protocol also outlines recommendations for retraining using locally generated standardized images when necessary. Representative data from rodent and human islet isolations, including challenging examples, demonstrate improved automated analysis performance after appropriate training.
Introduction
Transplantation of isolated pancreatic islets into diabetic recipients reduces or eliminates the need for external insulin administration1. The process of islet isolation from cadaveric or living donors is subject to biological and procedural heterogeneity, reflected in variations in yield and quality. Total islet volume represents the primary input for dose determination and clinical decision-making regarding transplant suitability2. The islet size histogram and the islet index number account for differences in size-related effectiveness3. Therefore, attention is paid to individual islets in addition to the total volume, which currently serves as a surrogate marker for beta cell content. Isolated human islets are less dense than rodent islets and are often not well separated from exocrine tissue. Consequently, they are more difficult to distinguish unless stained. A rapid and simple zinc staining method using dithizone was adopted, in which intense red light is reflected from zinc-enriched insulin granules4. Given the opacity of the tissue, only light reflected from the surface is collected, allowing the use of simple stereo- or inverted-microscopy instruments equipped with a light source and a camera.
Numerous attempts have been made to reduce interlaboratory variation by employing digital image analysis tools5,6,7,8,9,10,11,12, however, these approaches have several limitations. In these methods, segmentation of islets and exocrine tissue either relies on manual thresholding, which is prone to subjective error5,6,7,8,9,10, or uses fully automated segmentation approaches11,12. In addition, local software installation is often required5,6,7,8,9,10,11 and may be restricted to specific hardware10,11, limiting general accessibility and standardization.
The overall goal of the present publication is to provide a standardized workflow for automated quantification of isolated pancreatic islets in images using a web-based deep-learning platform with human expert oversight. IsletNet addresses limitations associated with both availability and reliability of islet image analysis. In this article, we present recommended guidelines for sampling islet grafts, generating suitable microscopic images, and properly using the IsletNet tools. The protocol introduces the concept of human supervision of automatically generated results and presents workflows for prospective and established users (Figure 1). The Simple Comparison tool allows prospective users to compare IsletNet results directly with locally obtained reference methods (Figure 1A). Because locally generated standardized images may differ substantially among centers, IsletNet may require retraining before reliable analysis can be achieved (Figure 1B). To facilitate this process, recommendations for standardized staining and image acquisition are provided. For established users, the Clinical Islet Isolation tool is designed to support the human islet isolation workflow (Figure 1C). Downloadable reports together with additional tables and visualizations generated by IsletNet are described in Table 1, while the key calculated parameters are summarized in Table 2.
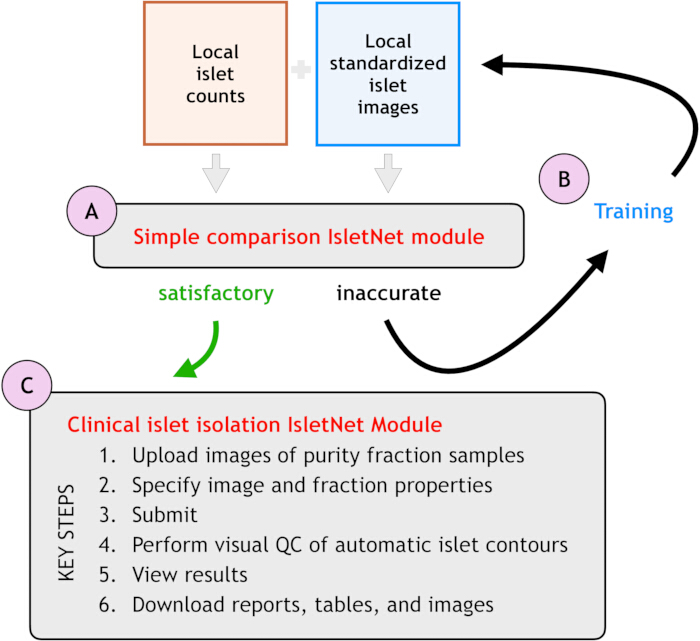
Figure 1: Workflow for prospective and established users of the platform. (A) Local validation workflow using the Simple Comparison module. (B) Retraining requires a set representing locally standardized images. (C) Routine use workflow using the Clinical Islet Isolation module. Key workflow steps are summarized for image upload, analysis, visual quality control (vQC), and report generation. Scale bars are not applicable. Please click here to view a larger version of this figure.
Table 1: Downloadable result files generated by the platform. List of downloadable output files generated by the Clinical Islet Isolation and Simple Comparison tools, grouped according to file format and output category. The table includes report files, segmented image outputs, visualization files, and spreadsheet exports for islet count, volume, purity, and histogram analyses. Please click here to download this Table.
Table 2: Key parameters included in downloadable reports and spreadsheet outputs. Detailed list of metadata, user-defined settings, and quantitative analysis parameters included in downloadable XLSX and CSV files generated by the Clinical Islet Isolation and Simple Comparison tools. Parameters include session metadata, image acquisition settings, and islet quantification metrics for images and individual islets. Please click here to download this Table.
Protocol
Animal procedures were approved by the Ministry of Health of the Czech Republic (Approval no. 49/2023) in accordance with European Communities Council Directive 86/609/EEC. Human islet isolation and use procedures were approved by the State Institute for Drug Control (Approval no. sukls111286/2023). Standardized microscopic images of rat and human islet preparations were analyzed using the Simple Comparison and Clinical Islet Isolation tools to compare automated analysis with manual counting. The standard (short) conversion table13 was used for both manual and automated islet equivalent calculations.
1. Human Supervision
- Initial View of Primary Results (Figure 2)
- Wait for the automatically generated values for islet count, volume, and purity, together with the graphical visualization of the corresponding automatic annotations (e.g., contours or segmentations), to appear in the Batch Results window.
- View summarized results for the current sample image in the left information panel (Figure 2A).
- View replicate values (Figure 2B) and batch averages (Figure 2C) in the right-hand table.
- Browse on the image preview (Figure 2D,E) using the links (Figure 2F). Right-click on the image preview and follow the pop-up menu to download a single image if needed.
- Browse sample images using the navigation arrows (Figure 2G) or select directly from the table.
- Open the Inspection window by clicking inside the current image preview (Figure 2D) to evaluate the quality of the automatically generated contours and validate the results.
- Visual Quality Control
- Move around the image and zoom (Figure 3A) in or out to inspect the contours for potential errors.
- Toggle between the Contour (only counted islets have it), Original image and additional visualization views.
NOTE: The available views are listed in the Legend on the right side of the window (Figure 3B) and can be accessed using the keyboard shortcuts or the links in the top navigation bar (Figure 3C; Table 3). - Proceed to the next image by pressing the down-arrow key if the contours are acceptable (Table 3).
- Correct contouring errors manually when possible. If undetected, partially detected, or spurious islets remain present, classify the image as invalid and exclude it from the analysis.
NOTE: Excluded images are marked in the Batch Results window (Figure 2J) and in all downloaded files.
- Correctable Errors: Unseparated Adjacent Islets
- Separate adjacent islets manually when necessary.
- Left-click outside the islets to initiate a separation line (Figure 3D).
- Add intermediate left-clicks to guide the separation line between adjacent islets (Figure 3E).
- Right-click outside the islets to complete the separation line (Figure 3F).
- Submit the separation line to update the result (Figure 3G).
NOTE: Toggle the visualization of added separation lines on or off as needed (Figure 3H).
- Correctable Errors: Spurious Islets
- Use the separation tool to divide a spurious islet into multiple objects smaller than the islet size threshold.
- Avoid counting small islet fragments by setting the predefined minimum islet size threshold (conventionally 50 µm). Adjust the threshold according to local laboratory practice if necessary.
- Right-click any point on the line and select the appropriate option from the pop-up menu to remove one or all manually added separation lines (Figure 3I).
- Uncorrectable Errors: Missing, Partially Segmented, or Spurious Islets
- Toggle the Segmentation view to verify whether the islets were detected.
- Exclude from batch average calculation any invalid image containing undetected, partially detected, or multiple spurious islets (Figure 3J).
- Uncorrectable Errors: Misclassified Objects
- Exclude the image from evaluation if exocrine tissue, background artifacts, or bubbles are incorrectly classified as islets (Figure 3J).
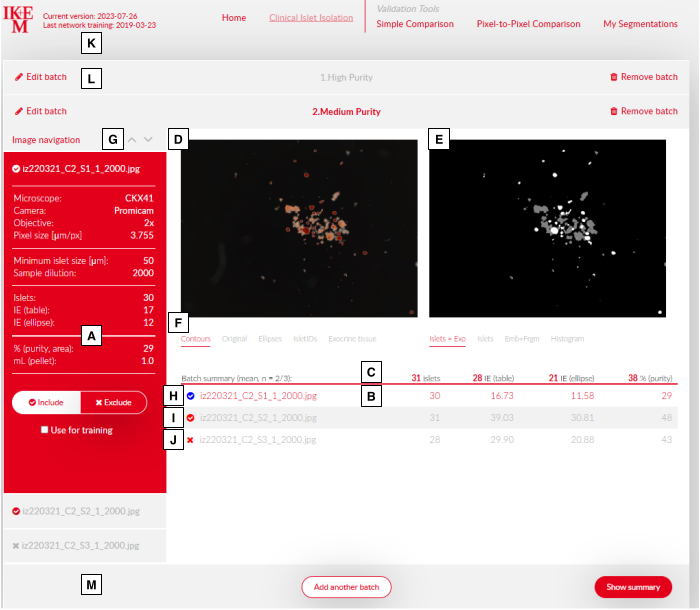
Figure 2. Batch Results window. (A) Current sample result summary. (B) Results for replicate sample images. (C) Batch average values from accepted images only. (D, E, F) Graphical result previews with links. (G) Sample navigation arrows. (H, I, J) Modified, accepted, and excluded images. (K) IsletNet top navigation bar. (L, M) Batch Results window header and footer. Please click here to view a larger version of this figure.
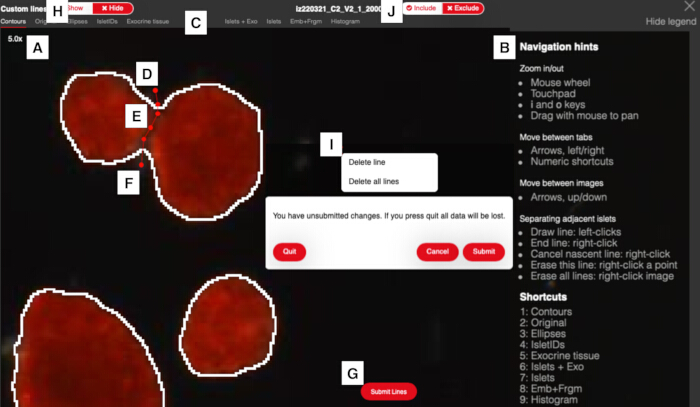
Figure 3. Inspection window for vQC and manual contour correction. (A) Image zoom display. (B) Legend and navigation hints. (C) Top navigation bar of the Inspection window. (D–G) Construction and submission of a manual separation line for adjacent islets. (H) Toggle for displaying or hiding manual separation lines. (I) Removal of manual separation lines. (J) Toggle for excluding an image from statistics. Scale bars are not shown in this interface view. Please click here to view a larger version of this figure.
Table 3: View modes, keyboard shortcuts, and navigation controls available in the Inspection window. Summary of image visualization modes, keyboard shortcuts, and navigation functions available during vQC and manual review of segmentation results in the Inspection window. The table includes contour overlays, segmentation displays, histogram visualization, and image navigation controls used in the Clinical Islet Isolation and Simple Comparison tools. Please click here to download this Table.
2. Navigating the Platform
- Viewing Version and Technical Information
- Review the current software version and the latest training date displayed in the top navigation bar (Figure 2K).
- Open the Home section to access the technical description and associated reference information.
- Preliminary Assessment of Local Images
- Determine whether locally generated standardized images can already be analyzed correctly by the platform, based on the error criteria described in Steps 1.2.4 and 1.5.2, or whether retraining is required for local standardized images (Figure 1A and 1B).
3. Simple Comparison and External Training with Local Images
- Simple Comparison
NOTE: Use the Simple Comparison tool to compare automated analysis results with a locally established reference method, typically standard manual counting13, alternative tables7,11,18 or models5,6. Upload locally generated standardized images together with the corresponding reference values and reference method type. The output includes downloadable tables, images, and PDF reports (Table 1).- Open the Simple Comparison dashboard from the top navigation bar (Figure 4A and 4B).
- Review the Hints section for the required image properties (Figure 4C).
- Download the form.xlsx template (Figure 4D).
- Count islets in multiple samples using a locally established reference method.
- Acquire standardized microscopic images corresponding to the counted samples.
- Ensure that all counted islets are fully included within the image frame.
- Enter the exact image filenames and corresponding parameter values into the form.xlsx template using English decimal points (Figure 4E).
- Upload the completed spreadsheet and corresponding image files by drag-and-drop or using the upload buttons (Figure 4F).
- Select the conversion table or model used for islet volume estimation (Figure 4G).
- Click Submit batch to generate the side-by-side comparison.
- Wait for the analysis results to appear.
- Open the Inspection window to perform visual validation of the contours.
- Exclude images from the analysis if the contours are incorrect (Figure 3J).
NOTE: Manual contour editing is not available in the Simple Comparison tool. - Download the results as tables, images, and PDF reports (Table 1).
- IsletNet training for locally standardized images
- Contact the development team at the Institute for Experimental Medicine (IKEM) at info@isletnet.com.
- Share representative images covering the range of image quality currently obtained locally.
- Discuss image quality requirements with the development team.
NOTE: Key image-quality parameters include sufficient contrast, complete inclusion of islets within the image frame, and minimal overlap between adjacent islets. Islet coloration may vary from red to pink or violet, provided that the distinction from exocrine tissue remains clear. - Create a training image set covering the expected range of islet purities, magnifications, and color variation.
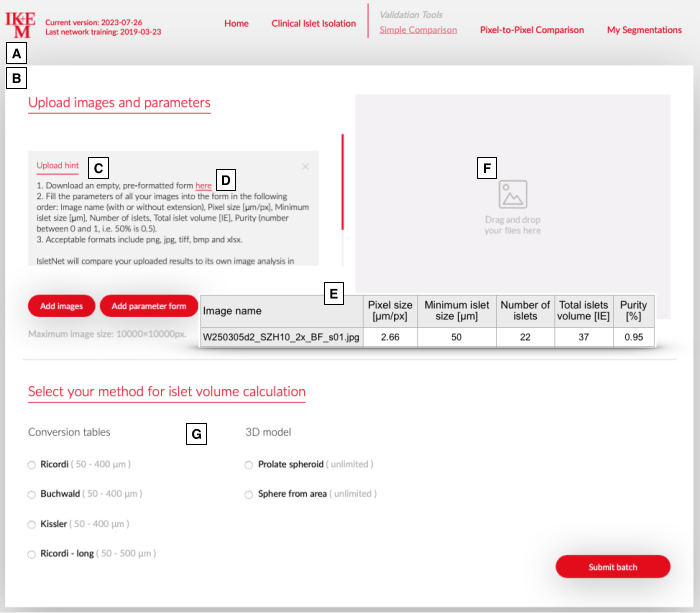
Figure 4. Simple Comparison tool, dashboard and workflow. (A) Top navigation bar. (B) Simple Comparison dashboard. (C) Upload hints and instructions. (D, E) form.xlsx template download and uploaded parameter visualization. (F) Drag-and-drop upload area for images and spreadsheets. (G) Selecting the islet size-to-volume conversion. Please click here to view a larger version of this figure.
4. Sampling
NOTE: Islets sediment rapidly and differentially according to size and shape, which can bias sampling results.
CAUTION: Perform all islet-handling procedures inside a laminar flow hood while wearing appropriate personal protective equipment.
- Use 50 mL or 250 mL tubes for the islet suspension.
- Determine the required sampling fraction according to the observed pellet volume and purity using local standard operating procedures.
- Mix the islet suspension thoroughly by gently inverting the tube five times immediately before sample collection.
- Draw the sample immediately using a large-bore pipette tip to prevent blockage by exocrine tissue and minimize islet damage.
5. Optimizing Islet Image Acquisition
- Dithizone Preparation
NOTE: Consistent dithizone staining is required to ensure sufficient contrast between islets and exocrine tissue. Two commonly used preparation methods are described below.
CAUTION: Dithizone is a suspected reproductive toxin. Dimethyl sulfoxide (DMSO) is toxic and skin penetrant. Sodium hydroxide is highly corrosive and can cause severe chemical burns. Handle all chemicals while wearing appropriate personal protective equipment, avoid skin contact, and dispose of waste according to institutional hazardous waste procedures.- Resuspension in DMSO13
- Weigh 50 mg of dithizone powder.
- Dissolve the dithizone in 5 mL of DMSO.
- Incubate the solution at 37°C and vortex vigorously for 1 min every 5 min until dissolution is complete.
- Dilute 1 mL of the stock solution with 20 mL of Hank’s Balanced Salt Solution containing 2% fetal bovine serum to prepare the working solution.
- Filter the solution through a 0.22 µm syringe filter.
- Wrap the tube in aluminum foil to protect the solution from light.
NOTE: Use the working solution within approximately 12 h.
- Resuspension in alkaline alcoholic solution (alternative to Ref. 8)
- Weigh 50 mg of dithizone powder.
NOTE: Prepare aliquots in advance if desired. - Add 800 µL of 70% ethanol to the dithizone.
- Add 400 µL of 1 M sodium hydroxide solution and vortex thoroughly until dissolution is complete.
- Dilute the solution with phosphate-buffered saline containing 0.2 mg/mL human albumin to a final volume of 20 mL.
- Filter the solution through a 0.22 µm syringe filter.
- Wrap the tube in aluminum foil to protect the solution from light.
NOTE: Use the working solution within approximately 12 h.
- Weigh 50 mg of dithizone powder.
- Resuspension in DMSO13
- Islet Staining
- Add 25 µL of dithizone working solution to the center of a 35 mm dish.
- Add 50 µL of islets suspended in Hank’s Balanced Salt Solution containing albumin, Complete Culture Medium, or Transplantation Medium.
NOTE: The actual sample volume ranges between 20-50 µL dependent on the purity-fraction pellet, with a final dithizone concentration of 0.85 mg/mL to 1.37 mg/mL. - Pipette the suspension in and out three times using the first stop slowly to mix the solutions gently while avoiding bubble formation.
- Incubate the sample at 20°C–25°C for 1–2 min while visually monitoring the staining under the microscope until the islets appear bright red. Some preparations may contain poorly stained islets, for which IsletNet is also trained.
- Use a 10 mL syringe to quickly inject 4 mL of phosphate-buffered saline supplemented with 0.2 mg/mL albumin directly into the stained sample while avoiding both bubbles and splashing.
- Immediately swirl the dish vigorously in a circular motion to mix the solutions, moving the islets towards the center before settling down.
OPTION 1: Add 4 mL of PBS/albumin carefully around, leaving the islets in dithizone undisturbed. Then, gently swirl the dish in a circular motion to mix the solutions keeping islets in the center. Wait till dithizone disperses in the dish.
OPTION 2 (suitable for stereomicroscope): Instead of diluting the islets, spread the dithizone-islet drop into a thin layer using a pipette tip or needle instead of dilution to reduce reflections. - Inspect the sample under the microscope and immediately return any displaced islets to the camera field gently by swirling the surrounding solution with a pipette tip.
- Start image acquisition immediately to minimize cytotoxicity and islet volume changes.
- Image Acquisition
NOTE: Use a stereo or inverted microscope equipped with a low-magnification objective and a stable light source. Shield the dish from additional light sources, such as room lighting.- Turn on the light source and allow the halogen bulb to warm up for 5 min.
- Set a standardized light intensity to avoid glare and underexposure. The exact range depends on the imaging hardware used.
NOTE: The optimal light intensity may vary according to magnification and sample purity. - Select the objective and zoom setting that allows all islets to remain within the camera field of view.
- Maintain the same magnification for all samples within a batch and preferably across all purity batches.
- Calibrate the white balance using a normalized white slide if necessary. If image quality remains unsatisfactory because of unique characteristics of the islet preparation, adjust RGB values and/or gamma settings.
- Adjust the exposure time and, if necessary, the illumination intensity or gain using the color histogram avoiding overexposure.
NOTE: Samples containing abundant exocrine tissue may require different camera or illumination settings because of reflected light from non-islet tissue. To ensure reproducibility, save these parameters as a separate configuration file for future reference. - Capture the image and save the file in a supported format, including JPG, PNG, TIFF, or BMP.
NOTE: Include the date, purity fraction, magnification or pixel size, and dilution in the filename to facilitate future reanalysis (e.g., iz260105_H1_obj1.25x_1000x.jpg). - Acquire an image of the stage micrometer using the identical magnification and zoom settings used for sample imaging.
6. Clinical Islet Isolation Tool
NOTE: The key workflow steps are summarized in Figure 1C. Analyze images in purity-fraction batches as samples become available.
- Setting the Pixel Size
NOTE: The calculated pixel size remains valid only when the stage micrometer image is acquired using the identical magnification and zoom settings as the analyzed samples.- Open the Clinical Islet Isolation dashboard.
- Click Upload Stage Micrometer and select the stage micrometer image.
- Draw the endpoints of the red measurement line across a known distance on the digital ruler.
NOTE: Use a longer calibration distance when possible to improve measurement accuracy. - Enter the known distance in micrometers (µm).
- Submit the calculated pixel size.
NOTE: The platform retains the calculated pixel size until modified manually.
- Batch Upload of Purity-Fraction Images
NOTE: Use 3–4 replicate samples to ensure reliable calculation of the batch mean and standard deviation values. Use the same dilution for all samples within a batch.- Drag and drop images representing replicate samples of the same purity fraction into the upload area.
NOTE: The platform prevents repeated use of the same image based on filename recognition. - Modify the pixel size if necessary.
- Enter the minimum islet size threshold.
- Enter the sample dilution value (e.g., 1000).
- Enter the pellet volume in milliliters recorded from the original flask.
- Enter the operator initials.
NOTE: The operator initials appear in the generated report. - Enter the Session ID representing the current isolation procedure.
- Enter the Batch ID (e.g., 1 High Purity).
NOTE: The platform orders fractions alphanumerically according to Batch ID. - Click Submit Batch to start the analysis.
- Drag and drop images representing replicate samples of the same purity fraction into the upload area.
- Review and Finalize Batch Results
NOTE: Close the previous Batch Results window by clicking the header if necessary (Figure 2L).- Wait for the numerical and graphical results to appear in the Batch Results window.
- Open the Inspection window by double-clicking the image preview in the Batch Results window.
- Review and, if necessary, correct the contours as described in Step 1.
- Proceed to the next image using the down-arrow key if the contours are acceptable.
- Add another batch or proceed to the session summary using the buttons located at the bottom of the window (Figure 2M).
- Batch Editing
NOTE: The platform stores image filenames throughout the session to prevent inadvertent repeated use of the same image. This includes removed images. Rename images before reuse if necessary.- Click Edit Batch to add or remove images, correct sample specifications, or rename the batch (Figure 2L).
NOTE: Record the image filenames before modifying the batch if image reuse is anticipated. - Click Remove Batch to delete the batch entirely (Figure 2L).
- Click Edit Batch to add or remove images, correct sample specifications, or rename the batch (Figure 2L).
- Viewing the Summary and Generating Reports
- Click Show Summary to display the session overview (Figure 2M).
NOTE: Return to previous batches and edit them if necessary. - View the total islet count, volume, and pellet volume values for the session together with the corresponding mean batch values.
- Click Show Summary to display the session overview (Figure 2M).
- Download the report.
NOTE: The short report includes total islet count, volume, purity, pellet values, histograms, and purity-fraction summaries. The complete report additionally includes graphical information for each sample image, with accepted values displayed in red and excluded values displayed in black.
Results
Pure Rat Islets
In the first experiment, 36 images representing 12 samples containing a total of 249 purified rat islets were acquired during four independent imaging sessions. Images were generated using a stereomicroscope under three standardized but distinct illumination conditions employing halogen and light-emitting diode (LED) light sources together with different camera settings. Ground-truth (GT) segmentations were generated manually for three representative images by IsletNet training expert.
When the images were analyzed using the publicly available version of the Simple Comparison tool, none of the automatically generated contours passed visual quality control (vQC, Figure 5F). The platform was subsequently retrained using representative local images, and all contours generated by the retrained experimental version passed vQC (Figure 5C).
The ratio of automated to manual islet volume estimates demonstrated consistent performance across the three imaging conditions after retraining, with median values of 1.03, 0.98, and 0.94 for illumination conditions A, B, and C, respectively (Figure 5A). These results represented a substantial improvement compared with the original training model (Figure 5B).
Pixel-wise comparison against GT segmentations demonstrated close agreement between automated and manually generated contours after retraining (Figure 5D), corresponding to accurate contour placement in representative images (Figure 5C). In contrast, the original training model showed an increased proportion of false-negative pixels (Figure 5G) and contour misplacement (Figure 5F), resulting in a shift toward smaller islet categories in the corresponding islet size histograms (Figure 5E vs 5H).
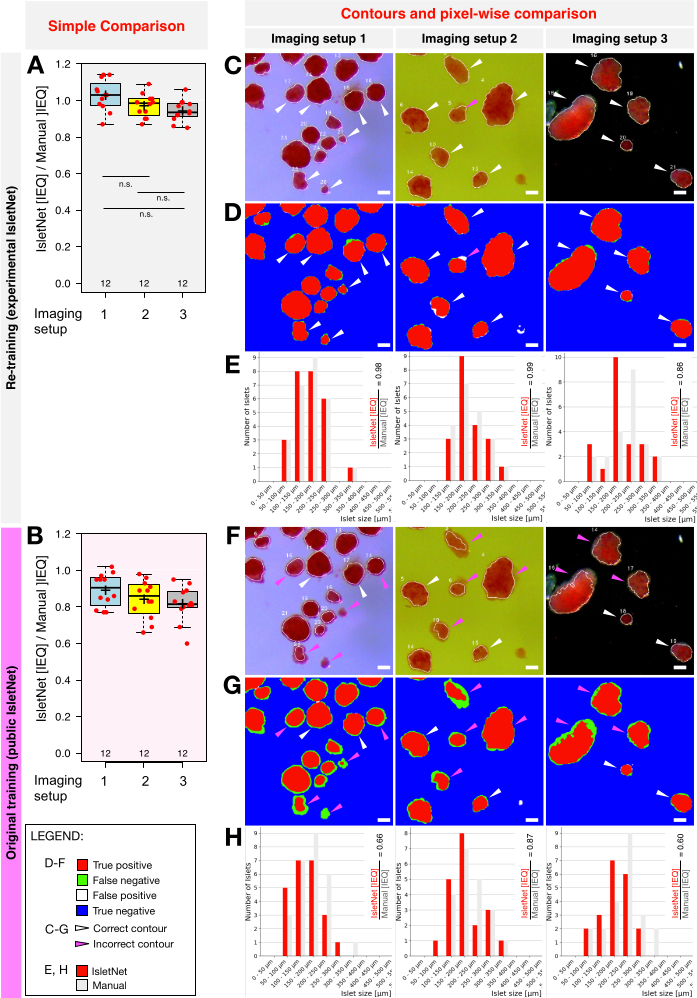
Figure 5. Assessment of platform retraining using three imaging setups and rat islet preparations. (A) Comparison of IsletNet and manual islet equivalent (IEQ) estimates after retraining using three imaging setups. (B) Comparison of IsletNet and manual IEQ estimates using the original public training model. (C, F) Representative contour placement using the vQC tool after and before retraining the model, respectively. White arrowheads indicate correct contour placement and magenta arrowheads indicate incorrect contour placement. (D, G) Pixel-wise comparison against ground truth after retraining and with the original training model, respectively. True positive, false positive, false negative, and true negative regions are indicated in the legend. (E, H) Representative islet size histograms after retraining and with the original training model, respectively, compared with manual counting. Imaging setup 1 = LED illumination; imaging setup 2 = halogen illumination; imaging setup 3 = LED dark-field illumination. Scale bars = 100 µm. Boxplots are shown according to Tukey convention; whiskers extend to data points within 1.5 × interquartile range from the first and third quartiles. Please click here to view a larger version of this figure.
Clinical Human Islet Preparations
In the second experiment, 17 images representing a single human islet isolation procedure with three purity-fraction pairs were analyzed using the publicly available version of the platform. One sample was lost. After vQC, all images representing medium- and low-purity fractions were excluded because of spurious islet detection (data not shown). The platform was subsequently retrained using representative local images.
Following retraining, all images passed vQC after the addition of three manual separation lines. Batch-wise comparison with manual counting demonstrated an overall underestimation of ≤5% for total islet count and volume estimates. Samples diluted between 2,000- and 4,000-fold contained between 80 and 4 islets depending on purity fraction. The relative contribution of individual purity fractions to the final preparation is shown in Figure 6A. High-purity fraction 1VC2 contributed predominantly smaller islets compared with medium-purity fraction 2SC1. The overall islet size histogram generated automatically by the platform is shown in Figure 6B.
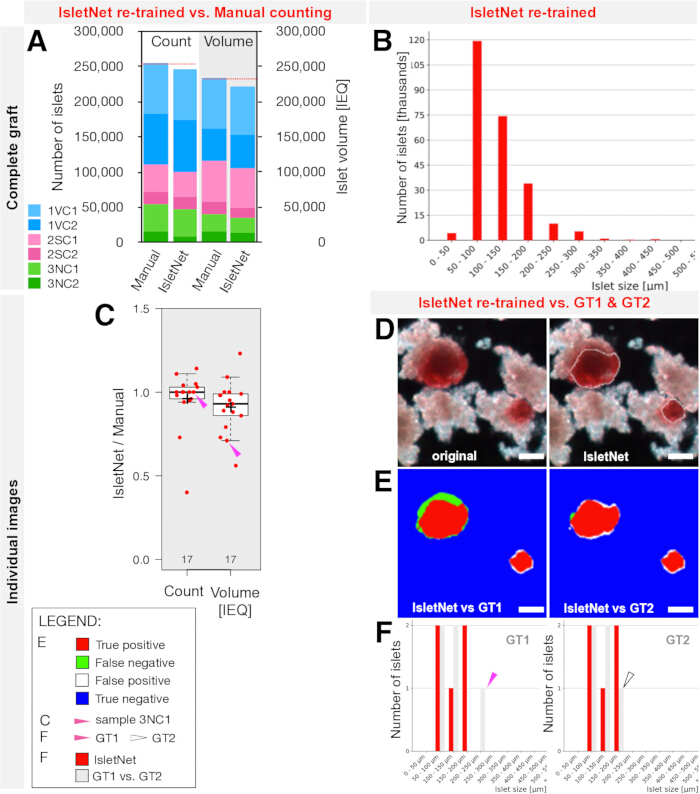
Figure 6. Quantification and analysis of human islet isolation samples. (A) Islet count and islet equivalent volume estimates using IsletNet and manual counting methods across purity fractions of the complete graft. (B) Final islet size histogram generated by IsletNet using batch mean values. (C) Comparison of IsletNet and manual estimates for count and volume across 17 individual images. (D) Representative image detail from sample 3NC1 showing the original image and contour placement generated by retrained IsletNet. (E) Pixel-wise comparison of IsletNet segmentation against the ground truth generated by the manually-counting expert vs. IsletNet-training expert (GT1 vs. GT2). True positive, false positive, false negative, and true negative regions are indicated in the legend. (F) Representative islet size histogram for the same image comparing IsletNet and manual results. Magenta arrowheads indicate contour and islet size category shift. Scale bars = 100 µm. Boxplots are shown according to Tukey convention; whiskers extend to data points within 1.5 × interquartile range from the first and third quartiles. Please click here to view a larger version of this figure.
Automated and manual estimates were subsequently compared for all individual images (Figure 6C). Median ratios between automated and manual estimates were 1.00 for islet count and 0.93 for islet volume, with several outliers observed. In one representative low-purity sample (3NC1), the platform identified the same number of islets as manual counting (five islets) but estimated a 29% lower islet volume. These data points are indicated by arrowheads in Figure 6C.
The largest islet, partially trapped in exocrine tissue, from this representative image is shown in Figure 6D, including the original image and the automatically generated contour overlay. Pixel-wise comparison against GT segmentations generated independently by two experts is shown in Figure 6E. The corresponding islet size histograms demonstrated a shift in size distribution between manual and automated segmentations (Figure 6F).
Operational Performance of Automated Analysis
Operational performance of the Simple Comparison and Clinical Islet Isolation tools was evaluated under standard internet conditions with average download and upload speeds of 50 Mbps and 30 Mbps, respectively. Five image batches containing 12 images each were analyzed using image sizes ranging from 0.5 MB JPEG files to 20 MB TIFF files. Download duration was measured for complete ZIP result packages.
Analysis visualization times and download durations increased progressively with image size for both tools (Table 4). The Clinical Islet Isolation tool required longer processing times than the Simple Comparison tool for equivalent image sets. These results demonstrate the practical relationship between image resolution, file format, and analysis throughput during routine operation.
Table 4: Analysis visualization times and download durations for the Clinical Islet Isolation and Simple Comparison tools. Comparison of processing times required for result visualization and file download using image batches of different file sizes and formats. Measurements were obtained using batches containing 12 images and are reported as elapsed time from batch submission to result visualization or download completion. Please click here to download this Table.
Discussion
The protocol presented here describes the practical workflow for prospective and established users of IsletNet, with emphasis on two critical features of the platform: expert vQC and neural network retraining. The representative results demonstrate that accurate automated quantification depends not only on image segmentation performance, but also on the user’s ability to critically evaluate contour placement and image suitability before accepting the results. Two additional advanced tools, Pixel-to-Pixel Comparison and My Segmentations, were used to generate selected validation results; however, these tools are intended primarily for neural network training support and are therefore not included in the protocol workflow.
IsletNet was developed as a collaborative and broadly accessible reference tool for standardized islet image analysis across laboratories. The neural network was trained and validated using manually annotated GT segmentations of original two-dimensional microscopic images of isolated human and rat islets14,15,16. Two separate models for dithizone-stained preparations, and an additional research model for unstained rat islets were generated, with access available upon request. The platform version and training date are displayed in the user interface. IsletNet automatically segments islets and exocrine tissue and subsequently calculates islet number, volume, and purity using the user-defined pixel size and minimum islet size threshold. The islet size threshold choice depends on image quality and purpose of the analysis (side-by-side comparison with the manual counting vs. study of small islets) rather than species. Given the resolution of conventional microscopy, the meaningful minimum islet size is 50 µm7,8,9,12, but it can be reduced up to 10 µm for images obtained with an appropriate instrument10. Islet volume estimations are generated using standard sphere-based conversion table13 as well as alternative conversion tables7,18,19, including fitted ellipse approximations5,6 and contour-based Spinacle and Sphiracle models17. The resulting values are reported in islet equivalents and nanoliters, while purity is calculated from either tissue area or estimated tissue volume. A critical step in the protocol is the acquisition of standardized microscopic images suitable for automated segmentation. IsletNet was trained using images acquired with stereo and inverted microscopes equipped with a range of complementary metal oxide semiconductor cameras and illumination systems. Low-magnification objectives (1–2×) are advantageous because they allow the complete sample to remain within the field of view while maintaining a pixel size compatible with reliable detection of small islets. Consistent illumination, stable white balance, and avoidance of image overexposure are essential for reliable contour generation. The representative results demonstrate that retraining using representative local images can substantially improve segmentation performance across heterogeneous imaging conditions. As a practical guideline, images are generally suitable for IsletNet training when islet and exocrine tissue boundaries are clearly distinguishable to an experienced observer. Images containing clustered or heavily overlapping islets should be avoided whenever possible.
The protocol also highlights several limitations and troubleshooting considerations associated with automated image analysis. While IsletNet substantially increases throughput, objectivity, and reproducibility compared with fully manual counting, the method remains sensitive to image quality. Incorrect contour placement (spurious islet detection, and failure to sepa-rate adjacent islets) may occasionally occur and can affect downstream quantification. A routine vQC remains essential before accepting automated results. Immediate on site application to IsletNet is advantageous because unsuitable images can be reacquired with adjusted imaging parameters. Manual correction of automatic contours is possible within the Inspection window except for missing islets or multiple spurious islets. In addition, the automated separation algorithm is based on contour geometry and islet size distribution statistics and may therefore differ from an individual expert’s initial interpretation while still remaining analytically acceptable.
The reliability of IsletNet is determined primarily by consistency between local image quality and the training dataset rather than by species alone. Although the current training set contains human islets of varying purities and high-purity rat islets, the platform may be extended to other species provided the image characteristics remain consistent to the training data. For example, porcine islets purified by culture may resemble embedded human islets present in the training dataset. In contrast, extensively cultured islets with weak dithizone staining were not represented during training and may require additional training. The Simple Comparison tool, therefore, supports an important validation step for new users or new imaging configurations. The results presented here underscore how differing expert interpretations of embedded islets can influence GT generation and downstream volume estimation. To address the absence of broad expert consensus in future multicenter studies, the IsletSwipe application20 was developed to facilitate consensus-based image annotation.
Compared with conventional manual counting under a microscope, IsletNet provides substantially higher throughput, permanent digital documentation, and standardized quantitative outputs while reducing operator-dependent variability. Manual counting may still provide greater confidence in tissue identification in borderline cases, but it is limited by subjective size estimation, lower scalability, and extensive personnel training requirements. As a web-based service, IsletNet enables inter-laboratory comparability by centralized yet anonymous analysis. Analysis speed remains dependent on local internet bandwidth, image file size, and image complexity. Larger TIFF files may improve image fidelity but require longer upload and download times compared with compressed JPEG images.
Overall, the results presented here demonstrate that reliable automated quantification can be achieved when local image acquisition remains reproducible and consistent with the training set. Users are encouraged to incorporate vQC in their routine and consider retraining whenever substantial changes in local imaging conditions are introduced.
Disclosures
The authors declare that the research was conducted in the absence of any commercial or financial relationships that could be construed as a potential conflict of interest.
Acknowledgements
The public version of IsletNet was developed and trained by Filip Matzner, Jan Belohlavek, and Adam Blazek (Iterait a.s., Prague, Czech Republic). The experimental version was trained by Jakub Monhart, Petra Curdova, and Jan Kubant (Mild Blue s.r.o., Prague, Czech Republic).
The authors thank the following individuals and institutions for providing microscopic images used for IsletNet network training: Andrew Friberg (Department of Immunology, Genetics and Pathology, Uppsala University, Sweden); Hanne Scholz (Institute for Surgical Research, Oslo University Hospital, Norway); Valéry Gmyr (Translational Research in Diabetes, University of Lille, INSERM, France); Josh Wilhelm (Schulze Diabetes Institute, University of Minnesota, Minneapolis, USA); Domenico Bosco (Department of Surgery, University of Geneva and Geneva University Hospitals, Switzerland); Jason Doppenberg (Department of Internal Medicine, Leiden University Medical Center, The Netherlands); Karolina Golab (Transplant Institute, Biological Sciences, University of Chicago, USA); Minna Honkanen-Scott (Newcastle University, UK); Hirotake Komatsu (City of Hope, USA); Rebecca Spiers (Oxford University, UK); and Zuzana Berkova, Jan Kriz, and Peter Girman (Institute for Clinical and Experimental Medicine [IKEM], Prague, Czech Republic).
The authors also gratefully acknowledge Zuzana Berkova and Klara Zacharovová for technical support during rat islet isolation procedures used in this study.
This work was supported by the Ministry of Health of the Czech Republic (grants no. NU22-01-00141/ NW25-01-00221), by the National Institute for Research of Metabolic and Cardiovascular Diseases project (Program EXCELES, project no. LX22NPO5104), funded by the European Union – Next Generation EU, and by the Ministry of Health, Czech Republic - conceptual development of research organization ("Institute for Clinical and Experimental Medicine – IKEM, IN 00023001").
Materials
| Name | Company | Catalog Number | Comments |
|---|---|---|---|
| 35 mm Petri dishes | Sigma-Aldrich | P5481 | Unsterile |
| 200 µL pipette tips, wide-bore | Sigma-Aldrich | AXYT205WBCRS | For islet suspension dispensing before staining |
| Dimethyl sulfoxide (DMSO) | Sigma-Aldrich | D2650 | GC grade or cell culture grade |
| Dithizone (DTZ) | Sigma-Aldrich | D5130 | Powder |
| Ethanol, 70% | Local supplier | N/A | (v/v) in H2O; for DTZ preparation |
| Fetal bovine serum (FBS) | Gibco | 10270106 | Heat-inactivated, qualified |
| Hank’s Balanced Salt Solution (HBSS) | Sigma-Aldrich | H6648 | With or without phenol red (specify based on assay) |
| Human albumin | Grifols | 61953-0001-2 | High-concentration solution (200 g/L) |
| Infinity 1-3C | Lumenera | 3-1URC | CMOS, 3 MP |
| Infinity Capture | Lumenera | N/A | Standard image acquisition software |
| Inverted microscope CKX41 | Olympus | N/A | 1.25x and 2x objectives |
| LED-High-Power-Spots (2-arm) | Photonics | 10068 | LED light source; dual gooseneck guide |
| Light source Highlight 2000 | Olympus | 5-HL2000 | Halogen light source (14.5 V, 90 W); manual intensity control; dual gooseneck guide |
| Laboratory essentials | Various | N/A | Pipettes, tubes, needles, syringes, laboratory timers, standard PPE |
| MicroCam software | Bresser | N/A | Standard image acquisition software |
| MikroCam 3.0M | Bresser | 86000180 | CMOS, 3.1 MP camera |
| Millex-MP filter unit | MilliporeSigma | SLMP025SS | 0.22 µm pore size, PES membrane |
| Phosphate-buffered saline (PBS) | Gibco | 10010023 | pH 7.4 |
| Promicam Pro 3-5 CP | Promicam | E61MPR937 | CMOS, 5 MP, high-dynamic-range camera |
| QuickPHOTO | Promicra | N/A | Standard image acquisition software |
| Sodium hydroxide (1 M NaOH) | Local supplier | N/A | For pH adjustment and solubilization during DTZ preparation |
| Stage micrometer | Thorlabs | R1L3S1P | 10 mm length; 50 µm divisions for calibration |
| Stereo microscope SZH10 | Olympus | N/A | 1x apochromat objective |
References
- Shapiro AMJ, et al. International trial of the Edmonton protocol for islet transplantation. N Engl J Med. 2006;355:1318-30.
- Hering BJ, et al. Single-donor, marginal-dose islet transplantation in patients with type 1 diabetes. JAMA. 2005;293:830-5.
- Lehmann R, et al. Superiority of small islets in human islet transplantation. Diabetes. 2007;56:594-603.
- Latif ZA et al. A simple method of staining fresh and cultured islets. Transplantation. 1988 Apr;45(4):827-30. PMID: 2451869.
- Girman P, et al. Digital imaging as a possible approach in evaluation of islet yield. Cell Transplant. 2003;12:129-33.
- Niclauss N, et al. Computer-assisted digital image analysis to quantify the mass and purity of isolated human islets before transplantation. Transplantation. 2008;86:1603-9.
- Kissler HJ, et al. Validation of methodologies for quantifying isolated human islets: an islet cell resources study. Clin Transplant. 2010;24:236-42.
- Friberg AS, et al. Quantification of the islet product: presentation of a standardized current good manufacturing practices compliant system with minimal variability. Transplantation. 2011;91:677-83.
- Wang LJ, et al. Application of digital image analysis to determine pancreatic islet mass and purity in clinical islet isolation and transplantation. Cell Transplant. 2015;24:1195-204.
- Gmyr V, et al. Automated digital image analysis of islet cell mass using Nikon’s inverted Eclipse Ti microscope and software to improve engraftment may help to advance the therapeutic efficacy and accessibility of islet transplantation across centers. Cell Transplant. 2015;24:1-9.
- Buchwald P, et al. Fully automated islet cell counter (ICC) for the assessment of islet mass, purity, and size distribution by digital image analysis. Cell Transplant. 2016;25:1747-61.
- Habart D, et al. Automated analysis of microscopic images of isolated pancreatic islets. Cell Transplant. 2016;25:2145-56.
- Ricordi C, et al. Islet isolation assessment in man and large animals. Acta Diabetol Lat. 1990;27:185-95.
- Ronneberger O, et al. U-Net: convolutional networks for biomedical image segmentation. In: Navab N, et al., editors. Medical Image Computing and Computer-Assisted Intervention – MICCAI 2015. Cham: Springer International Publishing; 2015. p. 234-41.
- Sudre CH, et al. Generalised Dice overlap as a deep learning loss function for highly unbalanced segmentations. Lect Notes Comput Sci. 2017;10553:240-8.
- Kingma DP, Ba J. Adam: a method for stochastic optimization. arXiv [Preprint]. 2017. Available from: https://doi.org/10.48550/arXiv.1412.6980
- Habart D, et al. IsletNet supports accurate volume estimation of isolated pancreatic islets. In: 14th EPITA Symposium Abstract Book; 2025 Jan 26–28; Innsbruck-Igls, Austria. Abstract OP11.
- Ricordi C. Quantitative and qualitative standards for islet isolation assessment in humans and large mammals. Pancreas. 1991;6:242-4.
- Buchwald P, et al. Quantitative assessment of islet cell products: estimating the accuracy of the existing protocol and accounting for islet size distribution. Cell Transplant. 2009;18:1223-35.
- Habart D, et al. IsletSwipe, a mobile platform for expert opinion exchange on islet graft images. Islets. 2023;15:2189873.
Reprints and Permissions
This article has been published
Video Coming Soon