This protocol describes an anthrone colorimetric method for quantifying glycogen in rat liver and skeletal muscle across different metabolic states.
A subscription to JoVE is required to view this content. Sign in or start your free trial.
Method Article
Anthrone Colorimetric Method for Quantifying Glycogen in Rat Liver and Skeletal Muscle
* These authors contributed equally
In This Article
Summary
Abstract
Glycogen is a major intracellular glucose reserve in liver and skeletal muscle and plays a fundamental role in carbohydrate metabolism. Hepatic glycogen is essential for preserving systemic glycemic homeostasis, whereas skeletal muscle glycogen supports physical activity and exercise performance. Accurate quantification of tissue glycogen is therefore critical for studies in which glycogen metabolism is dynamically regulated or pathologically altered. Here, we describe a reliable and sensitive anthrone colorimetric method for quantifying glycogen content in rat liver and skeletal muscle. The protocol consists of sequential steps, including alkaline digestion, deproteinization, glycogen precipitation, alcohol washing, and color development using anthrone reagent. The applicability of this method is demonstrated in rats subjected to three physiologically relevant conditions: ad libitum feeding, overnight fasting, and short-term refeeding. These experimental paradigms capture key metabolic states associated with glycogen storage, depletion, and resynthesis. Orthogonal western blot analysis of key enzymes, glycogen synthase and glycogen phosphorylase, provides mechanistic support to the observed metabolic changes. The applicability of this method is further demonstrated in animals treated with epinephrine to model acute stress–induced glycogen breakdown. Collectively, this method provides a wide dynamic range and sufficient sensitivity to quantify tissue glycogen across markedly different physiological states. It offers a reliable tool for investigating glycogen metabolism in vivo and can also be applied to in vitro cell culture models.
Introduction
Glycogen is a highly branched polysaccharide that serves as a major energy reservoir in skeletal muscle and liver of mammals, and to a lesser extent in other organs such as the brain, kidney, heart, and adipose tissue1. During feeding, surplus glucose undergoes polymerization or de novo lipogenesis, and is stored as glycogen or lipids. However, during fasting or physical exertion, glycogen undergoes enzymatic degradation, ensuring a constant and rapid supply of glucose to fulfill energy demands. This buffering capacity of glycogen is essential for maintaining glycemic homeostasis during physiological fast–refeeding cycles2.
Glycogen synthesis is catalyzed by glycogen synthase (GYS), which exists in two mammalian isoforms: GYS1 and GYS2. GYS1 is predominantly expressed in skeletal muscle, whereas GYS2 is the liver isoform. The catalytic activity of GYS is suppressed by phosphorylation at multiple sites, including Ser641, under fasting conditions, whereas its activity is stimulated upon dephosphorylation under feeding conditions. Glycogen breakdown is catalyzed by glycogen phosphorylase. The liver isoform is PYGL, and the muscle isoform is PYGM. In contrast to GYS, their catalytic activity is stimulated upon phosphorylation at Ser15 during fasting and is suppressed upon dephosphorylation after feeding3.
Proper regulation of glycogen metabolism is fundamental to numerous biological processes, and dysregulated glycogen metabolism has been identified as a causal factor in many diseases. Specifically, altered hepatic glycogen metabolism is associated with various metabolic disorders, including glycogen storage diseases4, type 2 diabetes5, metabolic dysfunction–associated steatotic liver disease6,7 and impaired counterregulatory response to hypoglycemia8. In addition, brain glycogen is essential for long-term memory formation9, while skeletal muscle glycogen is a key regulator of endurance capacity10. Therefore, accurate quantification of tissue glycogen is critical for studies in which glycogen metabolism is dynamically regulated or pathologically altered, enabling investigation of disease mechanisms and evaluation of glycogen-modulating interventions.
Several glycogen quantification methods have been reported, including the anthrone method11,12, amyloglucosidase method13, phenol–sulfuric acid method14 and the non-invasive nuclear magnetic resonance spectroscopy (MRS) method15, with each method having certain advantages and limitations. Here, we describe a detailed protocol for the anthrone colorimetric method to quantify glycogen in rat liver and skeletal muscle (Figure 1). This protocol includes sequential steps of alkaline digestion, deproteinization, glycogen precipitation, alcohol washing, and color development using anthrone reagent. This method is simple, economical, and requires minimal specialized instrumentation. To demonstrate its sensitivity and reproducibility, we calculated the limit of detection (LOD), limit of quantification (LOQ), as well as the intra-assay and inter-assay coefficient of variation (CV%), using a series of glycogen standards. To demonstrate its applicability, glycogen levels in liver and skeletal muscle were assessed under three physiologically relevant conditions: ad libitum feeding, 16-h overnight fasting, and short-term refeeding. In addition, the method was demonstrated using epinephrine-treated animals to model acute stress–induced glycogen breakdown. Orthogonal western blot analysis of key enzymes involved in glycogen metabolism was performed to corroborate the observed metabolic changes.
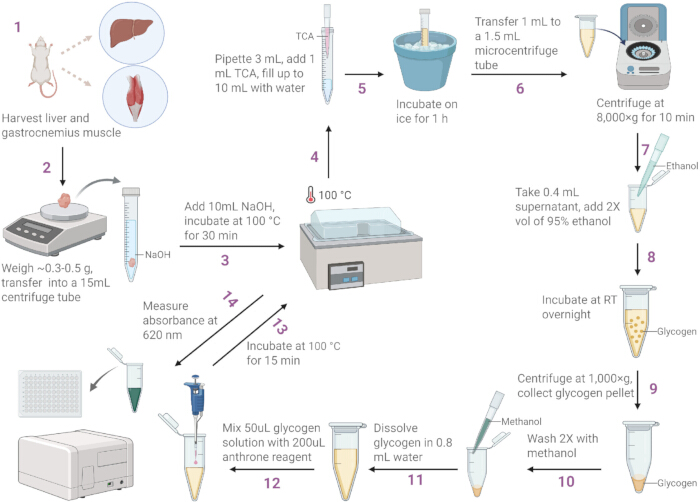
Figure 1: Overview of the glycogen quantification workflow. Schematic representation of the experimental workflow for glycogen quantification in liver and skeletal muscle. The procedure includes tissue collection, alkaline digestion, protein precipitation, glycogen isolation, and anthrone-based colorimetric detection. Please click here to view a larger version of this figure.
Access restricted. Please log in or start a trial to view this content.
Protocol
All animal protocols were approved by the Institutional Animal Care and Use Committee (IACUC; #1905019) at Nanjing Medical University.
1. Preparation of Reagents
- Refer to the Table of Materials for all reagents used in this study.
- Prepare all solutions before the onset of experiments.
- Scale solution volumes as needed.
- Prepare 1 M sodium hydroxide (NaOH) solution
- Weigh 40 g of NaOH pellets.
- Add the NaOH pellets to 800 mL distilled water.
- Stir the solution with a glass rod until no undissolved particles remain at the base of the vessel.
- Transfer the solution to a 1 L volumetric flask.
- Bring the volume to exactly 1 L with distilled water.
- Store the solution in a tightly closed bottle at room temperature (RT; 18°C–23°C).
CAUTION: NaOH is corrosive. Wear safety goggles, gloves, and a lab coat. Commercial NaOH pellets are not 100% pure and absorb water. Avoid prolonged exposure of pellets to air.
- Prepare 20% lithium chloride (LiCl) stock solution
- Weigh 20 g of anhydrous LiCl powder.
- Add the LiCl powder to 80 mL distilled water.
- Stir the solution until no undissolved particles remain at the base of the vessel.
- Transfer the solution to a 100 mL volumetric flask.
- Bring the volume to exactly 100 mL with distilled water.
- Store the solution in a tightly closed bottle at RT.
NOTE: LiCl can irritate the skin, eyes, and respiratory tract. Wear safety goggles, gloves, and a lab coat. LiCl is highly hygroscopic. Minimize exposure to air to prevent water absorption.
- Prepare anthrone reaction solution
- Place 28 mL distilled water in a 1 L beaker.
- Add 72 mL high-purity concentrated (98%) sulfuric acid (H₂SO₄) to the water.
- Allow the mixture to cool to RT.
- Add 50 mg anthrone to the solution.
- Stir until the anthrone is dissolved.
- Add 3 g thiourea to the solution.
- Stir until the thiourea is dissolved.
- Transfer the solution to an amber or foil-wrapped glass bottle.
- Store the solution in a refrigerator (2°C–8°C) for a maximum of one week.
CAUTION: Sulfuric acid is highly corrosive, causes severe chemical burns, and reacts violently with water. Wear a lab coat, chemical-resistant gloves, and a face shield. Perform all steps in a certified chemical fume hood. Dilution generates intense heat. Always add acid to water.
- Prepare 95% ethanol containing 0.1% LiCl
- Add 95 mL absolute ethanol to a glass bottle.
- Add 4.5 mL distilled water.
- Add 0.5 mL of 20% LiCl stock solution.
- Mix thoroughly.
- Prepare 80% methanol containing 0.1% LiCl
- Add 80 mL absolute methanol to a glass bottle.
- Add 19.5 mL distilled water.
- Add 0.5 mL of 20% LiCl stock solution.
- Mix thoroughly.
- Prepare 100% (w/v) trichloroacetic acid (TCA) solution
- Weigh 100 g TCA powder.
- Add the TCA powder to 80 mL distilled water.
- Stir until dissolved.
- Transfer the solution to a 100 mL volumetric flask.
- Bring the volume to exactly 100 mL with distilled water.
- Store the solution in a tightly closed glass bottle at RT.
- Prepare saturated benzoic acid solution
- Add 0.5 g benzoic acid crystals to 100 mL distilled water in a 250 mL glass beaker.
- Heat the mixture to 90°C on a hot plate with continuous magnetic stirring.
- Continue heating until no undissolved particles remain at the base of the vessel.
- Allow the solution to cool to RT.
- Aspirate the clear supernatant that is free of visible particles.
- Store the solution in a tightly sealed glass bottle at RT.
- Prepare glucose standards
- Dissolve 50 mg glucose powder in 50 mL saturated benzoic acid solution to prepare a 1 mg/mL stock solution.
- Prepare glucose standards (0, 0.01, 0.02, 0.05, 0.1, 0.2, 0.5, and 1 mg/mL) in 1.5 mL microcentrifuge tubes by serial dilution with saturated benzoic acid as follows.
- Add 500 µL of 1 mg/mL stock solution to Tube 1 to prepare the 1 mg/mL standard.
- Add 250 µL of stock solution and 250 µL saturated benzoic acid to Tube 2 to prepare the 0.5 mg/mL standard.
- Add 200 µL of Tube 2 solution and 300 µL saturated benzoic acid to Tube 3 to prepare the 0.2 mg/mL standard.
- Add 250 µL of Tube 3 solution and 250 µL saturated benzoic acid to Tube 4 to prepare the 0.1 mg/mL standard.
- Add 250 µL of Tube 4 solution and 250 µL saturated benzoic acid to Tube 5 to prepare the 0.05 mg/mL standard.
- Add 200 µL of Tube 5 solution and 300 µL saturated benzoic acid to Tube 6 to prepare the 0.02 mg/mL standard.
- Add 250 µL of Tube 6 solution and 250 µL saturated benzoic acid to Tube 7 to prepare the 0.01 mg/mL standard.
- Add 500 µL saturated benzoic acid to a separate tube to prepare the blank (0 mg/mL).
- Cap each tube and vortex briefly for 10 s to mix thoroughly.
2. Animal Treatment
- General husbandry
- House male Sprague–Dawley rats (230–270 g) in an animal facility under specific pathogen-free conditions (VAF/Plus health status, Charles River Laboratories), certified free of common rodent pathogens including Sendai virus, Mycoplasma pulmonis, and rat parvoviruses.
- Provide a standard chow diet and allow free access to water.
- Maintain animals on a 12-h light/dark cycle (lights on at 08:00 h and lights off at 20:00 h).
- Maintain RT at 22°C–23°C.
- Maintain relative humidity at 30%–70%.
- Overnight fasting
- Transfer rats into regular housing cages.
- Remove food and provide free access to water.
- Maintain fasting for 16 h from 16:30 to 08:30 the next morning.
- Refeeding
- Provide regular chow food (200 g) to overnight-fasted rats.
- Allow animals to feed ad libitum for 2 h.
- Epinephrine challenge
- Prepare epinephrine hydrochloride solution.
- Weigh 5 mg epinephrine hydrochloride powder using a calibrated analytical balance.
- Transfer the powder to a 15 mL centrifuge tube and add 10 mL saline.
- Cap the tube and invert 10 times to prepare a 0.5 mg/mL stock solution.
- Inject non-fasted rats intraperitoneally with epinephrine hydrochloride solution at a volume of 1 mL/kg body weight (0.5 mg/kg body weight)3.
- Hold the animal in a head-down position to allow abdominal contents to shift cranially.
- Insert a 25-gauge needle into the lower right quadrant of the abdomen at a 45° angle.
- Aspirate to confirm the absence of blood or enteric contents before injection.
- Inject control animals intraperitoneally with saline at a volume of 1 mL/kg.
- Collect tail vein blood samples.
- Hold the rat to expose the tail.
- Compress and warm the tail for 10 s to facilitate blood flow.
- Prick the lateral tail vein 3 cm from the tip using a sterile 25-gauge needle.
- Discard the first drop of blood using clean gauze to avoid tissue fluid contamination.
- Collect the second drop of blood for glucose measurement.
- Measure blood glucose using a glucometer every 15 min for 60 min.
- Calibrate the glucometer according to the manufacturer’s instructions.
- Verify glucometer accuracy monthly using control solutions.
- Store test strips in their original container to prevent moisture exposure.
- Use test strips immediately after removal from the container.
- Insert a test strip into the glucometer to activate the meter automatically.
- Allow the blood sample to enter the strip by capillary action.
- Record the displayed blood glucose value.
- Prepare epinephrine hydrochloride solution.
3. Tissue Harvest
- Euthanasia and preparation
- Euthanize animals by isoflurane overdose. Place animals in an induction chamber and expose them to 5% isoflurane delivered in 100% oxygen at 2 L/min for at least 3 min.
- Verify death by confirming cessation of respiration.
- Confirm loss of corneal reflex and toe pinch reflex.
- Gently touch the cornea using a sterile cotton-tipped applicator to confirm the absence of a blink response.
- Apply a firm squeeze to the webbing between the toes of a hind paw using blunt forceps to confirm the absence of a motor response.
- Place the rat ventral side up on a dissection tray.
- Wet the abdominal skin with 75% ethanol using a spray bottle.
NOTE: Minimize the time between euthanasia and tissue preservation to reduce glycogen degradation caused by postmortem ischemia.
- Liver dissection
- Make a small incision in the skin approximately 1 cm caudal to the xiphoid process.
- Extend the incision toward the sternum.
- Separate the skin from the underlying muscle.
- Perform a bilateral transverse laparotomy by making a 4 cm horizontal incision approximately 1 cm caudal to the xiphoid process and extending laterally toward the left and right subcostal margins to expose the abdominal cavity fully.
- Identify the liver.
- Excise the right median lobe (Figure 2A).
- Weigh the tissue within 1 min.
- Place the tissue in a polypropylene plastic container.
- Snap-freeze the tissue in dry ice.
- Skeletal muscle dissection
- Use the gastrocnemius muscle as the representative specimen because it contains a mixed population of fast- and slow-twitch fibers that reflect the metabolic and contractile characteristics of the hindlimb16.
- Position the rat on its stomach.
- Make a longitudinal skin incision along the posterior aspect of the hindlimb from the popliteal fossa to the calcaneal tuberosity.
- Separate the skin.
- Identify and reflect the biceps femoris and semitendinosus muscles.
- Identify the biceps femoris as the large, laterally positioned muscle covering the upper half of the posterior thigh.
- Identify the semitendinosus as the narrow strap-like muscle running medially along the posterior thigh and inserting near the knee.
- Expose the gastrocnemius muscle.
- Transect the Achilles tendon at its distal insertion on the calcaneus using fine surgical scissors.
- Separate the soleus muscle.
- Free the proximal attachment of the gastrocnemius muscle at the medial and lateral epicondyles of the femur.
- Remove the entire gastrocnemius muscle (Figure 2B).
- Weigh the tissue within 1 min.
- Place the tissue in a polypropylene plastic container.
- Snap-freeze the tissue in dry ice.
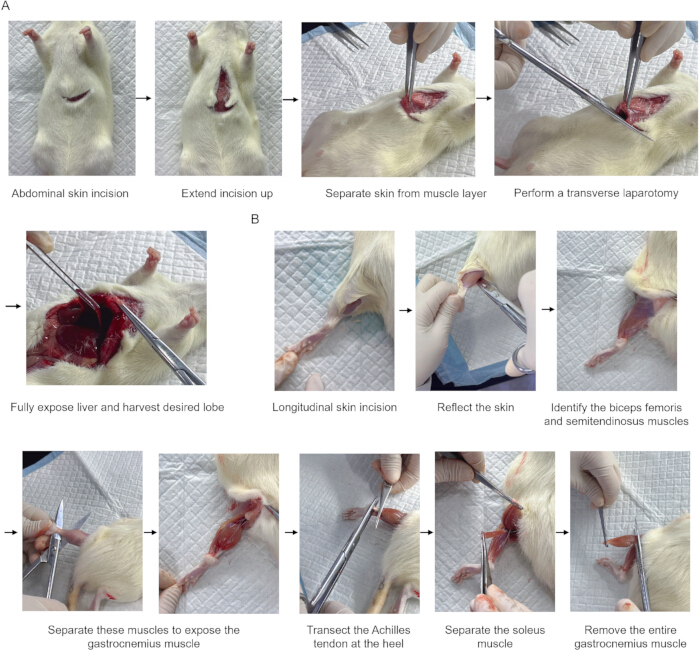
Figure 2: Tissue dissection procedures for liver and skeletal muscle. (A) Sequential steps for exposing the abdominal cavity and harvesting liver tissue, including skin incision, extension of incision, separation of skin from underlying muscle, and transverse laparotomy. (B) Sequential steps for isolating gastrocnemius muscle, including longitudinal incision, reflection of overlying muscles, identification of anatomical structures, and excision of the muscle. Please click here to view a larger version of this figure.
4. Glycogen Colorimetric Assay
- Day 1: Alkaline digestion
- Add 0.4 g tissue to a 50 mL centrifuge tube. A tolerance of ± 0.1 g is permitted to ensure rapid processing and minimize tissue degradation.
- Add 10 mL of 1 M NaOH solution to the tube.
- Mince the tissue using sterile blades or scissors until tissue fragments are approximately 1–2 mm in size.
- Place the tube in a water bath at 95°C ± 5°C.
- Incubate for 30 min.
- Vortex the sample at 2,500 rpm for 10 s every 10 min during incubation.
- Remove the tube from the water bath.
- Allow the sample to cool to RT.
- Preparation of lysate for protein assay
- Transfer 1 mL of alkaline lysate to a microcentrifuge tube using a calibrated P1000 pipettor.
- Centrifuge at 8,000 × g for 10 min.
- Collect the supernatant.
- Reserve the supernatant for BCA protein assay.
- TCA-mediated deproteinization
- Transfer 3 mL of alkaline lysate to a 15 mL centrifuge tube.
- Add 1 mL of 100% (w/v) TCA solution.
- Add 6 mL distilled water to bring the total volume to 10 mL.
- Vortex the mixture at 2,500 rpm for 10 s.
- Place the tube on ice (0°C–4°C).
- Incubate for 1 h to precipitate proteins.
- Collection of deproteinized supernatant
- Transfer 1 mL of the mixture to a microcentrifuge tube.
- Centrifuge at 8,000 × g for 10 min at RT.
- Reserve the supernatant.
- Glycogen precipitation
- Transfer 0.4 mL of the supernatant to a new microcentrifuge tube.
- Add 0.8 mL of 95% ethanol containing 0.1% LiCl.
- Vortex the mixture thoroughly.
- Incubate at RT for 16 h.
- Day 2: Glycogen pelleting
- Centrifuge the sample at 1,000 × g for 15 min at RT to yield a firm, semi-translucent white glycogen pellet (Figure 3A and Figure 3B).
- Discard the supernatant.
- First glycogen wash
- Add 1.5 mL of 80% methanol containing 0.1% LiCl to the pellet.
- Vortex the sample at 2,500 rpm for 10 s.
- Centrifugation after washing
- Centrifuge at 1,000 × g for 5 min at RT.
- Discard the supernatant.
- Second glycogen wash
- Repeat the washing step once.
- Remove any residual liquid by carefully aspirating using a P200 pipettor with a fine tip to ensure the glycogen pellet remains undisturbed.
- Glycogen dissolution
- Add 0.8 mL distilled water to the pellet.
- Vortex at 2,500 rpm until a clear, homogeneous solution without visible particulates is achieved.
- Preparation of standards and samples
- Prepare 1.5 mL microcentrifuge tubes for glucose standards, blank, and unknown samples in triplicate.
NOTE: Add reagents to each tube according to Table 1. - Add 50 µL of each glucose standard to the designated tubes.
- Add 50 µL distilled water to the blank tube.
- Add 50 µL glycogen sample to each unknown sample tube.
- Add 200 µL anthrone reaction solution to each tube.
- Prepare 1.5 mL microcentrifuge tubes for glucose standards, blank, and unknown samples in triplicate.
- Anthrone color development and absorbance measurement
- Vortex all tubes thoroughly.
- Place the tubes in a water bath at 95°C ± 5°C.
- Incubate for 15 min.
- Remove the tubes and allow them to cool to RT.
- Transfer 200 µL from each tube to a 96-well plate.
- Measure absorbance at 620 nm using a microplate reader (endpoint mode, 25°C) with automated pathlength correction to 1 cm.
- The standard curve should have a coefficient of determination (R2) of ≥0.995, as determined by linear regression, to be considered acceptable.
- Any individual standard or sample replicate with a CV% of >20% among triplicate measurements should be considered unreliable and rerun.
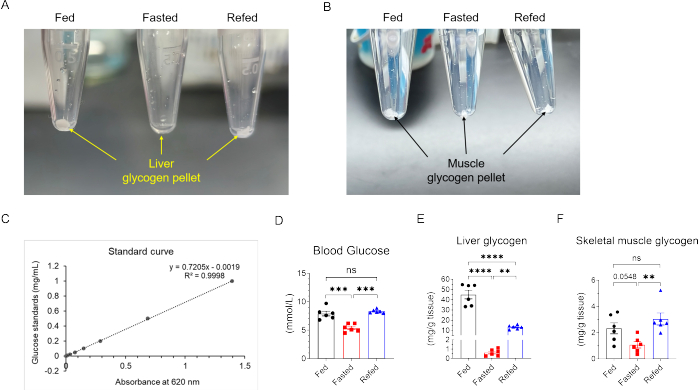
Figure 3: Glycogen isolation and quantification under different nutritional states. (A) Representative image of precipitated glycogen pellets from liver samples under fed, fasted, and refed conditions. (B) Representative image of precipitated glycogen pellets from skeletal muscle samples under fed, fasted, and refed conditions. (C) Standard curve generated from glucose standards showing the linear relationship between absorbance at 620 nm and glucose concentration. (D) Blood glucose levels under fed, fasted, and refed conditions. (E) Hepatic glycogen content under fed, fasted, and refed conditions. (F) Skeletal muscle glycogen content under fed, fasted, and refed conditions. Data are presented as mean ± SEM (n = 6 per group). Statistical analysis was performed using ordinary one-way analysis of variance (ANOVA) with multiple comparisons corrected by the Benjamini–Hochberg method. **p < 0.01, ***p < 0.001, ****p < 0.0001, ns: not significant. Please click here to view a larger version of this figure.
| Reagents | 0 mg/mL | 0.01 mg/mL | 0.02 mg/mL | 0.05 mg/mL | 0.1 mg/mL | 0.2 mg/mL | 0.5 mg/mL | 1 mg/mL | Blank | Unknown Sample |
| Glucose standard solution | 50 µL | 50 µL | 50 µL | 50 µL | 50 µL | 50 µL | 50 µL | 50 µL | – | – |
| Distilled water (H₂O) | – | – | – | – | – | – | – | – | 50 µL | – |
| Glycogen sample | – | – | – | – | – | – | – | – | – | 50 µL |
| Anthrone reaction solution | 200 µL | 200 µL | 200 µL | 200 µL | 200 µL | 200 µL | 200 µL | 200 µL | 200 µL | 200 µL |
Table 1: Reaction setup for glycogen colorimetric assay. Reaction setup for glucose standards, blank, and unknown glycogen samples used in the anthrone colorimetric assay. Defined volumes of glucose standards, distilled water, or glycogen samples were combined with anthrone reaction solution prior to incubation and absorbance measurement.
5. Calculation of Tissue Glycogen Content
NOTE: Normalize measured glycogen to either tissue wet weight or total protein mass.
- Standard curve and concentration determination
- Use absorbance readings from the eight glucose standard tubes.
- Subtract blank values from absorbance readings before plotting them against glucose concentrations.
- Fit a linear regression curve using ordinary least-squares regression in Excel (Figure 3C).
- Calculate the concentration of glucose in each unknown glycogen sample (Cunknown) by interpolating its blank-subtracted absorbance onto the linear standard curve using the regression equation obtained in Step 5.1.3.
- Normalization to tissue wet weight
- Calculate glycogen content using the following equation:

- Define Cunknown as the concentration of glucose (mg/mL) in the unknown glycogen sample determined in Step 5.1.4.
- Define 0.8 as the volume of the dissolved glycogen sample (mL) in Step 4.10.1.
- Define 0.9 as the factor used to convert glucose value to glycogen value.
- Define 2.5 as the dilution factor introduced during glycogen precipitation in Step 4.5.
- Define 10 as the dilution factor accounting for the 1 mL aliquot analyzed from the total 10 mL mixture prepared in Step 4.3.3.
- Define 10/3 as the dilution factor accounting for the 3 mL aliquot used from the total 10 mL alkaline digest prepared in Step 4.1.2.
- Calculate glycogen content using the following equation:
- Normalization to total protein mass
- Calculate glycogen content using the following equation:

- Define Cunknown as the concentration of glucose (mg/mL) in the unknown glycogen sample determined in Step 5.1.4.
- Define 0.8 as the volume of the dissolved glycogen sample (mL) in Step 4.10.1.
- Define 0.9 as the factor used to convert glucose value to glycogen value.
- Define 2.5 as the dilution factor introduced during glycogen precipitation in Step 4.5.
- Define 10 as the dilution factor accounting for the 1 mL aliquot analyzed from the total 10 mL mixture prepared in Step 4.3.3.
- Define 1/3 as the correction factor accounting for the 3 mL aliquot used from the alkaline digest in Step 4.3.1.
- Define protein concentration as the concentration of total protein (mg/mL) in the alkaline digest determined by BCA assay in Step 4.2.4.
- Calculate glycogen content using the following equation:
6. Western Blot of Key Enzymes Catalyzing Glycogen Metabolism
- General considerations
- Refer to previously described protocols for standard western blot procedures17,18.
- Protein extraction
- Weigh 75 mg of snap-frozen tissue. A tolerance of ± 25 mg is permitted to ensure rapid processing and minimize tissue thawing.
- Add 1 mL ice-cold RIPA lysis buffer (50 mM Tris-HCl, pH 7.4; 150 mM NaCl; 1% Triton X-100; 0.5% sodium deoxycholate; 0.1% SDS; and 1 mM EDTA) supplemented with protease and phosphatase inhibitors.
- Homogenize the tissue using a handheld rotor-stator homogenizer.
- Lysate preparation
- Incubate homogenates on ice for 30 min.
- Vortex the samples at 2,500 rpm for 10 s every 10 min during incubation.
- Centrifuge at 10,000 × g using a fixed-angle rotor for 5 min at 4°C.
- Protein quantification
- Collect the supernatant as total protein lysate.
- Perform a BCA assay to determine protein concentration.
- Prepare BSA standards of 0, 0.025, 0.125, 0.25, 0.5, 0.75, and 1 mg/mL diluted in RIPA lysis buffer.
- In a 96-well microplate, load 20 µL of each standard or unknown sample into individual wells.
- Add 200 µL of BCA working reagent (prepared by mixing 50 parts Reagent A with 1 part Reagent B) to each well.
- Incubate the reaction plate at 37°C for 30 min.
- After cooling to RT (18°C–23°C), measure absorbance at 562 nm using a microplate reader (endpoint mode, 25°C) with automated pathlength correction to 1 cm.
- SDS-PAGE
- Mix 15 µg of protein with SDS-PAGE loading buffer.
- Heat the samples at 95°C for 5 min.
- Cool the samples on ice.
- Load the samples onto a 10% SDS-PAGE gel.
- Resolve proteins by electrophoresis in running buffer (25 mM Tris, 192 mM glycine, and 0.1% SDS).
- Run the gel at a constant 100 V until the bromophenol blue dye front reaches the bottom of the gel.
- Protein transfer and blocking
- Transfer proteins to a nitrocellulose or PVDF membrane.
- For nitrocellulose membranes, equilibrate the membrane in transfer buffer (25 mM Tris, 192 mM glycine, 20% methanol, pH 8.3) for 10 min.
- For PVDF membranes, activate the membrane by immersion in 100% methanol for 30 s, then equilibrate in transfer buffer for 10 min.
- Assemble the transfer sandwich in the following order: sponge, filter paper, gel, membrane, filter paper, sponge.
- Perform protein transfer at a constant current of 200 mA for 90 min at 4°C.
- Prepare 3% (w/v) BSA in TBST (20 mM Tris-HCl, pH 7.4; 150 mM NaCl; and 0.1% Tween-20).
- Block the membrane at RT for 1 h with constant rocking.
NOTE: Use BSA instead of non-fat milk when detecting phosphorylated proteins.
- Primary antibody incubation
- Prepare primary antibody solution in blocking buffer at a dilution of 1:1,000.
- Incubate the membrane with primary antibody at 4°C overnight with constant rocking.
- Washing
- Wash the membrane with TBST.
- Repeat washing three times for 10 min each.
- Secondary antibody incubation
- Prepare HRP-conjugated secondary antibody in blocking buffer at a dilution of 1:10,000.
- Incubate the membrane at RT for 1 h with constant rocking.
- Washing
- Wash the membrane with TBST.
- Repeat washing three times for 10 min each.
- Chemiluminescent detection
- Prepare chemiluminescent substrate by mixing equal volumes of the luminol/enhancer and stable peroxide solutions.
- Apply substrate at a volume of 0.1 mL/cm2 membrane surface area and incubate for 2 min at RT on an orbital shaker (100 rpm).
- Capture signals using a chemiluminescent imager.
- Test exposure times ranging from 10 to 300 s and select an exposure within the linear detection range for each blot.
- Verify signal linearity by confirming the absence of pixel saturation using the instrument’s built-in software.
- Image analysis
- Analyze band intensity using ImageJ software (version 1.51, NIH).
- Convert images to 8-bit grayscale and apply rolling-ball background subtraction with a radius of 50 pixels.
- Define each band using a rectangular region of interest of identical dimensions and subtract local background from an adjacent blank area to obtain raw integrated density values.
- Total protein staining
- Incubate the membrane in 0.1% India ink solution in TBST at RT for 1 h with constant rocking.
- Wash the membrane three times for 10 min each with TBST.
- Quantify multiple stained bands as loading controls to normalize immunoblotting signals.
NOTE: Use total protein staining instead of housekeeping genes (HKGs), as HKG expression may vary under different experimental conditions19.
7. Sensitivity and Reproducibility of the Method
- Preparation of glycogen standards
- Prepare a 20 mg/mL glycogen stock solution in 1 M NaOH.
- Prepare a series of glycogen standards (0, 0.005, 0.01, 0.02, 0.05, 0.1, 0.2, 0.5, and 1 mg/mL) in 15 mL centrifuge tubes by stepwise dilution with 1 M NaOH as described below.
- Prepare Tube 1 (1 mg/mL) by mixing 500 µL glycogen stock solution with 9.5 mL of 1 M NaOH.
- Prepare Tube 2 (0.5 mg/mL) by mixing 250 µL glycogen stock solution with 9.75 mL of 1 M NaOH.
- Prepare Tube 3 (0.2 mg/mL) by mixing 100 µL glycogen stock solution with 9.9 mL of 1 M NaOH.
- Prepare Tube 4 (0.1 mg/mL) by mixing 50 µL glycogen stock solution with 9.95 mL of 1 M NaOH.
- Prepare Tube 5 (0.05 mg/mL) by mixing 25 µL glycogen stock solution with 9.975 mL of 1 M NaOH.
- Prepare Tube 6 (0.02 mg/mL) by mixing 10 µL glycogen stock solution with 9.99 mL of 1 M NaOH.
- Prepare Tube 7 (0.01 mg/mL) by mixing 100 µL of Tube 1 solution with 9.9 mL of 1 M NaOH.
- Prepare Tube 8 (0.005 mg/mL) by mixing 50 µL of Tube 1 solution with 9.95 mL of 1 M NaOH.
- Prepare the blank (0 mg/mL) by adding 10 mL of 1 M NaOH to a 15 mL centrifuge tube.
- Cap each tube and vortex at 2,500 rpm for 10 s to mix.
- Anthrone colorimetric assay
- Extract glycogen and perform the anthrone colorimetric assay according to Steps 4.1.4–4.12.6.
- Record absorbance readings at 620 nm (A620).
- Calculation of glycogen concentration
- Generate the glucose standard curve and calculate the concentration of glucose in each standard sample (Cstandard) as specified in Step 5.1.
- Calculate the concentration of glycogen in each standard tube using the following equation:

- Define Cstandard as the concentration of glucose (mg/mL) determined in each standard sample.
- Define 0.8 as the volume of the glycogen sample (mL).
- Define 0.9 as the factor for converting glucose value to glycogen value.
- Define 2.5 as a dilution factor.
- Define 10 as the dilution factor accounting for the 1 mL aliquot analyzed from the total 10 mL mixture prepared in Step 4.3.3.
- Define 1/3 as the correction factor accounting for the 3 mL aliquot used from the alkaline digest in Step 4.3.1.
- Repeat the complete procedure three additional times within one day, for a total of four runs.
- Repeat the four runs across four days, for a total of 16 runs.
- Calculation of LOD and LOQ
- Plot all 16 absorbance readings on the y-axis against each glycogen standard concentration on the x-axis.
- Calculate the linear regression curve and R2. A linear regression with R2 of ≥0.995 is considered acceptable.
- Calculate the LOD and LOQ using the following equations:
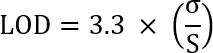
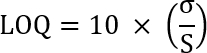
- Define σ as the standard error of the response (y-intercept).
- Define S as the slope of the linear regression curve.
- Calculation of intra-assay and inter-assay CV%
- For each glycogen standard, calculate the intra-assay CV% of the calculated values from the four runs on Day 1 using the following equation:
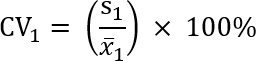
- Define s1 as the standard deviation of values from the four runs on Day 1.
- Define
 as the mean value from the four runs on Day 1.
 - Repeat this calculation for Day 2, Day 3, and Day 4 to obtain CV2, CV3, and CV4.
- Calculate the final intra-assay CV% using the following equation:

- Calculate the inter-assay CV% using the following equation:

- Define sinter as the standard deviation of CV1, CV2, CV3, and CV4.
- Define
 as the mean value of CV1, CV2, CV3, and CV4.
- For each glycogen standard, calculate the intra-assay CV% of the calculated values from the four runs on Day 1 using the following equation:
Access restricted. Please log in or start a trial to view this content.
Results
Hepatic and Skeletal Muscle Glycogen Levels Under Different Nutritional States
Overnight fasting significantly decreased blood glucose levels (mean ± standard error of the mean [SEM]) from 7.9 ± 0.4 mM in ad libitum-fed rats to 5.4 ± 0.3 mM. Blood glucose levels were restored to 8.3 ± 0.1 mM after 2 h of refeeding (Figure 3D). Consistent with these changes, hepatic glycogen levels (mean ± SEM) were 45.05 ± 3.85 mg/g tissue under fed condi...
Access restricted. Please log in or start a trial to view this content.
Discussion
In this article, we describe a modified anthrone colorimetric method for quantifying glycogen in animal tissues. In addition to the conventional sequential steps of tissue harvest, alkaline digestion, glycogen precipitation, alcohol washing, and anthrone-based color development, we incorporated a deproteinization step to reduce background interference (Figure 1). We then applied this method to evaluate changes in glycogen content in the liver and gastrocnemius muscle under distinct physiolog...
Access restricted. Please log in or start a trial to view this content.
Disclosures
The authors declare no conflicts of interest.
Acknowledgements
This work was supported by the National Key R&D Program of China (2022YFA0806103) and the National Natural Science Foundation of China (82270871).
Access restricted. Please log in or start a trial to view this content.
Materials
| Name | Company | Catalog Number | Comments |
|---|---|---|---|
| 1.5 mL microcentrifuge tubes | LABGIC | BS-15-M | Used for sample processing and reaction setup |
| 15 mL microcentrifuge tubes | LABGIC | BS-150-M-S | Used for lysate handling and precipitation steps |
| 20X TBST | Solarbio Life Sciences | T1082 | Buffer for membrane washing in western blot |
| 37 oC Incubator | Shanghai Jinghong Instrument | HWS-150 | BCA assay plate incubation |
| 50 mL centrifuge tubes | LABGIC | CT-112-50A | Used for tissue digestion and extraction |
| 96-well plate | LABGIC | BS-MP-96W-CL | Plate-based absorbance measurement |
| Analytical balance | Changzhou Xingyun | FA2204N | Weigh chemical powders |
| Anthrone | Shanghai Aladdin Biochemical Technology | A108571 | Reagent for glycogen colorimetric detection |
| Anti-GYS1 antibody | Proteintech | 10566-1-AP | Detection of glycogen synthase 1 |
| Anti-GYS2 antibody | Proteintech | 22371-1-AP | Detection of glycogen synthase 2 |
| Anti-phospho-GYS1/2 (Ser641) antibody | Cell Signaling Technology | 47043S | Detection of phosphorylated GYS |
| Anti-phospho-PYGL (Ser15) antibody | Abcam | ab227043 | Detection of phosphorylated glycogen phosphorylase |
| Anti-PYGL antibody | Proteintech | 15851-1-AP | Detection of liver glycogen phosphorylase |
| Anti-PYGM antibody | Novus Biologicals | NBP2-16689 | Detection of muscle glycogen phosphorylase |
| BCA assay kit | Beyotime | P0012 | Protein quantification |
| Benzoic acid | Shanghai Aladdin Biochemical Technology | B116255 | Preparation of saturated solution for standards |
| Blunt forcepts | Shanghai Jinzhong | J42010 | Toe pinching; tissue dissection |
| BSA Fraction V | Beyotime | ST023 | Blocking agent in western blot |
| Chemiluminescent imager | Tanon | Tanon 5200 Multi | Detection of western blot signals |
| Chemiluminescent substrate (ECL) | Beyotime | P0018S | Signal development in western blot |
| Distilled water | Beyotime | ST872 | Solvent for reagent preparation |
| Epinephrine hydrochloride | Sigma-Aldrich | E4642 | Induction of glycogen breakdown in vivo |
| Ethanol | Macklin | E809065 | Glycogen precipitation and washing |
| Fine surgical scissors | Shanghai Jinzhong | JA2601 | Tissue dissection |
| Fresco 17 centrifuge | Thermo Fisher Scientific | 75002402 | Sample centrifugation |
| Glucometer | i-SENS | CareSens N | Measurement of blood glucose |
| Glucometer | i-SENS | CareSens N | Measure tail vein blood glucose level |
| Glucometer strips | i-SENS | CareSens N Strips | Measure tail vein blood glucose level |
| Glucose | Macklin | G6172 | Preparation of standard curve |
| Glycogen stock | Beyotime | D0812 | Preparing a series of glycogen standards |
| Goat anti-rabbit IgG secondary antibody | Thermo Fisher Scientific | 31462 | Detection of primary antibodies |
| Handheld homogenizer | GreenPrima | PB100 | Tissue homogenization |
| India ink | Sigma-Aldrich | 198285 | Total protein staining for normalization |
| Isoflurane | RWD Life Science | R510-22-10 | Animal euthanasia |
| Laboratory heating block | Changzhou Guowang | GWJ300-1 | Sample heating during assays |
| Lithium chloride | Macklin | 767397 | Enhances glycogen precipitation |
| Methanol | Shanghai Aladdin Biochemical Technology | M116115 | Glycogen washing step |
| Microplate reader | BioTek | ELx800 | Measurement of absorbance at 620 nm |
| Nitrocellulose membrane | Millipore | HATF04700 | Protein transfer membrane |
| Orbital shaker | DLAB SCIENTIFIC CO.,LTD | SK-O180-S | chemiluminescent substrate incubation |
| P1000 Pipettor | Thermo Fisher Scientific | 4641100N | Transfer solution |
| P200 Pipettor | Thermo Fisher Scientific | 4641080N | Residual liquid removal |
| Phosphatase inhibitors (PhosSTOP) | Roche | 4906845001 | Preservation of protein phosphorylation |
| Plastic containers (for tissue storage) | Thermo Fisher Scientific | 6A0008 | Storage of harvested tissues |
| Protease inhibitors cocktail | MCE | HY-K0011 | Prevention of protein degradation |
| RIPA lysis buffer | Beyotime | P0013B | Protein extraction |
| SDS-PAGE gel kit | Beyotime | P0012A | Protein separation |
| SDS-PAGE loading buffer (6X) | Beyotime | P0015F | Mix with protien samples before loading into SDS-PAGE gel wells |
| SDS-PAGE running buffer (5x) | Beyotime | P0014D | SDS-PAGE electrophoresis |
| Small Animal Anesthesia Machine | RWD Life Science | R500 | Animal euthanasia |
| Sodium hydroxide | Macklin | S817977 | Tissue digestion and glycogen extraction |
| Sprague-Dawley rats | Charles River Laboratories | Crl: CD(SD) | Experimental animal model |
| Spray bottle | Beyotime | TB6310 | Apply 75% ethanol to animal fur for wetting and disinfection |
| Standard chow diet | Jiangsu-Xietong, Inc. | XTI01ZJ-009 | Rodent maintenance diet |
| Surgical scissors | Shanghai Jinzhong | J22010 | Tissue dissection |
| Syringe (sterile) with 25-gauge needle | Beyotime | FS801 | Intraperitoneal injection and tail vein pricking |
| Thiourea | Shanghai Aladdin Biochemical Technology | T112512 | Stabilizes anthrone reagent |
| Transfer buffer (10x) | Solarbio Life Sciences | D1060 | Protein transfer onto membrane |
| Trichloroacetic acid | Shanghai Yuanye Bio-Technology | W11293 | Protein precipitation |
| Volumetric flasks (100 mL, 1 L) | Shanghai Aladdin Biochemical Technology | V2853 | Preparation of accurate solution volumes |
| Vortex | DLAB SCIENTIFIC CO.,LTD | 8031102000 | Sample mixing |
| Water bath | Jinghong | DK-S26 | Heating samples for reactions |