In 202 adults aged 80 years or older with nonvalvular atrial fibrillation, six-month embolic and minor bleeding rates did not differ significantly across five anticoagulant regimens. Sparse events and treatment-selection imbalance precluded definitive conclusions on comparative safety or effectiveness.
Research Article
Efficacy and Safety of Novel Oral Anticoagulants in Elderly Patients with Non-Valvular Atrial Fibrillation: A Retrospective Cohort Study
In This Article
Summary
Abstract
Adults aged 80 years or older with nonvalvular atrial fibrillation (NVAF) often have competing thromboembolic and bleeding risks, renal impairment, frailty, and dose-selection challenges. This single-center retrospective observational cohort included 202 adults aged 80 years or older who received warfarin (n = 56), edoxaban 60 mg once daily (n = 38), edoxaban 30 mg once daily (n = 41), rivaroxaban 15 mg once daily (n = 35), or rivaroxaban 10 mg once daily (n = 32). Six-month embolic events, International Society on Thrombosis and Hemostasis (ISTH) bleeding categories, other adverse reactions, official-label dose concordance, dynamic risk scores, and serial laboratory measurements were evaluated. Exploratory generalized overlap weighting addressed measured treatment-selection differences. Embolic events occurred in 8 patients and ISTH minor bleeding in 21; neither outcome differed significantly among groups (exact p = 0.846 and p = 0.199, respectively). No ISTH major or clinically relevant non-major bleeding occurred. Other adverse reactions differed overall (p = 0.014), but pairwise estimates were imprecise. Of 146 direct oral anticoagulant recipients, 72 (49.3%) received a baseline dose concordant with the prespecified official-label framework, 72 (49.3%) received a lower-than-label dose, and 2 (1.4%) received a higher-than-label dose. Low event counts and marked treatment-selection imbalance prevented conclusions of equivalence, superiority, or greater safety. The findings require confirmation in larger, prospectively defined cohorts with longer follow-up, predefined label-dose criteria, and stronger control of confounding.
Introduction
Atrial fibrillation (AF) is the most common sustained cardiac arrhythmia in older adults and is associated with ischemic stroke, systemic embolism, disability, hospitalization, and death. Its burden is substantial in China and rises steeply with population aging1,2,3. Vitamin K antagonists remain effective for stroke prevention but require individualized dosing, international normalized ratio (INR) surveillance, and careful management of food, supplement, and drug interactions. Time outside the therapeutic range can reduce benefit and increase harm. Direct oral anticoagulants (DOACs) offer more predictable pharmacokinetics, fewer interactions, and no routine INR-guided dose titration4,5,6,7.
Randomized-trial meta-analyses support DOAC effectiveness in older adults, but precision is limited in the oldest and most clinically complex patients8,9. Adults aged 80 years or older commonly have diminished renal reserve, low body weight, frailty, multimorbidity, prior bleeding, anemia, polypharmacy, and concomitant antiplatelet exposure. These factors affect both prognosis and treatment selection, and very old adults remain underrepresented in many trials and routine-care comparisons10,11,12,13,14,15,16,17.
Stroke and bleeding risks are related and can change during follow-up. The CHA₂DS₂-VASc and HAS-BLED scores provide structured assessments of these competing risks, but they should not be treated as fixed attributes18,19. A high HAS-BLED score is not a reason to withhold anticoagulation; it identifies modifiable risk factors and patients who require closer surveillance. International registry evidence also shows that frailty, renal dysfunction, multimorbidity, and broader clinical complexity contribute to prognosis beyond any single score20,21,22.
Dose selection is a distinct clinical challenge. Edoxaban and rivaroxaban have drug-specific, jurisdiction-specific dose criteria. In Asian practice, the approved rivaroxaban 15/10-mg framework is limited to selected jurisdictions; it should not be generalized to a Chinese cohort for which the 20/15-mg NVAF framework applies. A reduced dose prescribed without an applicable criterion should not be assumed to provide a safety advantage23. Conventional prothrombin time (PT) and activated partial thromboplastin time (APTT) are reagent- and sampling-time-dependent and are not calibrated measures of factor Xa inhibitor exposure24. Bleeding outcomes likewise require standardized definitions that distinguish major bleeding, clinically relevant non-major bleeding, and minor bleeding25,26.
Real-world comparisons are vulnerable to confounding by indication because clinicians appropriately channel patients with lower creatinine clearance, lower body weight, frailty, or prior bleeding toward particular drugs or doses. Propensity weighting can improve balance in measured variables, but residual confounding remains when treatment selection is strongly related to clinical vulnerability27,28,29,30.
This study described six-month clinical and laboratory outcomes across five routinely used anticoagulant regimens in adults aged 80 years or older with NVAF and at least one documented bleeding-risk factor. The objectives were to characterize baseline and dynamic thromboembolic and bleeding risk, assess patient-level dose concordance against an official-label framework appropriate to the study setting, compare recorded embolic events, standardized bleeding categories, and other adverse reactions, and evaluate serial laboratory trajectories. An exploratory generalized overlap-weighting analysis assessed the extent to which measured treatment-selection differences influenced comparative estimates.
Protocol
Study design and setting
This single-center retrospective observational cohort study was conducted at Nantong Haimen District People’s Hospital and included consecutive eligible patients recorded from January 2018 through December 2022. Anticoagulant selection and dosing were determined by treating clinicians during routine care. There was no randomization, protocol-assigned intervention, or modification of treatment for research purposes. Clinical, demographic, medication, laboratory, and outcome data were abstracted from the electronic medical record and clinical laboratory information system. The sample size was the number of consecutive eligible patients available during the predefined study period. All the materials used in this study are listed in the Table of Materials.
Ethical considerations
The study protocol was reviewed and approved by the Ethics Committee of Nantong Haimen District People’s Hospital (approval no. 2024-KY84-01). All procedures complied with the approved protocol and applicable institutional ethical requirements.
Participant identification and eligibility
Eligible patients were aged 80 years or older, had electrocardiographically confirmed AF and echocardiographic findings consistent with NVAF, had an indication for long-term oral anticoagulation, and had at least one documented bleeding-risk factor. A documented bleeding-risk factor did not necessarily imply a validated HAS-BLED score of at least 3. Patients were excluded for moderate-to-severe mitral stenosis, a mechanical prosthetic heart valve, a prolonged indication for combined antithrombotic therapy, active clinically significant bleeding, an active hematologic bleeding disorder, active peptic ulcer disease, severe uncontrolled hypertension, advanced malignancy, severe hepatic dysfunction, renal dysfunction precluding the prescribed regimen, or known hypersensitivity to the prescribed anticoagulant.
Heart failure status was taken from the clinician-documented diagnosis at cohort entry, supported by clinical and archived echocardiographic findings recorded during routine care. Diagnoses were based on information available during 2018–2022; subsequently published heart-failure guidance was not applied retrospectively to redefine baseline diagnoses.
Anticoagulant exposure and dose-label assessment
Patients were categorized by the regimen documented at cohort entry: warfarin, edoxaban 60 mg once daily, edoxaban 30 mg once daily, rivaroxaban 15 mg once daily, or rivaroxaban 10 mg once daily. Warfarin maintenance dosing was individualized to a target INR of 2.0–3.0.
The prespecified edoxaban NVAF framework used 60 mg once daily and a 30-mg once-daily dose when at least one applicable reduction criterion was present: Cockcroft–Gault creatinine clearance (CrCl) 15–50 mL/min, body weight 60 kg or less, or a relevant P-glycoprotein inhibitor. The rivaroxaban framework appropriate to the Chinese study setting used 20 mg once daily when CrCl was greater than 50 mL/min and 15 mg once daily when CrCl was 15–50 mL/min23. The observed 15-mg and 10-mg rivaroxaban regimens were evaluated against this framework; 10 mg once daily was not treated as an approved NVAF label dose in this setting. CrCl was calculated with the Cockcroft–Gault equation using age, sex, recorded body weight, and serum creatinine. Dose concordance was assessed at baseline and at each follow-up visit. DOAC assessments were classified as label-concordant, lower than label, higher than label, or not assessable/outside the label renal range. Warfarin was described as individualized INR-guided therapy and was not included in the DOAC label-concordance denominator. A lower-than-label dose was not interpreted as safer, appropriate, or clinically equivalent solely because no adverse outcome occurred.
Thromboembolic and bleeding-risk assessment
CHA₂DS₂-VASc and HAS-BLED scores were calculated at baseline and at each follow-up assessment from the available clinical information. A HAS-BLED score of 3 or higher identified validated high bleeding risk18,19. Scores were reassessed because renal function, blood pressure, comorbidities, bleeding history, and concomitant medication exposure could change. A high score was interpreted as a prompt to address modifiable risk factors and intensify surveillance, not as an automatic reason to withhold anticoagulation.
Clinical outcomes
Clinical outcomes were assessed over six months. The primary effectiveness outcome was a clinician-confirmed ischemic stroke or transient ischemic attack (TIA) documented in the medical record; these were analyzed collectively as embolic events. Safety outcomes were classified in prose according to ISTH definitions as major bleeding, clinically relevant non-major bleeding, or minor bleeding25,26. Non-bleeding adverse reactions were analyzed separately as gastrointestinal symptoms or dizziness/vertigo and were not combined with bleeding outcomes.
Laboratory follow-up
Longitudinal laboratory data were obtained at baseline, day 3, month 1, month 3, and month 6. Hemoglobin (g/dL), alanine aminotransferase (ALT; U/L), serum creatinine (mg/dL), PT (seconds), and APTT (seconds) were recorded at each assessment. PT and APTT were included to describe routine coagulation-test trajectories. They were not used to quantify factor Xa inhibitor activity or to establish comparative treatment effectiveness or safety because assay response depends on reagent sensitivity and the interval between drug administration and sampling24.
Statistical analysis
Continuous baseline variables were summarized as medians and interquartile ranges (IQRs) and compared among the five groups with Kruskal–Wallis tests. Categorical variables were summarized as numbers and percentages and compared with Pearson chi-square tests or Fisher–Freeman–Halton exact tests when expected counts were sparse. Effect sizes accompanied significance tests: epsilon-squared for Kruskal–Wallis comparisons and Cramer’s V for categorical comparisons. For each clinical outcome, pairwise risk ratios for each DOAC regimen relative to warfarin were reported with 95% confidence intervals (CIs). The Holm procedure controlled multiplicity across the four pairwise comparisons within each outcome. Longitudinal laboratory trajectories were analyzed with mixed-design repeated-measures analysis of variance, using treatment group as the between-participant factor and time as the within-participant factor. Greenhouse–Geisser correction was applied to within-participant effects; partial eta-squared quantified effect size. Within-group Friedman tests served as sensitivity analyses, with Holm adjustment across 25 tests. Baseline-to-month-6 changes were compared among groups with Kruskal–Wallis tests.
An exploratory generalized overlap-weighting analysis addressed measured treatment-selection differences. Multinomial propensity scores included age, sex, body weight, CrCl, Clinical Frailty Scale score, CHA₂DS₂-VASc, HAS-BLED, and concomitant antiplatelet therapy. Absolute pairwise standardized mean differences assessed balance, and the effective sample size characterized retained information. Weighted risks and risk ratios relative to warfarin were estimated with 1,500 treatment-stratified bootstrap resamples. Because substantial residual imbalance could remain, adjusted estimates were not interpreted as causal effects or evidence of equivalence. All tests were two-sided; p < 0.05 denoted statistical significance. Primary analyses were performed with SPSS Statistics, version 28.0.
Results
Cohort characterisitics and dynamic risk
The cohort comprised 56 warfarin recipients, 38 edoxaban 60-mg recipients, 41 edoxaban 30-mg recipients, 35 rivaroxaban 15-mg recipients, and 32 rivaroxaban 10-mg recipients; results are expressed in Tables 1–4 and Supplementary Tables 1–9. The groups differed in body weight, CrCl, frailty, CHA₂DS₂-VASc, antiplatelet use, baseline PT, and baseline APTT (Table S1). Overall, 85 participants (42.1%) had baseline HAS-BLED scores of at least 3; all 202 had CHA₂DS₂-VASc scores of at least 2. CHA₂DS₂-VASc did not change during follow-up. HAS-BLED increased by 1 point in 16 participants, decreased by 1 point in 12, and remained unchanged in 174. At month 6, 92 participants (45.5%) had HAS-BLED scores of at least 3. Complete baseline data and longitudinal risk-score results are reported in Supplementary Tables 1 and 2.
Official-label dose concordance
At baseline, 72 of 146 DOAC recipients (49.3%) received a label-concordant dose, 72 (49.3%) received a lower-than-label dose, and 2 (1.4%) received a higher-than-label dose (Table 2). Among edoxaban recipients, 68 of 79 (86.1%) were label-concordant, 9 received a lower-than-label dose, and 2 received a higher-than-label dose. Among rivaroxaban recipients, 4 of 67 (6.0%) were label-concordant, and 63 received a lower-than-label dose; this included 31 of 35 recipients of rivaroxaban 15 mg and all 32 recipients of rivaroxaban 10 mg. Across 730 DOAC assessments during follow-up, 355 (48.6%) were label-concordant, 359 (49.2%) were lower than label, and 16 (2.2%) were higher than label. Follow-up results are provided in Supplementary Table 3.
Clinical outcomes
Eight participants experienced an embolic event: 3 ischemic strokes and 5 TIAs. Twenty-one participants had bleeding, all classified as ISTH minor; no major or clinically relevant non-major bleeding occurred. Neither embolic events nor minor bleeding differed significantly among groups (Fisher–Freeman–Halton exact p = 0.846 and p = 0.199, respectively; Table 3). Thirty-five participants experienced a non-bleeding adverse reaction: 18 had gastrointestinal symptoms and 17 had dizziness/vertigo. The overall distribution differed among groups (p = 0.014; Cramer’s V = 0.248). Pairwise risk ratios were imprecise; after Holm adjustment, only rivaroxaban 15 mg versus warfarin remained significant for other adverse reactions (risk ratio 0.19, 95% CI 0.05–0.77; adjusted p = 0.027). Detailed phenotypes and all unadjusted pairwise estimates are provided in Supplementary Tables 4 and 5.
Exploratory adjusted analysis
Generalized overlap weighting yielded an effective sample size of 89.9. The maximum absolute pairwise standardized mean difference decreased from 2.04 before weighting to 1.36 after weighting, driven mainly by persistent CrCl imbalance. Weighted point estimates generally favored the DOAC regimens for embolic and bleeding outcomes, but bootstrap CIs were wide and frequently included 1.00 (Supplementary Table 6). These estimates were exploratory and did not support causal or equivalence claims.
Laboratory trajectories
Hemoglobin showed a small time effect (p < 0.001; partial η2 = 0.024), with no treatment-by-time interaction (p = 0.888) or difference in baseline-to-month-6 change; it was not attributed to treatment. ALT, serum creatinine, and PT showed no time effects or interactions. Complete serial values are provided in Supplementary Table 7. APTT showed a small time effect (p = 0.0015; partial η2 = 0.022) and a treatment-by-time interaction (p < 0.001; partial η2 = 0.054; Table 4 and Figure 1). Baseline-to-month-6 APTT change differed among groups (H = 11.52, p = 0.021; ε2 = 0.038), whereas changes in the other four indicators did not (Supplementary Table 8). Within-group sensitivity analyses are reported in Supplementary Table 9. PT and APTT were interpreted descriptively, not as calibrated measures of drug exposure or clinical benefit24.
DATA AVAILABILITY:
All data are provided in the Raw Data Supplementary Package, named “raw data”.
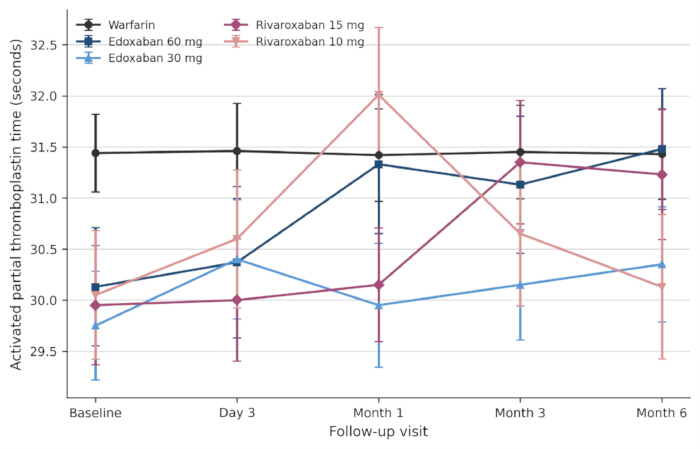
Figure 1: Mean activated partial thromboplastin time across baseline, day 3, month 1, month 3, and month 6 by anticoagulant group. Error bars show 95% CIs. APTT is shown descriptively and is not a calibrated measure of comparative factor Xa inhibitor exposure, effectiveness, or safety. Please click here to view a larger version of this figure.
| Characteristic | Warfarin (n = 56) | Edoxaban 60 mg (n = 38) | Edoxaban 30 mg (n = 41) | Rivaroxaban 15 mg (n = 35) | Rivaroxaban 10 mg (n = 32) | p value |
| Age, years | 85 [83–87] | 86 [83–88] | 86 [83–88] | 85 [83–88] | 84 [82–87] | 0.448 |
| Body weight, kg | 64.8 [56.0–71.7] | 68.4 [64.1–75.4] | 61.5 [55.9–65.8] | 65.7 [61.5–73.9] | 58.1 [53.5–60.5] | <0.001 |
| Cockcroft–Gault CrCl, mL/min | 41.0 [32.1–55.2] | 66.3 [57.2–72.9] | 47.7 [39.7–55.2] | 65.7 [53.4–73.8] | 41.0 [32.8–48.0] | <0.001 |
| Clinical Frailty Scale | 5 [5–6] | 4 [4–5] | 5 [4–5] | 5 [4–6] | 5 [5–6] | <0.001 |
| CHA2DS2-VASc score | 4 [4–5] | 5 [3–6] | 4 [4–6] | 5 [4–5] | 6 [4–6] | 0.040 |
| HAS-BLED score | 2 [2–3] | 2 [2–3] | 2 [2–3] | 2 [2–3] | 2 [2–3] | 0.425 |
| Female sex | 28 (50.0%) | 22 (57.9%) | 27 (65.9%) | 20 (57.1%) | 18 (56.2%) | 0.654 |
| CrCl ≤50 mL/min | 38 (67.9%) | 2 (5.3%) | 23 (56.1%) | 4 (11.4%) | 25 (78.1%) | <0.001 |
| Heart failure | 18 (32.1%) | 18 (47.4%) | 13 (31.7%) | 10 (28.6%) | 15 (46.9%) | 0.265 |
| Hypertension | 24 (42.9%) | 19 (50.0%) | 16 (39.0%) | 12 (34.3%) | 19 (59.4%) | 0.252 |
| Prior stroke/TIA/systemic embolism | 14 (25.0%) | 12 (31.6%) | 15 (36.6%) | 12 (34.3%) | 11 (34.4%) | 0.767 |
| Vascular disease | 14 (25.0%) | 7 (18.4%) | 14 (34.1%) | 8 (22.9%) | 12 (37.5%) | 0.324 |
| Previous clinically important bleeding | 25 (44.6%) | 24 (63.2%) | 23 (56.1%) | 17 (48.6%) | 16 (50.0%) | 0.463 |
| Concomitant antiplatelet therapy | 28 (50.0%) | 14 (36.8%) | 9 (22.0%) | 21 (60.0%) | 9 (28.1%) | 0.003 |
| HAS-BLED ≥3 | 26 (46.4%) | 16 (42.1%) | 14 (34.1%) | 15 (42.9%) | 14 (43.8%) | 0.820 |
Table 1: Baseline demographic and clinical characteristics by anticoagulant group. Values are median [IQR] or n (%). Continuous variables were compared with Kruskal–Wallis tests; categorical variables were compared with Pearson chi-square or Fisher–Freeman–Halton exact tests, as appropriate. Abbreviations: APTT = activated partial thromboplastin time; The CHA₂DS₂-VASc score comprises congestive heart failure, hypertension, age 65–74 (1 point) or age ≥75 (2 points), diabetes, prior stroke/TIA (2 points), vascular disease, and female sex (1 point) to estimate annual stroke risk in non-valvular atrial fibrillation; CrCl = creatinine clearance; HAS-BLED, hypertension, abnormal renal/liver function, stroke, bleeding history, labile INR, elderly age, and drugs/alcohol score; IQR, interquartile range; PT, prothrombin time; TIA, transient ischemic attack.
| Dose assessment characteristic | Edoxaban 60 mg (n = 38) | Edoxaban 30 mg (n = 41) | Rivaroxaban 15 mg (n = 35) | Rivaroxaban 10 mg (n = 32) | DOAC total (n = 146) |
| CrCl label reduction criterion met | 2 (5.3%) | 23 (56.1%) | 4 (11.4%) | 25 (78.1%) | 54 (37.0%) |
| Weight label reduction criterion met | 0 (0.0%) | 16 (39.0%) | Not applicable | Not applicable | 16 (11.0%) |
| Relevant P gp inhibitor criterion met | 0 (0.0%) | 8 (19.5%) | Not applicable | Not applicable | 8 (5.5%) |
| Label concordant dose | 36 (94.7%) | 32 (78.0%) | 4 (11.4%) | 0 (0.0%) | 72 (49.3%) |
| Lower than label dose | 0 (0.0%) | 9 (22.0%) | 31 (88.6%) | 32 (100.0%) | 72 (49.3%) |
| Higher than label dose | 2 (5.3%) | 0 (0.0%) | 0 (0.0%) | 0 (0.0%) | 2 (1.4%) |
Table 2: Official-label dose concordance at baseline. Edoxaban was assessed against 60 mg once daily, reduced to 30 mg once daily for CrCl 15–50 mL/min, body weight 60 kg or less, or a relevant P-glycoprotein inhibitor. Rivaroxaban was assessed against 20 mg once daily for CrCl greater than 50 mL/min and 15 mg once daily for CrCl 15–50 mL/min. Warfarin was individualized by INR and excluded from the DOAC concordance denominator. CrCl, creatinine clearance; DOAC, direct oral anticoagulant; INR, international normalized ratio; P-gp, P-glycoprotein.
| Outcome | Warfarin (n = 56) | Edoxaban 60 mg (n = 38) | Edoxaban 30 mg (n = 41) | Rivaroxaban 15 mg (n = 35) | Rivaroxaban 10 mg (n = 32) | Primary p value |
| Embolic event | 4 (7.1%) | 1 (2.6%) | 1 (2.4%) | 1 (2.9%) | 1 (3.1%) | 0.846 |
| ISTH minor bleeding | 11 (19.6%) | 3 (7.9%) | 3 (7.3%) | 2 (5.7%) | 2 (6.2%) | 0.199 |
| Other adverse reaction | 17 (30.4%) | 8 (21.1%) | 5 (12.2%) | 2 (5.7%) | 3 (9.4%) | 0.014 |
| Gastrointestinal symptoms | 10 (17.9%) | 3 (7.9%) | 2 (4.9%) | 1 (2.9%) | 2 (6.2%) | 0.133 |
| Dizziness/vertigo | 7 (12.5%) | 5 (13.2%) | 3 (7.3%) | 1 (2.9%) | 1 (3.1%) | 0.327 |
Table 3: Six-month clinical outcomes by anticoagulant group. Values are n (%). Primary p values are Fisher–Freeman–Halton exact tests for embolic and bleeding outcomes and Pearson chi-square tests for non-bleeding adverse reactions. All recorded bleeding was ISTH minor; no ISTH major or clinically relevant non-major bleeding occurred. ISTH, International Society on Thrombosis and Haemostasis.
| Laboratory indicator | Effect | Complete n | F | df1 | df2 | p value | Partial eta-squared |
| Hemoglobin, g/dL | Treatment group | 202 | 4.75 | 4.00 | 197.0 | 0.001 | 0.088 |
| Hemoglobin, g/dL | Time | 202 | 4.94 | 3.82 | 751.6 | <0.001 | 0.024 |
| Hemoglobin, g/dL | Treatment × time | 202 | 0.59 | 15.26 | 751.6 | 0.888 | 0.012 |
| ALT, U/L | Treatment group | 202 | 5.14 | 4.00 | 197.0 | <0.001 | 0.095 |
| ALT, U/L | Time | 202 | 0.04 | 3.95 | 778.2 | 0.996 | 0.000 |
| ALT, U/L | Treatment × time | 202 | 0.00 | 15.80 | 778.2 | 1.000 | 0.000 |
| Serum creatinine, mg/dL | Treatment group | 202 | 85.55 | 4.00 | 197.0 | <0.001 | 0.635 |
| Serum creatinine, mg/dL | Time | 202 | 0.03 | 3.91 | 769.5 | 0.998 | 0.000 |
| Serum creatinine, mg/dL | Treatment × time | 202 | 0.02 | 15.62 | 769.5 | 1.000 | 0.000 |
| PT, seconds | Treatment group | 202 | 4309.19 | 4.00 | 197.0 | <0.001 | 0.989 |
| PT, seconds | Time | 202 | 0.93 | 3.88 | 763.6 | 0.446 | 0.005 |
| PT, seconds | Treatment × time | 202 | 0.24 | 15.50 | 763.6 | 0.999 | 0.005 |
| APTT, seconds | Treatment group | 202 | 15.74 | 4.00 | 197.0 | <0.001 | 0.242 |
| APTT, seconds | Time | 202 | 4.48 | 3.91 | 769.6 | 0.002 | 0.022 |
| APTT, seconds | Treatment × time | 202 | 2.80 | 15.63 | 769.6 | <0.001 | 0.054 |
Table 4: Omnibus longitudinal analysis of laboratory indicators. Greenhouse–Geisser-corrected degrees of freedom are shown for time and treatment-by-time effects. Treatment-group main effects represent between-group differences and do not establish treatment-induced change. F, F-statistic; df1, numerator degrees of freedom; df2, denominator degrees of freedom; ALT, alanine aminotransferase; APTT, activated partial thromboplastin time; PT, prothrombin time.
Supplementary Table 1: Complete baseline characteristics. Continuous variables are median [interquartile range] and were compared with Kruskal–Wallis tests. Categorical variables are n (%) and were compared with Pearson chi-square or Fisher–Freeman–Halton exact tests, as appropriate. ALT, alanine aminotransferase; APTT, activated partial thromboplastin time; CrCl, creatinine clearance; PT, prothrombin time; TIA, transient ischemic attack. Please click here to download this file.
Supplementary Table 2: Dynamic CHA₂DS₂-VASc and HAS-BLED assessment through month 6. CHA₂DS₂-VASc was unchanged in all 202 participants. HAS-BLED changed by one point in 28 participants. A score of at least 3 denotes validated high bleeding risk; inclusion in the cohort required at least one documented bleeding-risk factor and did not require HAS-BLED ≥3. Please click here to download this file.
Supplementary Table 3: Official-label dose assessment at baseline and throughout follow-up. Edoxaban was assessed against 60 mg once daily, reduced to 30 mg once daily for CrCl 15–50 mL/min, body weight ≤60 kg, or concomitant use of a relevant P-glycoprotein inhibitor. Rivaroxaban was assessed against 20 mg once daily for CrCl >50 mL/min and 15 mg once daily for CrCl 15–50 mL/min. Warfarin dosing was individualized according to INR and was excluded from the DOAC concordance denominator. CrCl, creatinine clearance; DOAC, direct oral anticoagulant; INR, international normalized ratio; P-gp, P-glycoprotein. Please click here to download this file.
Supplementary Table 4: Detailed clinical event phenotypes. Bleeding events were classified with ISTH definitions. Gastrointestinal symptoms and dizziness/vertigo were non-bleeding adverse reactions and were analyzed separately. ISTH, International Society on Thrombosis and Haemostasis. Please click here to download this file.
Supplementary Table 5: Unadjusted pairwise risk ratios versus warfarin. Risk ratios use the observed six-month patient-level risks. Wald 95% CIs are shown; raw two-sided Fisher exact p values were adjusted with the Holm procedure within each outcome. Wide CIs reflect sparse events and do not establish equivalence. Please click here to download this file.
Supplementary Table 6: Exploratory generalized overlap-weighted risk ratios versus warfarin. Weights used multinomial propensity scores for age, sex, body weight, Cockcroft–Gault CrCl, Clinical Frailty Scale, CHA₂DS₂-VASc, HAS-BLED, and antiplatelet therapy. The effective sample size was 89.9. The maximum absolute pairwise standardized mean difference was 2.04 before and 1.36 after weighting. Bootstrap CIs are exploratory because substantial residual imbalance remained. Please click here to download this file.
Supplementary Table 7: Laboratory indicators at each assessment. Values are mean ± standard deviation. Measurements were complete for all 202 participants at baseline, day 3, month 1, month 3, and month 6 after verification of one source creatinine value. ALT, alanine aminotransferase; APTT, activated partial thromboplastin time; PT, prothrombin time. Please click here to download this file.
Supplementary Table 8: Baseline-to-month-6 laboratory changes by treatment group. Values are mean change ± standard deviation. Between-group comparisons used Kruskal–Wallis tests. ALT, alanine aminotransferase; APTT, activated partial thromboplastin time; PT, prothrombin time. Please click here to download this file.
Supplementary Table 9: Within-group nonparametric longitudinal sensitivity analysis. Friedman tests evaluated change across five assessments. Holm adjustment was applied across 25 tests. Kendall W is the within-group effect size. Please click here to download this file.
Discussion
In this retrospective cohort of adults aged 80 years or older with NVAF, embolic events and ISTH minor bleeding were uncommon over six months and did not differ significantly across five anticoagulant regimens. This absence of statistical significance does not establish equivalence: only 8 embolic events and 21 minor bleeding events occurred, and no major or clinically relevant non-major bleeding event was recorded. The overall difference in non-bleeding adverse reactions also requires caution because of sparse cells, multiple comparisons, and treatment-selection imbalance. The official-label analysis materially changes the interpretation of the observed dose groups. Only 49.3% of DOAC recipients were label-concordant at baseline; nearly all rivaroxaban recipients received a dose below the 20/15-mg NVAF framework applicable to the study setting. The observed rivaroxaban 15-mg and 10-mg groups should therefore not be described as conventional- and low-dose label arms. Off-label dose reduction may reflect frailty, renal concern, prior bleeding, or clinician preference, but it should not be assumed to preserve effectiveness or improve safety23,30,31.
Baseline data showed strong clinical channeling. Reduced-dose groups had lower body weight and CrCl, and frailty and antiplatelet exposure differed. Similar complexities have been reported in very old Asian cohorts and international registries10,11,12,13,14,15,16,17,20,21,22. Overlap weighting reduced some measured imbalance but left substantial CrCl imbalance and a small effective sample size. Residual measured and unmeasured confounding, therefore, remains likely, and the weighted estimates cannot be interpreted causally.
Risk reassessment was clinically informative. Although CHA₂DS₂-VASc was unchanged in all participants, HAS-BLED changed by one point in 28 patients, and the proportion with HAS-BLED of at least 3 increased from 42.1% to 45.5%. This supports periodic reassessment even over six months because renal function, medication exposure, bleeding history, and blood-pressure control can change18,19,20,21,22. The laboratory results do not indicate generalized biochemical deterioration. The small hemoglobin time effect was not treatment-specific. ALT and serum creatinine were stable. The APTT time and interaction effects and the baseline-to-month-6 difference were small and descriptive. Routine PT and APTT are sensitive to reagent and sampling conditions and cannot establish comparative anticoagulant intensity, effectiveness, or safety for factor Xa inhibitors24.
The study should therefore be read as a description of a clinically selected, highly vulnerable cohort rather than a comparative effectiveness trial. Randomized evidence and large observational studies provide a broader context for DOAC use in older adults, but careful translation is needed when renal dysfunction, low body weight, frailty, anemia, antiplatelet exposure, and off-label dosing coexist8,9,10,11,12,13,14,15,16,17,27,28,29,30,31. Drug-specific monitoring and interaction profiles provide an additional framework for interpreting routine-care comparisons. Warfarin effectiveness and bleeding risk depend substantially on the quality and stability of INR control and can be altered by food and drug interactions, whereas DOACs offer more predictable pharmacokinetics but still require drug-specific adjustment for renal function, body weight, and interacting medicines4,5,6,7,23. The present study did not quantify warfarin time in the therapeutic range or calibrated factor Xa inhibitor exposure; therefore, the observed six-month clinical pattern cannot distinguish pharmacologic similarity from differences in achieved exposure, adherence, monitoring quality, or interaction burden24. This distinction is clinically relevant in adults aged 80 years or older, for whom the practical feasibility of INR monitoring, accurate renal-function assessment, medication reconciliation, and repeated follow-up may influence net benefit as much as the nominal agent or dose. The findings thus support an individualized implementation strategy in which regimen selection is linked to measurable exposure, ongoing risk reassessment, and the patient’s capacity for safe monitoring.
Recent evidence further supports interpreting anticoagulant outcomes through the lens of clinical complexity rather than regimen labels alone. Rigutini et al. showed that clinical complexity in atrial fibrillation was associated with higher adjusted risks of all-cause death, major adverse cardiovascular events, cardiovascular death, and major bleeding, while its clinical expression, anticoagulant management, and prognostic impact differed between European and Asian cohorts21. In a separate propensity-matched federated-network cohort of kidney-transplant recipients with atrial fibrillation, Rossi et al. reported lower one-year risk with DOACs than with vitamin K antagonists for a composite of death, thromboembolic events, and major bleeding (HR 0.66, 95% CI 0.50–0.87) and for kidney-transplant rejection (HR 0.46, 95% CI 0.30–0.71), although component estimates were less precise22. The transplant setting is not directly comparable with our non-transplant cohort, but these studies reinforce that renal function, frailty, low body weight, comorbidity burden, bleeding history, and healthcare context should be assessed jointly and longitudinally. In our cohort, pronounced treatment channeling, frequent lower-than-label dosing, and dynamic HAS-BLED changes support this vulnerability-focused interpretation and caution against treating routinely selected dose groups as interchangeable.
This single-center retrospective study had a modest sample and only six months of follow-up, limiting precision for uncommon outcomes, subgroup comparisons, and long-term inference. It was not designed or powered for equivalence or noninferiority. Treatment selection was strongly associated with renal function, body weight, frailty, and bleeding risk. Overlap weighting did not achieve adequate balance, and physician prescribing preferences, adherence changes, and concomitant therapies may have produced residual confounding. Events were identified from routine records rather than through blinded independent adjudication. The model, reagent-lot, and catalog identifiers for routine-care laboratory systems were not retained in the retrospective source records. These limitations preclude conclusions that any observed regimen was safer, equivalent, or superior.
Strengths include complete six-month laboratory follow-up after source verification, repeated dynamic risk-score assessment, standardized ISTH bleeding categories, patient-level label-dose evaluation, exact tests for sparse outcomes, effect sizes, confidence intervals, and multiplicity control. Among 202 adults aged 80 years or older with NVAF, six-month embolic and ISTH minor bleeding rates did not differ significantly across warfarin, edoxaban, and rivaroxaban regimens. Approximately half of DOAC recipients received a baseline dose below the prespecified official-label framework. Low event counts, off-label dosing, marked treatment-selection differences, residual confounding, and short follow-up prevent conclusions of equivalence, superiority, or greater safety. Larger prospective multicenter studies with standardized event adjudication, longitudinal risk reassessment, and predefined jurisdiction-specific label-dose criteria are required.
Disclosures
The authors declare no conflicts of interest.
Acknowledgements
The authors thank the clinical and data-management staff who supported routine care, record maintenance, and follow-up, and the patients whose records contributed to this study.
Materials
| Name | Company | Catalog Number | Comments |
|---|---|---|---|
| Activated partial thromboplastin time reagents | Routine-care reagent lot; identifier not retained | Hospital Clinical Laboratory; manufacturer not retained in retrospective records | |
| Alanine aminotransferase assay reagents | Routine-care reagent lot; identifier not retained | Hospital Clinical Laboratory; manufacturer not retained in retrospective records | |
| Automated coagulation analyzer | Model not retained in retrospective records | Hospital Clinical Laboratory | |
| Blood-collection tubes for coagulation testing | Citrate tubes; lot not retained | Hospital Clinical Laboratory; manufacturer not retained in retrospective records | |
| Blood-collection tubes for hematology and chemistry | EDTA/serum tubes; lots not retained | Hospital Clinical Laboratory; manufacturers not retained in retrospective records | |
| Clinical chemistry analyzer | Model not retained in retrospective records | Hospital Clinical Laboratory | |
| Clinical laboratory information system | Institutional system/version not retained | Nantong Haimen District People’s Hospital | |
| Edoxaban tablets | Clinical formulation/lot not retained | Daiichi Sankyo; dispensed through hospital pharmacy | |
| Echocardiography system | Routine-care archived reports; model not retained | Nantong Haimen District People’s Hospital | |
| Electrocardiography system | Routine-care archived reports; model not retained | Nantong Haimen District People’s Hospital | |
| Electronic medical record system | Institutional system/version not retained | Nantong Haimen District People’s Hospital | |
| Hematology analyzer and hemoglobin assay reagents | Model/reagent lots not retained | Hospital Clinical Laboratory | |
| Prothrombin time reagents | Routine-care reagent lot; identifier not retained | Hospital Clinical Laboratory; manufacturer not retained in retrospective records | |
| Rivaroxaban tablets | Clinical formulation/lot not retained | Bayer AG; dispensed through hospital pharmacy | |
| Routine analyzer consumables and pipette tips | Lots not retained in retrospective records | Hospital Clinical Laboratory; manufacturers not retained in retrospective records | |
| Serum creatinine assay reagents | Routine-care reagent lot; identifier not retained | Hospital Clinical Laboratory; manufacturer not retained in retrospective records | |
| SPSS Statistics | Version 28.0 | IBM | |
| Warfarin tablets | Clinical formulation/lot not retained | Hospital pharmacy; manufacturer not retained in retrospective records |
References
- Salih M, Abdel-Hafez O, Ibrahim R, Nair R. Atrial fibrillation in the elderly population: challenges and management considerations. J Arrhythm. 2021;37(4):912-921.
- Guo Y, Tian Y, Wang H, Si Q, Wang Y, Lip GYH. Prevalence, incidence, and lifetime risk of atrial fibrillation in China: new insights into the global burden of atrial fibrillation. Chest. 2015;147(1):109-119.
- Gómez-Outes A, Suárez-Gea ML, García-Pinilla JM. Causes of death in atrial fibrillation: challenges and opportunities. Trends Cardiovasc Med. 2017;27(7):494-503.
- Zirlik A, Bode C. Vitamin K antagonists: relative strengths and weaknesses vs direct oral anticoagulants for stroke prevention in patients with atrial fibrillation. J Thromb Thrombolysis. 2017;43(3):365-379.
- Hylek EM. Vitamin K antagonists and time in the therapeutic range: implications, challenges, and strategies for improvement. J Thromb Thrombolysis. 2013;35(3):333-335.
- Tan CSS, Lee SWH. Warfarin and food, herbal or dietary supplement interactions: a systematic review. Br J Clin Pharmacol. 2021;87(2):352-374.
- Mekaj YH, Mekaj AY, Duci SB, Miftari EI. New oral anticoagulants: their advantages and disadvantages compared with vitamin K antagonists in the prevention and treatment of patients with thromboembolic events. Ther Clin Risk Manag. 2015;11:967-977.
- Lin DSH, Lo HY, Huang KC, Lin TT, Lee JK. Efficacy and safety of direct oral anticoagulants for stroke prevention in older patients with atrial fibrillation: a network meta-analysis of randomized controlled trials. J Am Heart Assoc. 2023;12(23):e030380.
- Wang X, Wang T, Chen X, et al. Efficacy and safety of oral anticoagulants in older adult patients with atrial fibrillation: pairwise and network meta-analyses. J Am Med Dir Assoc. 2023;24(8):1233-1239.e26.
- Chao TF, Chiang CE, Chan YH, et al. Oral anticoagulants in extremely high-risk, very elderly (>90 years) patients with atrial fibrillation. Heart Rhythm. 2021;18(6):871-877.
- Volgman AS, Nair G, Lyubarova R, et al. Management of atrial fibrillation in patients 75 years and older: JACC state-of-the-art review. J Am Coll Cardiol. 2022;79(2):166-179.
- Polidori MC, Alves M, Bahat G, et al. Atrial fibrillation: a geriatric perspective on the 2020 ESC guidelines. Eur Geriatr Med. 2022;13(1):5-18.
- Bennaghmouch N, de Veer AJWM, Bode K, et al. Efficacy and safety of the use of non-vitamin K antagonist oral anticoagulants in patients with nonvalvular atrial fibrillation and concomitant aspirin therapy. Circulation. 2018;137(11):1117-1129.
- Hinojar R, Jiménez-Natcher JJ, Fernández-Golfín C, Zamorano JL. New oral anticoagulants: a practical guide for physicians. Eur Heart J Cardiovasc Pharmacother. 2015;1(2):134-145.
- Chao TF, Liu CJ, Lin YJ, et al. Oral anticoagulation in very elderly patients with atrial fibrillation. Circulation. 2018;138(1):37-47.
- Chan YH, See LC, Tu HT, et al. Efficacy and safety of apixaban, dabigatran, rivaroxaban, and warfarin in Asians with nonvalvular atrial fibrillation. J Am Heart Assoc. 2018;7(8):e008150.
- Wang CL, Wu VC, Huang YT, et al. Safety and effectiveness of non-vitamin K antagonist oral anticoagulants for stroke prevention in patients with atrial fibrillation and anemia: a retrospective cohort study. J Am Heart Assoc. 2019;8(9):e012029.
- Pisters R, Lane DA, Nieuwlaat R, de Vos CB, Crijns HJGM, Lip GYH. A novel user-friendly score to assess 1-year risk of major bleeding in patients with atrial fibrillation: the Euro Heart Survey. Chest. 2010;138(5):1093-1100.
- Askarinejad A, Bucci T, Tartaglia E, Rossi M, Lip GYH, Haghjoo M. Stroke and bleeding risks in atrial fibrillation are not static but dynamic: a dynamic assessment of CHA2DS2-VASc and HAS-BLED scores in the Iranian Registry of Atrial Fibrillation. J Cardiovasc Electrophysiol. 2026;37(1):110-118.
- Askarinejad A, Bucci T, Tartaglia E, et al. Real-world outcomes of oral anticoagulation in patients with atrial fibrillation at high risk of both bleeding and stroke: observational evidence from three international registries from Middle East, Europe and Asia-Pacific. J Thromb Thrombolysis. 2026;59:574-586.
- Rigutini AG, Bucci T, Rossi M, et al. Clinical complexity in patients with atrial fibrillation: exploring differential risk profiles from European and Asian cohorts. Europace. 2025;27(12):euaf229.
- Rossi M, Tartaglia E, Askarinejad A, et al. Direct oral anticoagulants versus vitamin K antagonist in kidney transplant recipients with atrial fibrillation: a study from a global federated research network. Eur J Intern Med. 2026;147:106751.
- Chao TF, Chan NY, Chan YH, et al. Direct oral anticoagulant dosing in patients with atrial fibrillation: an Asian perspective. JACC Asia. 2023;3(5):707-723.
- Eikelboom JW, Quinlan DJ, Hirsh J, Connolly SJ, Weitz JI. Laboratory monitoring of non-vitamin K antagonist oral anticoagulant use in patients with atrial fibrillation: a review. JAMA Cardiol. 2017;2(5):566-574.
- Schulman S, Kearon C. Definition of major bleeding in clinical investigations of antihemostatic medicinal products in non-surgical patients. J Thromb Haemost. 2005;3(4):692-694.
- Kaatz S, Ahmad D, Spyropoulos AC, Schulman S. Definition of clinically relevant non-major bleeding in studies of anticoagulants in atrial fibrillation and venous thromboembolic disease in non-surgical patients. J Thromb Haemost. 2015;13(11):2119-2126.
- Larsen TB, Skjøth F, Nielsen PB, Kjældgaard JN, Lip GYH. Comparative effectiveness and safety of non-vitamin K antagonist oral anticoagulants and warfarin in patients with atrial fibrillation: propensity weighted nationwide cohort study. BMJ. 2016;353:i3189.
- Hohmann C, Lutz M, Vignali S, et al. Clinical outcomes in patients receiving edoxaban or phenprocoumon for prevention of stroke in atrial fibrillation: a German real-world cohort study. Thromb J. 2022;20(1):37.
- Go AS, Hylek EM, Chang Y, et al. Anticoagulation therapy for stroke prevention in atrial fibrillation: how well do randomized trials translate into clinical practice? JAMA. 2003;290(20):2685-2692.
- Lucà F, Oliva F, Abrignani MG, et al. Management of patients treated with direct oral anticoagulants in clinical practice and challenging scenarios. J Clin Med. 2023;12(18):5955.
- Van Gelder IC, Rienstra M, Bunting KV, et al. 2024 ESC Guidelines for the management of atrial fibrillation developed in collaboration with the European Association for Cardio-Thoracic Surgery (EACTS). Eur Heart J. 2024;45(36):3314-3414.