This study evaluated the effects of organic fertilization and biostimulant applications on fennel under field conditions in Egypt. The highest yields were obtained at 600 L ha⁻1 compost tea combined with Azolla or Spirulina. This treatment enhanced the yield and quality of fennel essential oil.
Research Article
Organic Fertilization and Biostimulants Improve Growth, Yield, and Essential Oil Production in Fennel (Foeniculum vulgare): A Field Study
In This Article
Summary
Abstract
The present study was conducted over two successive seasons (2023/24 and 2024/25) at the Experimental Farm of El-Qassassin Horticultural Research Station, Ismailia Governorate, Egypt, to evaluate the response of fennel (Foeniculum vulgare Mill.) plants to organic fertilization and biostimulant applications. The experiment followed a split-plot design in which three compost tea levels (360, 480, and 600 L ha⁻1) were assigned to the main plots, while five biostimulant treatments (control, Azolla, Spirulina, Nostoc, and Chlorella extracts) were allocated to the subplots, resulting in 15 treatment combinations. Vegetative growth parameters, yield components, essential oil (EO) content, and oil yield per plant and per hectare were assessed. Higher compost tea levels, particularly 600 L ha⁻1 (Ct3), combined with the biostimulants Azolla (F2) or Spirulina (F3), consistently resulted in increased oil yield per plant and per hectare, with Ct3 × F3 achieving the maximum yields (55.58 kg ha⁻1 in the first season and 58.85 kg ha⁻1 in the second season). Principal component analysis supported these findings, indicating that yield improvements were associated with coordinated increases in oil-related traits rather than a single contributing factor. These results indicate that Ct3 combined with F2 or F3 was the most effective treatment for improving oil yield and quality under field conditions.
Introduction
Fennel (F. vulgare Mill.) is a widely cultivated medicinal and aromatic plant valued for its seeds and essential oil, which possess pharmacological, antibacterial, anti-inflammatory, and antioxidant properties1,2,3,4,5. The increasing demand for fennel-derived products in the pharmaceutical, nutraceutical, and food industries places pressure on production systems to enhance yield and oil quality while minimizing environmental impact.
Conventional fennel cultivation relies heavily on mineral fertilizers to achieve high productivity. However, excessive use of synthetic inputs has been associated with long-term sustainability concerns, including reduced microbial activity and soil degradation5. These challenges have driven interest in organic fertilization strategies, particularly compost-based amendments, which improve soil structure, biological activity, and nutrient availability6.
Compost tea, an aerated aqueous extract of mature compost, has emerged as a promising organic amendment due to its content of soluble nutrients, organic acids, and beneficial microorganisms7. Application of compost tea through irrigation systems has been shown to enhance plant growth and nutrient uptake while reducing reliance on chemical fertilizers8. In parallel, aquatic plants and microalgae such as Azolla, Spirulina, Nostoc, and Chlorella have attracted attention as biostimulants because of their high levels of amino acids, phytohormones, vitamins, and minerals7,9,10. Foliar application of these extracts has been reported to improve growth, biomass accumulation, and yield in various horticultural crops8,11,12.
Despite increasing evidence supporting the individual benefits of compost tea and biostimulants, their combined application under field conditions remains insufficiently explored, particularly in medicinal crops such as fennel. Most previous studies have focused on single inputs or controlled environments, leaving uncertainty regarding their interactive effects on vegetative growth, yield components, and essential oil production under commercial cultivation systems.
To address this gap, the present study evaluated the combined effects of four distinct biostimulant extracts and three compost tea application levels on fennel growth, yield, and essential oil production under open-field, drip-irrigated conditions. This study provides a clearly defined field-based approach for integrating soil-applied compost tea with foliar biostimulants and offers insights into sustainable nutrient management strategies applicable to arid and semi-arid regions.
Protocol
This study involved only plant materials and did not include experiments involving humans or animals. Therefore, ethical approval was not required. The research tools used in this protocol are listed in the Table of Materials.
1. Experimental site
The experiment was conducted during the 2023/24 and 2024/25 seasons at the Experimental Farm of El-Qassassin Horticultural Research Station, Ismailia Governorate, Egypt (30°53′ N, 31°56′ E), to evaluate the response of fennel (F. vulgare Mill.) plants to organic fertilization and biostimulant applications. Climatic conditions during the growing period (November–April) were recorded by the Ismailia Meteorological Station. The average minimum and maximum air temperatures ranged from 12–18 °C and 22–30 °C, respectively, while relative humidity ranged from 50%–65%. No extreme weather events were recorded during the experimental periods (Figure 1).
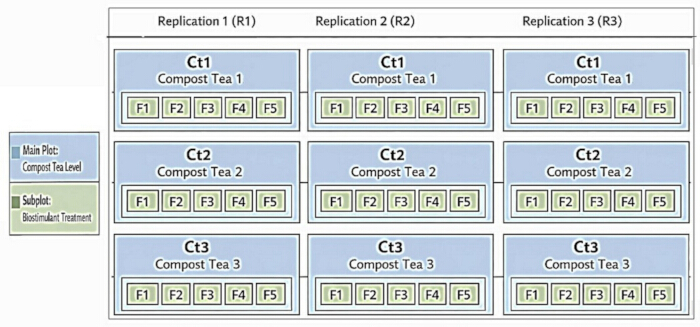
Figure 1: Schematic representation of the split-plot experimental design showing compost tea levels assigned to main plots and biostimulant treatments allocated within subplots across three replications. Ct.1, Ct.2 and Ct.3 represent to 360, 480, and 600 liters per hectare (ha) as soil application, where F.1, F.2, F.3, F.4, and F.5 foliar spray represent 2 cm3/L water for each of Control, Azolla, Spirulina, Nostoc, and Chlorella extracts, respectively. Please click here to view a larger version of this figure.
2. Plant material
Fennel seeds were obtained from the Medicinal and Aromatic Plants Research Department, Horticulture Research Institute, Agricultural Research Center, Dokki, Giza, Egypt. Seeds were sown in nursery beds during the first week of November, and seedlings were later thinned to one plant per hill after establishment.
3. Soil sampling and analysis
Prior to soil preparation, composite soil samples (0–30 cm depth) were collected, air-dried, sieved through a 2 mm sieve, and analyzed for physical and chemical properties using standard protocols13,14 (Table 1).
| Particle size distribution (%) | Textural class | *O.M. (%) | |||||||
| Coarse sand | Fin sand | Silt | Clay | Sandy | 0.48 | ||||
| 80.65 | 14.06 | 3.8 | 1.49 | ||||||
| pH | EC dS/m | SP % | Cations (meq/l) | Anions (meq/l) | |||||
| Ca++ | Mg++ | Na+ | K+ | HCO3- | Cl- | SO4 | |||
| 8 | 0.79 | 28 | 4 | 2.68 | 1.79 | 0.61 | 1.4 | 4.38 | 2.98 |
| *O.M.(%): organic matter | |||||||||
Table 1: Physical and chemical properties of the experimental soil. Features include particle size distribution, textural class, organic matter content, pH, electrical conductivity, saturation percentage, and major cations and anions.
4. Experimental layout
The experiment followed a split-plot randomized complete block design with three replicates. Compost tea levels were assigned to the main plots, and biostimulant treatments to the subplots (Figure 2). Each plot measured 8.4 m2 and contained 24 plants arranged in three rows (4 m in length), with 70 cm between rows and 50 cm between plants within rows.
Drip irrigation was applied using emitters delivering 4 L h⁻1 per hill for 1 h every two days. To prevent interference among treatments, one ridge between plots was left unplanted as a buffer zone.
All plots received 24 t ha⁻1 compost during soil preparation two weeks prior to planting. Mineral fertilizers were applied at 50% of the recommended dose (RD): 360 kg ha⁻1 ammonium sulfate (20.6% N), 240 kg ha⁻1 calcium superphosphate (15.5% P₂O₅), and 120 kg ha⁻1 potassium sulfate (48% K₂O). Nitrogen and potassium fertilizers were applied in three equal doses at 15-day intervals, whereas phosphorus fertilizer was applied as a single basal dose. Standard agronomic practices were followed throughout the growing period.
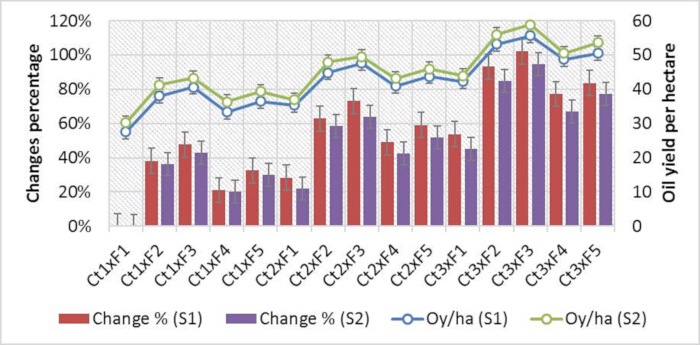
Figure 2: Oil yield per hectare (kg ha⁻1) and its relative increase compared to the control treatment (T1: Ct1 × F1) during the first (S1) and second (S2) seasons. Ct1 represents the lowest compost tea level (360 L ha⁻1), and F1 represents the unsprayed control. Treatments are defined as follows: T1 (Ct1 × F1), T2 (Ct1 × F2), T3 (Ct1 × F3), T4 (Ct1 × F4), T5 (Ct1 × F5), T6 (Ct2 × F1), T7 (Ct2 × F2), T8 (Ct2 × F3), T9 (Ct2 × F4), T10 (Ct2 × F5), T11 (Ct3 × F1), T12 (Ct3 × F2), T13 (Ct3 × F3), T14 (Ct3 × F4), and T15 (Ct3 × F5). Error bars represent standard errors of the mean (SEM). Please click here to view a larger version of this figure.
5. Compost tea treatments
Mature plant-based compost was aerobically extracted in freshwater for 24–48 h. The resulting compost tea had an electrical conductivity of 1.2–1.6 dS m⁻1 and a slightly alkaline pH (7.5–8.0). Compost tea was applied via drip irrigation at rates of 360, 480, or 600 L ha⁻1 over a 16-week period, beginning one month after sowing.
6. Biostimulant preparation and application
Fresh biomass of Azolla caroliniana, Spirulina platensis, Nostoc muscorum, and Chlorella vulgaris was homogenized in distilled water at a ratio of 1:10 (w/v), filtered, and diluted to a final concentration of 2 cm3 L⁻1 (approximately 1200 L ha⁻1). Extracts were freshly prepared before application and applied as foliar sprays three times during the growing season (30, 60, and 90 days after planting) using a hand sprayer until runoff.
7. Data recorded
Vegetative growth parameters
Six randomly selected plants from each experimental unit were harvested 65 days after planting. Plant height (cm) was measured from the base to the tip of the main stem. Total herb fresh weight (g) and dry weight (g) were recorded, with dry weight determined after oven-drying samples at 70 °C for 48 h until constant weight. The number of branches per plant was calculated as the average number across the sampled plants.
Extraction of essential oil (EO)
Essential oil was extracted from 40 g of harvested fruits using hydro-distillation for 3 h, following the method described by Miller15. The extracted oil was allowed to stand undisturbed to ensure complete separation16.
Determination of essential oil content and yield
Essential oil content (% w/w) was calculated as:

Where:
WEO = weight of extracted essential oil (g)
Wsample = dry weight of the plant sample subjected to hydro-distillation (g)
Essential oil yield per plant was calculated as:

Where:
DWplant = dry weight of the whole herb per plant (g)
EO content = essential oil percentage on a dry weight basis (% w/w)
Note: Essential oil density was assumed to be approximately 1 g cm⁻3, allowing conversion from grams to cubic centimeters.
Essential oil yield per hectare was calculated as:

Where:
EO yieldplant - 1= essential oil yield per plant (cm3)
Nplants = number of plants per hectare
1000 = conversion factor from cm3 to L
Note: All oil yield calculations were based on dry matter to avoid variability associated with plant moisture content.
Yield attribute
The number of umbels per plant was recorded at the fruit-ripening stage by counting all umbels on each plant.
8. Statistical analysis
For each trait and season, replicate-level observations were tested for normality using the Shapiro–Wilk test. As no significant deviations from normality were observed (p > 0.05), parametric analysis was applied. Data were analyzed using analysis of variance (ANOVA) for a split-plot design with Statistix 8.1 (Analytical Software, 2008), and treatment means were compared using the least significant difference (LSD) test17.
Principal component analysis (PCA) was conducted as a multivariate tool to summarize relationships among measured traits. Eigenvalues were used to determine the relative contribution of each component, and biplot visualization was used to compare treatments and trait associations18.
Results
Shapiro–Wilk tests indicated that the distributions of all measured variables did not deviate significantly from normality in either season (p > 0.05). Analysis of variance revealed that the interaction between compost tea level (Ct) and foliar biostimulant treatment (F) significantly affected vegetative growth traits, umbel number, and oil-related traits (oil percentage, oil yield per plant, and oil yield per hectare) in both growing seasons.
Yield response relative to the control treatment
In the first season (Figure 2), oil yield per hectare (Oy ha⁻1) increased progressively with increasing compost tea level. All Ct3 (600 L ha⁻1) treatments produced higher oil yields than the control treatment (T1: Ct1 × F1, 360 L ha⁻1 without foliar spray). The highest oil yield (55.58 kg ha⁻1) was obtained from Ct3 combined with Spirulina at 2 cm3 L⁻1 (T13), which significantly exceeded the control and all Ct1 treatments, surpassing the LSD value (2.93 kg ha⁻1). Relative to the control, this treatment showed a marked increase in oil yield per hectare (Figure 3).
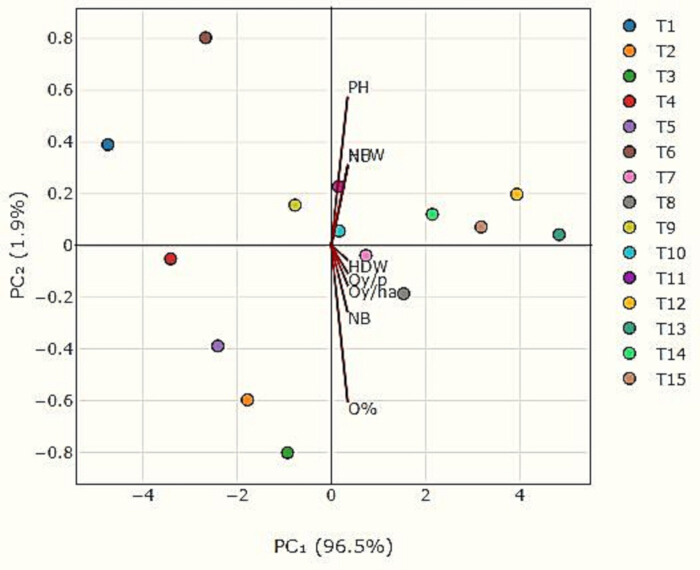
Figure 3: Biplot principal component analysis for the fifteen interacting treatments, based on the four vegetative traits, number of umbels per plant, and the three oil-related traits, using first and second components; a treatment is represented by each dot. Location inside the plot shows the degree of similarity or difference between the treatments according to the input factors (8 growth and oil characteristics); the closer together, the more similar, and the farther apart, the more distinct. PH: plant height (cm), NB: number of branches/plant, HFW: total herb fresh weight (g), HDW: total herb dry weight (g), O%: Essential oil content, Oy/p: oil yield per plant (cm3), Oy/ha: oil yield per hectare (L) and NU: Umbels number/plant T1 (Ct1 × F1), T2 (Ct1 × F2), T3 (Ct1 × F3), T4 (Ct1 × F4), T5 (Ct1 × F5), T6 (Ct2 × F1), T7 (Ct2 × F2), T8 (Ct2 × F3), T9 (Ct2 × F4), T10 (Ct2 × F5), T11 (Ct3 × F1), T12 (Ct3 × F2), T13 (Ct3 × F3), T14 (Ct3 × F4), and T15 (Ct3 × F5). Please click here to view a larger version of this figure.
Similar trends were observed for oil yield per plant and number of umbels, indicating that treatments producing higher oil yield per hectare were also associated with greater reproductive output and biomass accumulation. These relationships are presented as statistical associations among measured traits without inferring causal mechanisms.
In the second season, Ct3 × F3 (T13) again produced the highest oil yield per hectare (58.85 kg ha⁻1), significantly exceeding the control and most Ct2 treatments (LSD = 3.17 kg ha⁻1). The ranking of treatments relative to the control was largely consistent across seasons, indicating reproducible treatment effects under the tested environmental conditions.
Principal component analysis (PCA)
Principal component analysis was applied as an exploratory tool to summarize multivariate relationships among the eight measured traits across the 15 treatments. The first two principal components explained 98.4% of the total variance, with PC₁ accounting for 96.5% and PC₂ for 1.9% (Table 2; Figure 4). The dominance of PC₁ reflects strong covariance among growth- and yield-related traits in the dataset rather than distinct underlying biological processes.
| Parameter | PC1 | PC2 | PC3 | PC4 |
| NU | 0.3516 | 0.3064 | -0.3732 | 0.772 |
| O% | 0.349 | -0.6068 | -0.1873 | -0.0634 |
| Oy/p | 0.3591 | -0.11 | -0.0028 | -0.0974 |
| Oy/ha | 0.3583 | -0.1579 | -0.1046 | -0.2021 |
| PH | 0.3476 | 0.5757 | 0.3834 | -0.3296 |
| NB | 0.3495 | -0.26 | 0.7504 | 0.3693 |
| HFW | 0.3551 | 0.3138 | -0.1821 | -0.1535 |
| HDW | 0.358 | -0.0575 | -0.2675 | -0.2847 |
| Eigenvalue | 7.7201 | 0.1518 | 0.0721 | 0.0346 |
| % of Variance | 96.5 | 1.9 | 0.9 | 0.43 |
| Cumulative (%) | 96.5 | 98.4 | 99.3 | 99.73 |
| PH: plant height (cm), NB: number of branches/plant, HFW: total herb fresh weight (g), HDW: total herb dry weight (g), O%: Essential oil content, Oy/p: oil yield per plant (cm³), Oy/ha: oil yield per hectare (L) and NU: Umbels number/plant | ||||
Table 2: Eigenvalues, eigenvectors, percentage variance, and cumulative variance of the first four principal components based on eight growth and oil-related traits across 15 treatment combinations. Trait abbreviations are as follows: PH (plant height, cm), NB (number of branches per plant), HFW (herb fresh weight, g), HDW (herb dry weight, g), O% (essential oil content), Oy/p (oil yield per plant, cm3), Oy/ha (oil yield per hectare, L), and NU (number of umbels per plant).
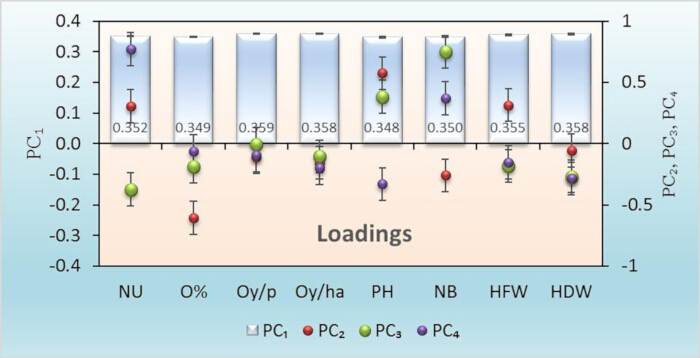
Figure 4: Loading plot of Eigen vector for 8 studied traits treated with the 15 interacted treatments: PC₁ bars use the left axis; PC₂, PC₃, PC₄ use distinct point shapes and colors on the right axis. PH: plant height (cm), NB: number of branches/plant, HFW: total herb fresh weight (g), HDW: total herb dry weight (g), O%: Essential oil content, Oy/p: oil yield per plant (cm3), Oy/ha: oil yield per hectare (L) and NU: Umbels number/plant. Error bars represent standard errors of the mean (SEM). Please click here to view a larger version of this figure.
All traits showed strong and similar positive loadings on PC₁, including number of umbels, oil percentage, oil yield per plant, oil yield per hectare, plant height, number of branches, herb fresh weight, and herb dry weight (Table 2; Figure 5). Accordingly, PC₁ can be interpreted as a general productivity gradient summarizing variation in biomass and oil yield traits across treatments. PC₂ explained only a small proportion of the variance and contributed limited additional discrimination among treatments.
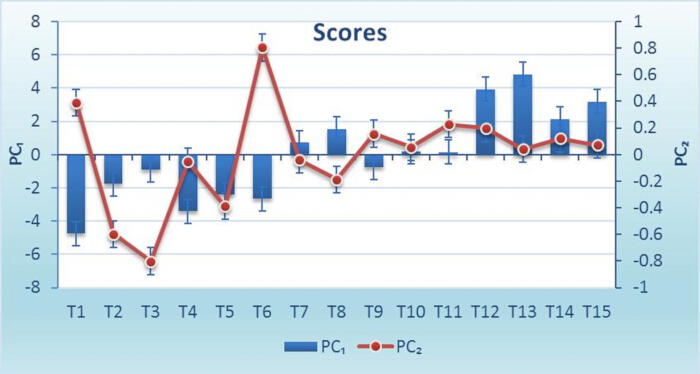
Figure 5: PCA score plot illustrating the distribution of 15 treatment combinations based on the measured traits. Treatments are defined as follows: T1 (Ct1 × F1), T2 (Ct1 × F2), T3 (Ct1 × F3), T4 (Ct1 × F4), T5 (Ct1 × F5), T6 (Ct2 × F1), T7 (Ct2 × F2), T8 (Ct2 × F3), T9 (Ct2 × F4), T10 (Ct2 × F5), T11 (Ct3 × F1), T12 (Ct3 × F2), T13 (Ct3 × F3), T14 (Ct3 × F4), and T15 (Ct3 × F5). Error bars represent standard errors of the mean (SEM). Please click here to view a larger version of this figure.
PCA scores and comparison with the control
Treatments with high positive PC₁ scores (notably T13, T12, T15, and T14) also exhibited the greatest percentage increases relative to the control (T1) across most traits (Figure 5 and Figure 6). For example, T13 showed increases of 94.44% in the number of umbels and 98.18% in oil yield per hectare compared with the control.
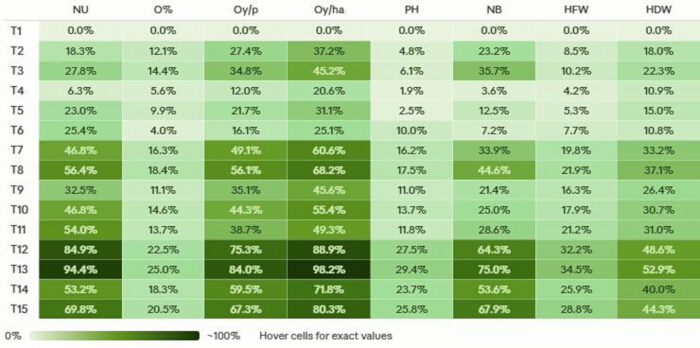
Figure 6: Relative percentage increases of the measured traits compared to the control treatment (T1: Ct1 × F1). Treatments are defined as follows: T1 (Ct1 × F1), T2 (Ct1 × F2), T3 (Ct1 × F3), T4 (Ct1 × F4), T5 (Ct1 × F5), T6 (Ct2 × F1), T7 (Ct2 × F2), T8 (Ct2 × F3), T9 (Ct2 × F4), T10 (Ct2 × F5), T11 (Ct3 × F1), T12 (Ct3 × F2), T13 (Ct3 × F3), T14 (Ct3 × F4), and T15 (Ct3 × F5). Please click here to view a larger version of this figure.
Treatments with intermediate PC₁ scores (e.g., T8 and T10) showed moderate improvements over the control, whereas treatments with negative PC₁ scores, including the control and other Ct1 combinations, exhibited minimal relative changes. These patterns indicate that PC₁ scores were closely aligned with baseline-adjusted treatment responses, reinforcing the univariate ANOVA results. However, PCA was used strictly for data reduction and visualization of multivariate patterns and does not replace inferential statistical testing.
Trait associations in the PCA biplot
The PCA biplot (Figure 4) illustrates close associations among oil yield per plant, oil yield per hectare, and herb dry weight, reflecting strong correlations among these variables. Plant height, herb fresh weight, and number of umbels also displayed similar vector orientations, indicating coordinated variation among these traits within the dataset. The number of branches showed partial separation from other yield components, suggesting weaker associations under the present experimental conditions. These relationships describe observed correlations only and do not imply mechanistic linkages.
Treatments (T12–T15) receiving compost tea at 600 L ha⁻1 combined with foliar biostimulants showed superior multivariate performance across growth and oil traits. In contrast, treatments (T7–T11) exhibited comparatively lower values for most evaluated parameters. Treatments positioned in the opposite direction of most vectors, such as Ct1 (360 L ha⁻1) without foliar spray or combined with Nostoc, were associated with lower values for most measured traits.
Overall, PCA provided a concise multivariate summary that complements ANOVA by illustrating how treatments differed from the control across multiple traits simultaneously. The consistency between PCA patterns and baseline-adjusted univariate results supports the robustness of treatment effects without extending interpretation beyond the measured variables.
DATA AVAILABILITY:
The raw data for this manuscript are available within the supplementary files.
Supplementary Table 1: Raw experimental data for the results. Please click here to download this file.
Discussion
The present study demonstrates that increasing compost tea levels significantly improved fennel growth, reproductive traits, and essential oil productivity over two growing seasons, particularly when combined with specific foliar biostimulants.
Higher compost tea levels (Ct3) increased umbel number and oil yield, consistent with previous findings that organic liquid amendments enhance plant vigor and nutrient availability, thereby improving reproductive performance6,11. Similar improvements in yield and essential oil content have been reported in fennel and other Apiaceae species following the application of compost extracts or biofertilizers, suggesting that these responses reflect general improvements in plant growth conditions rather than crop-specific effects8,19.
The enhanced performance observed with combined applications of compost tea and Azolla (F2) or Spirulina (F3) is consistent with earlier studies reporting that algal and cyanobacterial extracts promote biomass accumulation, flowering, and secondary metabolite production11,20. The greater response observed in the present study, particularly for oil yield per hectare, may be attributed to the combined soil-and-foliar application strategy rather than to the use of individual inputs.
The concurrent increases in oil yield, umbel number, and vegetative growth indicate that yield enhancement resulted from coordinated improvements across multiple traits rather than a single factor. This pattern aligns with previous research suggesting that organic amendments can enhance photosynthetic capacity, root activity, and nutrient use efficiency, thereby supporting both biomass accumulation and reproductive development6,8.
Although physiological and biochemical parameters such as nutrient uptake rates, endogenous hormone levels, and microbial activity were not measured in this study, previous research provides plausible explanations for the observed responses. Compost tea is known to supply readily available nutrients and biologically active compounds, while algal- and cyanobacterial-based biostimulants have been associated with enhanced metabolic activity and stress tolerance11,19. These interpretations are based on existing literature and do not represent direct measurements from the present study.
The PCA results indicate that oil yield per hectare and per plant were the primary contributors to treatment differentiation, supporting the findings from the univariate analysis. Treatments receiving 600 L ha⁻1 compost tea combined with foliar biostimulants consistently occupied favorable positions along the primary productivity axis. Similar PCA applications in agronomic studies have shown that yield-related traits often load strongly on the first principal component, reflecting integrated plant responses rather than independent effects20.
PCA was used in this study as an exploratory tool to describe associations among measured variables and not to infer causality. The alignment between PCA scores and relative improvements over the control strengthens confidence in the observed treatment effects while remaining within the limits of the measured data.
The findings indicate that combining compost tea with selected foliar biostimulants can be an effective agronomic approach for enhancing fennel growth and essential oil production under field conditions. However, the lack of direct measurements of microbial activity, hormonal regulation, and nutrient dynamics limits mechanistic interpretation. Future studies incorporating physiological, biochemical, and soil biological analyses would provide a more comprehensive understanding of the processes underlying these responses.
Overall, this study contributes to understanding how compost tea and biostimulants interact to influence fennel growth and oil yield by integrating univariate statistical analysis with multivariate pattern analysis and situating the findings within the broader literature.
Conclusion
Application of compost tea at 600 L ha⁻1 over 16 weeks, combined with foliar application of Spirulina extract at 2 cm3 L⁻1, resulted in the highest fennel yield and essential oil production under the conditions of this study. Azolla extract showed comparable effects and may serve as an alternative biostimulant. Future research should evaluate the potential to reduce mineral fertilizer inputs while maintaining a baseline compost application rate of 24 t ha⁻1. Standardization of compost tea properties, including pH, electrical conductivity, and nutrient composition, is recommended to ensure consistency across applications. Monitoring vegetative growth, essential oil content, and yield, supported by multivariate analysis such as PCA, may improve the evaluation of treatment responses under field conditions.
Disclosures
The authors declare no conflicts of interest.
Acknowledgements
The authors would like to acknowledge the Deanship of Graduate Studies and Scientific Research, Taif University for funding this work.
Materials
| Name | Company | Catalog Number | Comments |
|---|---|---|---|
| Fennel seeds (Foeniculum vulgare Mill.) | Medicinal and Aromatic Plants Research Department, Horticulture Research Institute, ARC, Egypt | N/A | Seeds used for field experiment |
| Plant-based compost | Local commercial supplier / experimental farm source | N/A | Used for compost tea preparation and basal soil amendment |
| Compost tea | Prepared according to experimental protocol | N/A | Aerated aqueous extract of mature compost |
| Azolla caroliniana biomass | Water and Environment Research Institute, Agricultural Research Center, Giza, Egypt | N/A | Used for foliar extract preparation |
| Spirulina platensis biomass | Water and Environment Research Institute, Agricultural Research Center, Giza, Egypt | N/A | Used for foliar extract preparation |
| Nostoc muscorum biomass | Water and Environment Research Institute, Agricultural Research Center, Giza, Egypt | N/A | Used for foliar extract preparation |
| Chlorella vulgaris biomass | Water and Environment Research Institute, Agricultural Research Center, Giza, Egypt | N/A | Used for foliar extract preparation |
| Distilled water | Water and Environment Research Institute, Agricultural Research Center, Giza, Egypt | N/A | Used for extract preparation |
| Ammonium sulphate (20.6% N) | Ministry of Agriculture and Land Reclamation, Egypt | N/A | Mineral fertilizer source |
| Calcium superphosphate (15.5% P2O5) | Ministry of Agriculture and Land Reclamation, Egypt | N/A | Mineral fertilizer source |
| Potassium sulphate (48% K2O) | Ministry of Agriculture and Land Reclamation, Egypt | N/A | Mineral fertilizer source |
| Drip irrigation emitters (4 L h-1) | Medicinal and Aromatic Plants Research Department, Horticulture Research Institute, ARC, Egypt | N/A | Irrigation system |
| Hand sprayer | Medicinal and Aromatic Plants Research Department, Horticulture Research Institute, ARC, Egypt | N/A | Used for foliar application |
| Drying oven | Medicinal and Aromatic Plants Research Department, Horticulture Research Institute, ARC, Egypt | N/A | Oven maintained at 70 °C |
| Hydro-distillation apparatus | Medicinal and Aromatic Plants Research Department, Horticulture Research Institute, ARC, Egypt | N/A | Used for essential oil extraction |
| Analytical balance | Medicinal and Aromatic Plants Research Department, Horticulture Research Institute, ARC, Egypt | N/A | Used for sample weighing |
| 2 mm sieve | Medicinal and Aromatic Plants Research Department, Horticulture Research Institute, ARC, Egypt | N/A | Used for soil preparation |
| Statistix 8.1 software | Analytical Software | Version 8.1 | Used for ANOVA and statistical analysis |
References
- Ozbek H, et al. Hepatoprotective effect of Foeniculum vulgare. essential oil. Fitoterapia. 2003;74:317–319. https://doi.org/10.1016/S0367-326X(03)00028-5
- Choi EM, Hwang JK. Antiinflammatory, analgesic and antioxidant activities of the fruit of Foeniculum vulgare. Fitoterapia. 2004;75:557–565. https://doi.org/10.1016/j.fitote.2004.05.005
- Singh G, et al. Chemical constituents, antifungal and antioxidative potential of Foeniculum vulgare. volatile oil and its acetone extract. Food Control. 2005;17:745–752. https://doi.org/10.1016/j.foodcont.2005.03.010
- Cioanca O, et al. Essential oils from Apiaceae as valuable resources in neurological disorders: Foeniculi vulgare aetheroleum. Ind Crops Prod. 2016;88:51–57. https://doi.org/10.1016/j.indcrop.2016.02.064
- Saleem F, et al. Phenolic bioactives and associated antioxidant and anti-hyperglycemic functions of select species of Apiaceae family targeting type 2 diabetes nutraceuticals. Ind Crops Prod. 2017;107:518–525. https://doi.org/10.1016/j.indcrop.2017.06.023
- Safaei Z, et al. The effect of foliar application of humic acid and nanofertilizer on yield and yield components of black cumin (Nigella sativa. L.). J Med Plants Byproducts. 2014;3:133–140. https://doi.org/10.22092/JMPB.2014.108725
- Radhakrishnan S, et al. Nutritional profile of Spirulina platensis, Chlorella vulgaris, and Azolla pinnata. as novel protein sources for aquaculture feed formulation. Austin J Aquac Mar Biol. 2017;2(1):1–8.
- Pérez-Madruga Y, et al. Algae as a natural alternative for crop production. Cultivos Tropicales. 2020;41(2).
- Anvar AA, Nowruzi B. Bioactive properties of Spirulina.: A review. Microb Bioact. 2021;4:134–142. https://doi.org/10.25163/microbbioacts.412117
- Thangaraj M, et al. Phytochemicals of algae (Arthospira platensis, Chlorella vulgaris, and Azolla pinnata.). GSC Biol Pharm Sci. 2022;19(2):23–43. https://doi.org/10.30574/gscbps.2022.19.2.0167
- Chatterjee A, et al. Role of algae as a biofertilizer. In: Algal Green Chemistry: Recent Progress in Biotechnology. 2017:189–200. https://doi.org/10.1016/B978-0-444-63784-0.00010-2
- Yanni YG, et al. Differential response of cotton growth, yield and fiber quality to foliar application of Spirulina platensis. and urea fertilizer. Asian J Adv Agric Res. 2020;12:29–40.
- Page AL, et al. Methods of Soil Analysis. Part 2: Chemical and Microbiological Properties. Madison (WI): SSSA; 1982:39–41.
- Klute A. Methods of Soil Analysis. Part 1: Physical and Mineralogical Methods. 2nd ed. Madison (WI): ASA; 1986.
- Miller LC. The British Pharmacopoeia 1963. J Pharm Pharmacol. 1963;15:766–768. https://doi.org/10.1111/j.2042-7158.1963.tb12872.x
- United States Pharmacopeia (USP). United States Pharmacopeia. Convention Inc.; 1995.
- Gomez KA, Gomez AA. Statistical Procedures for Agricultural Research. New York: John Wiley & Sons; 1984.
- Pradhan AM, et al. Analysis of genetic diversity in Indian potato genotypes using principal component analysis. Electron J Plant Breed. 2015;6(3):782–786.
- Dasgan HY, et al. Biostimulants enhance the nutritional quality of soilless greenhouse tomatoes. Plants. 2024;13(18):2587. https://doi.org/10.3390/plants13182587
- Sivaprakash KR, et al. Genetic diversity of black gram (Vigna mungo.) landraces evaluated by AFLP markers. Curr Sci. 2004;86(10):1411–1416.