In this study, through a comparison of the detection results of 24 Helicobacter pylori (H. pylori) cultured bacterial suspensions obtained using antigen detection and digital PCR methods, we analyzed their correlations to investigate their significance in the characterization of H. pylori reference materials and in vitro diagnostic evaluation.
Research Article
Correlation of H. pylori Antigen Titer with Digital Polymerase Chain Reaction Quantification: Analytical Evaluation of Cultured, Inactivated Isolates
In This Article
Summary
Abstract
The standardization of Helicobacter pylori (H. pylori) diagnosis remains challenging across heterogeneous detection assays. Immunochromatography detects H. pylori-specific antigens but delivers only qualitative results, susceptible to interference from non-target soluble bacterial proteins via non-specific binding or competitive inhibition. By contrast, digital PCR (dPCR) enables precise quantification of genomic DNA copies, identifying both viable and non-viable bacteria. This study compared immunochromatography-derived endpoint titers (semi-quantitative values calculated as the reciprocal of the highest detectable two-fold serial dilution) with dPCR-quantified nucleic acid copy numbers. Twenty-four H. pylori bacterial suspensions, cultured for 72 h at 37 °C on Brucella agar supplemented with 5% defibrinated sheep blood under microaerophilic conditions (85% N2, 10% CO2, 5% O2), were subjected to parallel antigen testing and dPCR measurement. Pearson correlation and linear regression were applied for statistical evaluation. We observed a significant positive correlation between antigen titer and genomic copy number (r = 0.536, n = 24, P = 0.007). However, the low coefficient of determination (R2 = 0.287) demonstrated limited predictive power, as antigen titer accounted for merely 29% of dPCR-measured variance and cannot support robust single-sample prediction. Discordant high-dPCR/low-titer profiles may originate from non-viable bacterial debris or free genomic DNA. Antigen-based and nucleic-acid-based assays quantify biologically related yet non-interchangeable analytes. Multi-parameter characterization combining colony-forming units, antigen titers and genome copy numbers is suggested for reference material development and diagnostic-assay validation. This work highlights the requirement for H. pylori-specific consensus guidelines to resolve diagnostic discrepancies.
Introduction
Helicobacter pylori (H. pylori) is a microaerophilic Gram-negative bacillus that commonly colonizes the human gastrointestinal tract, particularly in the antrum of the stomach. It serves as the primary cause of chronic gastritis, peptic ulcers, and gastric cancer1,2. Transmission of H. pylori among humans mainly occurs via the oral-oral or fecal-oral routes, and it is globally prevalent, with infection rates varying across different regions. In developed countries, the infection rate approximates 50%, whereas in certain developing countries, it can reach up to 80%3. In 1994, the World Health Organization (WHO) classified H. pylori as a Group 1 carcinogen for gastric cancer4. Key virulence factors such as CagA (cytotoxin-associated antigen A) and VacA (vacuolating cytotoxin A) drive chronic inflammation and epithelial damage, contributing to the pathogenic mechanisms that underpin its classification as a Group 1 carcinogen. In 2018, the number of cancer cases attributable to H. pylori infection reached 810,000, exceeding the combined number of cervical and liver cancer cases caused by human papilloma virus (HPV), hepatitis B virus (HBV), and hepatitis C virus (HCV)5. This statistic highlights the substantial cancer risk posed by H. pylori, which, if left untreated, may lead to gastric cancer with an approximate probability of 1%–3% according to some research. The high global prevalence of H. pylori infection makes precision in quantification—not merely detection—a public health priority, as accurate bacterial load assessment can guide treatment decisions and help avoid unnecessary or failed eradication therapies. Therefore, accurate detection and quantification of H. pylori are of great significance for epidemiological investigations, selection of treatment plans, and evaluation of therapeutic efficacy.
Given the substantial cancer burden attributable to H. pylori, accurate detection and quantification are critical for epidemiological surveillance, treatment selection, and therapeutic monitoring. Current non-invasive methods include the stool antigen test (SAT), urea breath test, and molecular assays. While digital PCR (dPCR) offers high precision and absolute quantification, its clinical application is constrained by higher cost, technical complexity, and instrument requirements compared to SAT. This disparity is why the correlation between the two methods needs to be studied, with the goal of improving SAT standardization using dPCR as a quantitative reference.
Digital PCR (dPCR), an emerging absolute quantification technology, can directly detect the absolute copy number of target genes without relying on a standard curve. In H. pylori research, dPCR has been utilized for bacterial quantification in gastric mucosa, saliva, and fecal samples6,7.
In the development, quality evaluation, and regulation of in vitro diagnostic reagents, the preparation and calibration of reference materials are fundamental for ensuring the accuracy, comparability, and traceability of results. For bacterial in vitro diagnostic reagents (such as H. pylori antigen/antibody detection reagents), reference materials often need to contain strains or clinical samples with well-defined concentrations or activity units. The traditional bacterial quantification method is Colony Forming Units (CFU/mL), which directly reflects the number of viable bacteria with proliferative ability and is frequently used for the value determination of bacterial standard substances, evaluation of reagent sensitivity, and methodological comparison8. Although CFU is still widely used, it has obvious limitations in terms of detection time, material consumption, and labor costs9.
With broader use of in vitro diagnostic technologies, molecular methods such as dPCR now quantify pathogens with greater accuracy and sensitivity. Simultaneously, immunological methods such as antigen titration are increasingly applied in clinical practice. However, in practical operations, most of the clinical isolates collected or the standard samples prepared are inactivated samples or long-term preserved samples, making it difficult or impossible to conduct live bacterial cultivation and CFU counting10. When preparing the reference materials, in order to meet the biosafety requirements and ensure the long-term stability of the materials, inactivation must be carried out. Quantitative methods based on antigens or nucleic acids thus become essential means for value determination8,11.
This gives rise to a practical question regarding the correlation and equivalence of these two distinct quantitative approaches: When using antigen detection and dPCR to evaluate standard substances, is there a stable and quantifiable relationship between the results of these two methods? Preliminary experiments utilizing a limited set of inactivated H. pylori samples demonstrated a consistent positive correlation between the signal intensity of immunochromatographic assays and the DNA copy numbers quantified via dPCR. We hypothesized that there is a significant and consistent positive correlation between H. pylori antigen titer, as measured by immunochromatographic assays, and DNA copy numbers, as quantified by dPCR, in inactivated bacterial samples. If such a correlation exists, it would enable the conversion of antigen-based qualitative results into quantitative nucleic acid equivalents. This will provide an important basis for the performance evaluation of reagents, the establishment of standards, the assignment of reference materials, and the interpretation of clinical test results when traditional culture is not feasible.
Currently, research on the relationship between H. pylori antigen results and nucleic acid content is inadequate, and there is a lack of systematic data to support review, regulation, and standardization work. To test this hypothesis, this study conducted parallel testing on 24 cultured bacterial suspensions of H. pylori to systematically analyze the correlation between the antigen titer detected by the colloidal immunochromatographic method and the absolute quantitative result of dPCR. Based on our findings, we put forward reference opinions on the performance evaluation of H. pylori detection reagents and the assignment of standard material values.
Protocol
All Helicobacter pylori isolates included in this study were originally isolated from human gastric biopsy and fecal specimens by the Fifth Affiliated Hospital of Zhengzhou University, which provided fully processed, anonymized bacterial suspensions for our in vitro experiments. All original procedures (clinical specimen collection, bacterial isolation, and initial cryopreservation) were approved by the Ethics Committee of the Fifth Affiliated Hospital of Zhengzhou University (Ethical Approval Number: KY2026080). Informed consent was obtained from all participants prior to specimen collection, and all procedures strictly complied with the Helsinki Declaration and relevant national biomedical research ethical guidelines. All patient-identifiable information was permanently removed by the source hospital before sample transfer, and no individual patient identity can be deduced from the experimental materials or results reported in this study.
The present study does not require additional independent ethical approval or informed consent. All experiments only involve in vitro assays using anonymized bacterial suspensions, with no access to original human specimens, patient clinical records, or private personal information. In accordance with national biomedical research ethics regulations, non-interventional in vitro research utilizing fully anonymized microbial isolates meets the criteria for ethical exemption. The original ethical approval from the Fifth Affiliated Hospital of Zhengzhou University already covers all legitimate secondary academic applications of these anonymized strains, which has been officially confirmed by the institutional ethics committee.
All H. pylori in vitro experiments were performed in laboratories with valid biosafety certification (Bio-safety Level 2, BSL-2, Beijing Dongcheng District Health Commission Laboratory Biosafety Filing [2020] No. 059), following institutional standard operating procedures and meeting all biosafety review and authorization requirements. The biosafety approval for this study covers all procedures involving the heat-inactivated H. pylori material, including work with material that is not fully inactivated (i.e., containing residual viable organisms as characterized by viability PCR). Strict adherence to standard microbiological practices, personal protective equipment (PPE) requirements, and waste decontamination procedures was maintained throughout the study. All bacterial samples were properly inactivated prior to disposal following institutional guidelines for biohazard waste management. The details of all the reagents, the equipment and the software used for statistical analysis are listed in the Table of Materials.
Strain and culture
CAUTION: H. pylori is a Risk Group 2 human pathogen. All manipulations of viable cultures (inoculation, incubation, and suspension preparation) must be performed in a certified biosafety cabinet within BSL-2 facilities, wearing a laboratory coat, gloves, and eye protection.
Heat inactivation at 56 °C for 25 min drastically reduces but does not fully eliminate viable organisms (see section 1); partially inactivated suspensions must continue to be handled under BSL-2 conditions. All biological waste and contaminated consumables must be autoclaved (121 °C, ≥30 min) or disinfected in accordance with institutional biosafety procedures before disposal. The BSL-2 work described here was authorized under the same biosafety filing (Beijing Dongcheng District Health Commission Laboratory Biosafety Filing [2020] No. 059).
The Helicobacter pylori strains used in this study were 24 cultured bacterial suspensions, which were initially obtained from human gastric biopsy and fecal specimens by the Fifth Affiliated Hospital of Zhengzhou University and then transferred in bacterial suspension form to the strain collection of the In Vitro Diagnostic Department of Infectious Diseases at the National Institutes for Drug Control (NIDC), Beijing, China, and all experimental work in this study was performed at the NIDC (Beijing, China). These strains were inoculated onto Brucella medium plates supplemented with 5% defibrinated sheep blood and cultured under microaerophilic conditions (85% N₂, 10% CO₂, 5% O₂) at 37 °C for 72 h. This culture time corresponds to the stationary growth phase, during which the antigen expression of each strain is relatively stable. The bacterial suspensions were then collected.
Heat inactivation was performed using a digital water bath at 56 °C for 25 min. This treatment was conducted to meet biosafety requirements and ensure the long-term stability of the reference materials. Heat inactivation at 56 °C for 25 min drastically reduces bacterial viability but does not fully eliminate all viable organisms, as confirmed by subsequent viability PCR analysis, which measured a median residual viable fraction of 4.6% (range 0.00%–33.00%) across the 24 cultured bacterial suspensions (see Results section 6 and Discussion). The biosafety approval for this study covers work with material that is not fully inactivated (see Ethical and Biosafety Statement). The potential impact of heat inactivation on antigen detection is considered minimal, as the thermal treatment is below the denaturation threshold of most H. pylori surface antigens; however, it may affect the integrity of some heat-labile protein antigens. For DNA quantification, heat inactivation does not degrade genomic DNA and may actually improve extraction efficiency by disrupting cell membranes.
Antigen detection
The 24 collected bacterial suspensions were diluted 100-fold with PBS to prepare antigen detection samples. A 100-fold initial dilution adjusts the antigen concentration into the linear detection range of commercial kits and minimizes matrix interference, thereby ensuring reliable and accurate detection results. The dilution also conserves sample volume. These samples were tested using eight registered H. pylori antigen detection kits (Table 1), including the colloidal gold method, latex method, and immunochromatographic method. If the result was positive, the diluted sample was serially diluted (1:2, 1:4, 1:8, etc.) and tested until the result was negative. The highest dilution ratio that remained positive was recorded and defined as the "final positive dilution ratio of antigen" (e.g., 1:64). The two-fold serial dilutions were prepared in phosphate-buffered saline (PBS, 0.01 M, pH 7.2–7.4). After sample application, each strip was incubated at room temperature for 15–20 min before reading; the result was read visually by a trained operator against the control line, and the endpoint was recorded as the highest dilution showing a visible test line. Because colloidal gold strips are read visually, the cut-off is operator-dependent.
For each sample tested using multiple commercial antigen detection kits, the endpoint titer is defined as the median of all individual kit titers. Since the eight kits in this study were designed with heterogeneous target antigens and detection principles, Cohen's Kappa or CV% were not used to quantify the consistency between the kits because these indicators assume the existence of a common reference standard. Thus, the observed variability between the kits reflects the true biological and analytical heterogeneity rather than measurement errors. The median, as a robust measure of central tendency, can effectively resist kit-specific deviations. Across the 24 samples, the within-sample spread between the highest and lowest kit titers ranged from 2-fold to 16-fold (median, 4-fold): six samples differed by 2-fold, fourteen by 4-fold, three by 8-fold, and one by 16-fold between kits. The per-kit minimum, median, and maximum titers for each sample are listed in Supplementary Table 1.
Digital PCR quantitative detection
The collected 24 bacterial suspensions underwent a 500-fold dilution with PBS and then used as samples for dPCR quantitative detection. Absolute quantification of these diluted samples was performed by four dPCR laboratories (Table 2). dPCR was performed using platform-specific proprietary primer and probe sets targeting conserved H. pylori genomic sequences. The dPCR detection kits used in this study are universal reagent kits applicable to multiple pathogens and multiple targets. Each platform independently designed and optimized the specific primer/probe sequences and target gene regions, which are its core intellectual property. These sequences were not disclosed to the end users. We were only informed that the specific detection target for H. pylori is a conserved genomic region that has been verified to be capable of specific detection. The 23S rRNA gene sequences of 24 Helicobacter pylori strains have been submitted to NCBI GenBank under BioProject accession PRJNA1520048. These sequences were submitted for strain identity confirmation and are not the dPCR quantification target. Because the primer/probe design, amplification chemistry, and Poisson-based partition counting are proprietary to each platform, these steps are platform-dependent and cannot be reproduced without manufacturer access; in contrast, the sample dilution, extraction replication, and data-aggregation procedures described above are platform-independent and fully specified. Absolute copy numbers were calculated using the Poisson distribution algorithm implemented in the instrument's proprietary analysis software. The specific computational parameters and source code are proprietary to the manufacturer and were not disclosed to end users. Finally, the absolute copy number (copies/mL) of the target gene in the original solution was calculated based on the Poisson distribution and the dilution factor.
Four independent dPCR laboratories (Sniper, Jiangsu Bioperfectus Technologies Co., Ltd., Ustar Biotechnologies Ltd., and TargetingOne) participated in this study, each using proprietary extraction kits and dPCR reagents optimized for its instrument platform, all targeting conserved H. pylori genomic sequences. Each platform received the undiluted bacterial suspension and prepared samples according to its own protocol: Ustar used the undiluted suspension directly, while Sniper, Jiangsu Bioperfectus Technologies Co., Ltd., and TargetingOne diluted it 500-fold in PBS before extraction. For each isolate on each platform, two independent nucleic acid extractions were performed from the same 500-fold diluted bacterial suspension, and each extract was tested in triplicate, yielding six measurements per isolate per platform (with one exception on Ustar where one extraction yielded only two valid replicates). A reaction was classified as invalid and excluded if positive droplets fell below the instrument's lower limit of detection or the no-template control exhibited non-specific amplification; invalid reactions were repeated once, with persistent failures leading to exclusion of the entire extraction. Platform-specific raw data are provided in Supplementary Table 1.
Data aggregation followed a two-tier procedure: first, all valid raw measurements (copies/µL) within each platform were averaged and converted to original undiluted bacterial suspension concentration (copies/mL) using platform-specific conversion formulas; second, the four platform-derived concentrations for each isolate were averaged (arithmetic mean) to yield the final single copy-number value. This framework ensures equal platform contribution regardless of within-platform replicate variation while mitigating systematic biases inherent to individual instruments or reagent systems.
Each cultured bacterial suspension was quantified in parallel on four dPCR platforms, and the coefficient of variation (CV) of the log₁₀-transformed copy numbers across platforms was calculated for each isolate to assess interlaboratory variability. The corresponding results are reported in the Results section.
Statistical analysis
The H. pylori antigen titer was defined as the reciprocal of the highest sample dilution factor at which a positive result was observed (e.g., a dilution of 1:64 corresponds to a titer of 64). For each isolate, the eight kit-specific antigen titers were aggregated by their median, and the four platform-specific dPCR concentrations were aggregated by their arithmetic mean, to derive a single representative value per isolate for downstream correlation analysis. This data-reduction strategy is methodologically justified because: (i) the eight antigen kits detect the same analyte using comparable immunoassay principles, and the median provides a robust estimator resistant to sporadic outlier readings; (ii) each of the four dPCR platforms quantifies a conserved H. pylori genomic locus, and the arithmetic mean of log-normally distributed concentration estimates yields an unbiased central tendency; and (iii) this aggregation aligns with the study's primary objective—assessing the concordance between antigen-titer-based and DNA-based quantification modalities at the isolate level—rather than evaluating inter-kit or inter-platform analytical performance. The correlation between the antigen titer and the dPCR quantification (copies/mL) was first assessed using Pearson correlation analysis. Both variables are approximately normally distributed after log transformation (skewness: log10 dPCR = −0.66; log2 antigen titer = −0.60; regression residual skewness = −0.16), satisfying the assumptions for Pearson correlation. The antigen titer was log2-transformed to reflect the linearization of a two-fold serial dilution, while the dPCR results were log10-transformed, which also conforms to the reporting format of the bacterial load standard. Subsequently, to evaluate the linear association, Pearson correlation and linear regression analyses were performed using the antigen titer-transformed log2 and the dPCR results-transformed log10. For all analyses, a significance level (α) of 0.05 was applied, with P < 0.05 considered statistically significant. All statistical analyses were conducted using the SPSSPRO online statistical analysis platform.
Results
Comparison of H. pylori antigen titer and dPCR absolute quantification results
Among the total of 24 cultured bacterial suspensions, the antigen titer ranged from 8 to 256, with a median of 32 (Table 1). The dPCR quantification results ranged from 2.67 × 10⁷ copies/mL to 2.04 × 10⁹ copies/mL, with a median of log₁₀ = 8.61 (≈4.09 × 10⁸ copies/mL) (Table 2). The relationship exhibited non-linear characteristics in the raw data, suggesting a power-law or exponential association, which justified the subsequent logarithmic transformations applied to both antigen titer and dPCR quantification values.
Linear association between log-transformed antigen titer and dPCR quantitative results
To test whether there is a significant correlation between the results of the two detection methods, we applied logarithmic transformation and performed Pearson correlation analysis, as both variables are approximately normally distributed after log transformation. As shown in Figure 1, after transformation, the antigen titer (log2-transformed) and the absolute quantitative result of dPCR (log10-transformed) exhibited a significant moderate positive linear correlation (r = 0.536, n = 24, P = 0.007).
Quantitative modeling of the relationship between antigen titer and dPCR copy number
To quantify the relationship between the two detection methods and assess the potential for mutual prediction, we applied linear regression analysis to the log-transformed data, so as to utilize the regression model to predict bacterial load through antigen titer in the future. The analysis reveals a linear relationship between log2 (antigen titer) and log10 (dPCR), yielding the equation: log10(dPCR) = 0.1588 × log2(titer) + 7.7988 (R2 = 0.287). The regression coefficients (with standard errors and 95% confidence intervals) were: slope 0.1588 ± 0.053 (95% CI 0.048–0.270) and intercept 7.7988 ± 0.292 (95% CI 7.193–8.404); the residual standard error was 0.318 log10 units, and the overall regression was significant (F(1,22) = 8.84, P = 0.007). This indicates that for every doubling of the antigen titer, the dPCR copy number only increases by 1.441 times (100.1588). However, for a given antigen titer, the 95% prediction interval of the dPCR results can span nearly two orders of magnitude (for example, at a titer of 1:32, the prediction interval is approximately 8.3 × 10⁷ to 1.85 × 10⁹copies/mL). This indicates that in practical applications, the antigen titer alone cannot accurately predict the copy number of nucleic acid in a single sample, but using this model may provide a coarse estimation of the order of magnitude for group-level comparisons, though it is limited for individual sample prediction due to the moderate explanatory power (R2 = 0.287).
Inter-platform variability of dPCR quantification and sensitivity analysis of the correlation
Interlaboratory variability was assessed on log10-transformed concentrations to account for the log-normal distribution of microbial quantification data. The CV% across the four platform-derived log10 concentrations ranged from 0.9% to 8.3% (median 1.8%, mean 2.5%) across 24 isolates. One outlier (Hp06, CV = 8.3%) showed a >30-fold discrepancy between Sniper (5.93 × 10⁸ copies/mL) and TargetingOne (1.50 × 10⁷ copies/mL); excluding this isolate, CVs ranged from 0.9% to 6.4%. To ensure that this outlier did not drive the observed antigen–dPCR correlation, a sensitivity analysis was performed excluding Hp06, which yielded r = 0.479, R2 = 0.230, and P = 0.021 (n = 23) — comparable to the primary analysis including all 24 isolates — confirming that the headline correlation does not depend on this isolate. This dispersion reflects systematic differences among platforms in extraction efficiency, reagent sensitivity, and instrument calibration rather than random measurement error, which supports cross-platform averaging to reduce platform-specific bias.
Defining and classifying results using dual-method thresholds
Based on the analyses above and on exploratory, dataset-specific criteria, this study set the median titer of antigen detection at 1:32 as the threshold for high antigen detection, due to the non-normal distribution of antigen titer data, and selected the actual median log₁₀(dPCR) = 8.61 (≈4.09 × 10⁸ copies/mL) as the threshold for high nucleic acid content. These thresholds are exploratory, dataset-specific cutoffs derived from cultured isolate data and do not represent validated clinical diagnostic criteria. Consequently, any application of these cutoffs to other sample collections or analytical contexts would require re-derivation from the corresponding data rather than direct transfer.
Using the exploratory thresholds (antigen titer ≥ 1:32 as high, ≤ 1:16 as low; dPCR log₁₀ ≥ 8.61 as high nucleic acid load), the four-quadrant classification of the 24 cultured bacterial suspensions (Figure 2, Table 3) is as follows: 9 samples (Hp03, Hp04, Hp11, Hp13, Hp18, Hp19, Hp21, Hp22, Hp25) fall into the high antigen–high nucleic acid category (37.5%); 3 samples (Hp09, Hp26, Hp27) are classified as low antigen–high nucleic acid (12.5%); 8 samples (Hp01, Hp02, Hp05, Hp08, Hp10, Hp14, Hp15, Hp17) exhibit high antigen–low nucleic acid (33.3%); and 4 samples (Hp06, Hp07, Hp12, Hp20) belong to the low antigen–low nucleic acid category (16.7%). Because the 24 isolates were divided into six titer groups with an average of only 4 samples per group, formal inter-group comparison (e.g., Kruskal-Wallis testing) would lack sufficient statistical power; therefore, only descriptive summaries of dPCR quantitative results across titer groups are reported.
Residual viable fraction after heat inactivation (viability PCR)
To quantify residual viable bacteria following heat inactivation, a viability PCR reagent system was used for all 24 isolates. Briefly, each heat-inactivated suspension (200 µL) was incubated with the membrane-impermeable Viability PCR Reagent (10 µM final concentration) at 37 °C for 75 min, with a parallel reagent-omitted control (−VR) processed identically. The reagent was then chemically inactivated by adding Viability PCR Neutralization Buffer (20 µL, 10×) and incubating at room temperature for 15 min. Genomic DNA was extracted from both the +VR and −VR aliquots, and dPCR was performed on each extract; the viable fraction was calculated as the ratio of +VR to −VR copy numbers × 100%. The median viable fraction was 4.6% (range 0.00%–33.00%; full per-isolate results in Supplementary Table 2). The viable percentage did not correlate significantly with antigen titer (r = 0.03, P = 0.90) or with dPCR copy number (r = 0.37, P = 0.08).
DATA AVAILABILITY:
The 23S rRNA gene sequences of 24 Helicobacter pylori strains have been deposited in NCBI GenBank under BioProject accession PRJNA1520048. These sequences were used solely for strain identity confirmation and do not represent the dPCR quantification target, which is a manufacturer-proprietary conserved genomic region, as described in Protocol.
The raw kit-specific antigen titers from eight commercial colloidal gold immunochromatographic kits and the platform-specific dPCR quantitative values from four digital PCR instruments cannot be deposited in a public repository because of commercial sensitivity, manufacturer confidentiality agreements, and regulatory restrictions associated with CE-marked/National Medical Products Administration-approved in vitro diagnostic products.
Additional restricted data may be made available confidentially when necessary, subject to the applicable confidentiality and regulatory restrictions.
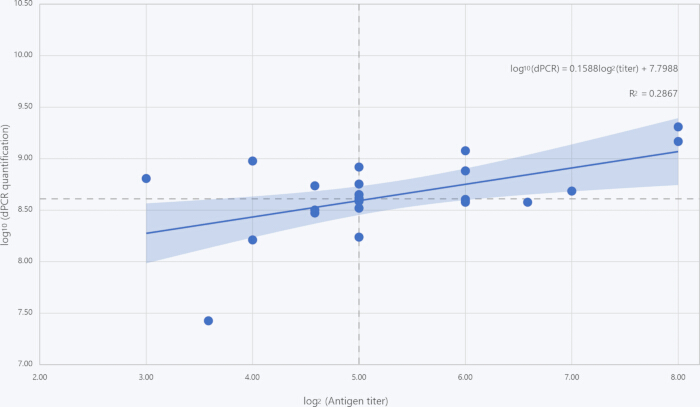
Figure 1: Correlation between Helicobacter pylori antigen titer and digital polymerase chain reaction (dPCR) quantification. A scatter plot with a regression line is presented to illustrate the relationship between antigen titer and DNA copy numbers in 24 cultured bacterial suspensions (n = 24). Antigen titers were ascertained via a colloidal gold immunochromatographic assay with visual reading. Serial dilutions of each sample were examined, and the titer is expressed as the highest dilution factor that yields a positive result (presented on the x-axis as log2-transformed, dimensionless values). DNA copy numbers were quantified through dPCR and are presented on the y-axis as log10-transformed concentrations (log10 copies/mL). Each dot represents an individual bacterial suspension sample. The blue solid line represents the linear regression fit. The shaded band around the regression line represents the 95% confidence interval of the fitted mean response. The dashed vertical and horizontal lines indicate the exploratory classification thresholds (log₂ titer = 5, i.e., 1:32; log₁₀ dPCR = 8.61, i.e., 4.09 × 10⁸ copies/mL) used in Figure 2 and Table 3. Correlation was evaluated using the Pearson correlation coefficient, resulting in r = 0.536, P = 0.007, R2 = 0.287, which indicates a statistically significant positive correlation between the two methods. Please click here to view a larger version of this figure.
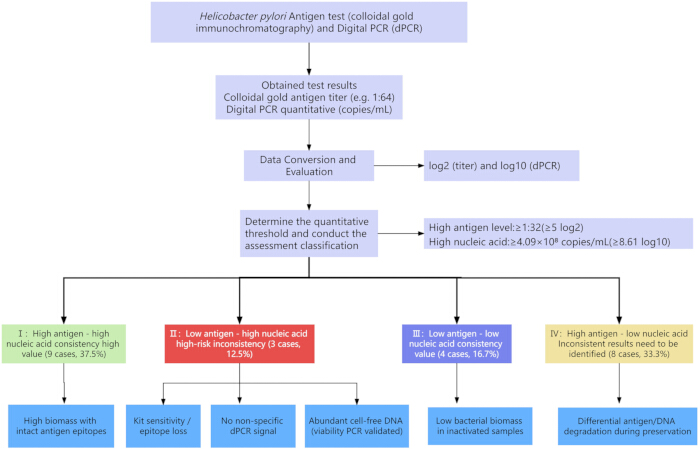
Figure 2: Analytical classification framework for H. pylori testing combining antigen test results with dPCR quantification. This figure depicts the four-quadrant classification of 24 cultured bacterial suspensions (n = 24) based on the concordance between immunochromatographic antigen titer and dPCR quantitative results. Using exploratory, dataset-specific thresholds (antigen titer ≥ 1:32 as high, ≤ 1:16 as low; dPCR log₁₀ ≥ 8.61 as high nucleic acid load), samples are classified into: high antigen–high nucleic acid (n = 9, 37.5%), high antigen–low nucleic acid (n = 8, 33.3%), low antigen–high nucleic acid (n = 3, 12.5%), and low antigen–low nucleic acid (n = 4, 16.7%). These thresholds are exploratory cutoffs derived from cultured isolate data and do not represent validated clinical diagnostic criteria. The classification framework illustrates the agreement and discordance between immunological and molecular detection methods. Categories with discrepancies may reflect factors such as antigen stability, bacterial viability, or DNA copy number variation. This framework is intended for analytical comparison purposes and does not constitute clinical diagnostic or treatment recommendations. Please click here to view a larger version of this figure.
| No. | Detection reagent | Manufacturer |
| 1 | Helicobacter pylori antigen detection kit (colloidal gold method) | Bioneovan Co., Ltd |
| 2 | Gastric Helicobacter pylori (HP) Antigen Detection Kit (Colloidal Gold Method) | Shanghai Chemtron BIOTECH Co., Ltd |
| 3 | Helicobacter pylori antigen detection kit (colloidal gold method) | Jiangsu Mole Bioscience Co., Ltd |
| 4 | Helicobacter pylori antigen detection kit (colloidal gold method) | Hangzhou Genesis Biodetecton & Biocontrol Ltd |
| 5 | Helicobacter pylori antigen detection kit (colloidal gold method) | JIANGSU COWIN BIOTECH CO., LTD |
| 6 | Helicobacter pylori antigen detection reagent (latex method) | ABON Biopharm (Hangzhou) Co. Ltd |
| 7 | Helicobacter pylori (HP) antigen detection reagent (immunochromatographic method) | GUANGZHOU WONDFO BIOTECH CO., LTD |
| 8 | Helicobacter pylori antigen detection kit (colloidal gold method) | Beijing Core Technology Co., Ltd |
Table 1: List of Helicobacter pylori Antigen Detection Reagents and Their Manufacturers. The table enumerates eight commercially accessible immunochromatographic assays for the detection of H. pylori antigen, which were assessed in this study. For each product, the No. (as supplied by the manufacturer), the commercial designation of the detection reagent, and the manufacturer's name are presented. These kits were chosen on the basis of their extensive utilization in clinical diagnostics and point-of-care testing. All information was retrieved from the manufacturers' product inserts and official websites (accessed in March 2026). The inclusion of these reagents does not signify an endorsement; they are representative of the diversity of available tests.
| No. | Instrument model | Digital PCR Platforms |
| 1 | DQ24 | Sniper |
| 2 | Bio Rad QX200 Droplet Digital PCR | Jiangsu Bioperfectus Technologies Co., Ltd |
| 3 | DQ24 Pro | Ustar Biotechnologies (Hangzhou) Ltd |
| 4 | TD-1 Digital PCR System | TargetingOne |
Table 2: List of Digital PCR (dPCR) Platforms and Instrument Models. This table enumerates four laboratory platforms equipped with dPCR systems, along with the corresponding instrument models employed for testing. These platforms were chosen in consideration of their technological diversity and representativeness of the current implementation of dPCR. All information is provided by each respective platform. The inclusion of these platforms does not signify an endorsement; they simply represent the scope of existing dPCR systems.
| Type | Number of cases | Proportion | Sample number |
| High antigen - High nucleic acid | 9 | 37.5% | Hp03, Hp04, Hp11, Hp13, Hp18, Hp19, Hp21, Hp22, Hp25 |
| Low antigen - High nucleic acid | 3 | 12.5% | Hp09, Hp26, Hp27 |
| Low antigen - Low nucleic acid | 4 | 16.7% | Hp06, Hp07, Hp12, Hp20 |
| High antigen - Low nucleic acid | 8 | 33.3% | Hp01, Hp02, Hp05, Hp08, Hp10, Hp14, Hp15, Hp17 |
Table 3: Classification and Proportion of Antigen Test and Nucleic Acid Test Results in This Study. This table classifies 24 cultured bacterial suspensions according to the concordance between antigen titer (determined by immunochromatographic assay, expressed as the highest dilution factor resulting in a positive result) and absolute quantitative digital polymerase chain reaction (dPCR) results (expressed as log₁₀ copies/mL). Using an antigen titer cutoff of 1:32 (high ≥ 1:32, low ≤ 1:16) and a dPCR quantification cutoff of 4.09 × 10⁸ copies/mL (log₁₀ = 8.61) as exploratory, dataset-specific thresholds, isolates were classified into four subgroups: High Antigen-High Nucleic Acid, Low Antigen–High Nucleic Acid, High Antigen–Low Nucleic Acid, and Low Antigen-Low Nucleic Acid. Among the 24 samples, 9 were categorized as High Antigen–High Nucleic Acid (37.5%; Hp03, Hp04, Hp11, Hp13, Hp18, Hp19, Hp21, Hp22, Hp25), 3 as Low Antigen–High Nucleic Acid (12.5%; Hp09, Hp26, Hp27), 8 as High Antigen–Low Nucleic Acid (33.3%; Hp01, Hp02, Hp05, Hp08, Hp10, Hp14, Hp15, Hp17), and 4 as Low Antigen–Low Nucleic Acid (16.7%; Hp06, Hp07, Hp12, Hp20). For each category, the table shows the number of cases (n), the proportion relative to the total sample size (%), and the sample numbers within each category. This classification illustrates the agreement and discordance between immunological and molecular detection methods; categories with discrepancies may reflect factors such as antigen stability, bacterial viability, or DNA copy number variation, offering insights for the interpretation of analytical test results.
Supplementary Table 1: Aggregated dataset of antigen detection and dPCR quantification for the 24 Helicobacter pylori isolates. Sheet 1 (Antigen Detection): per-kit endpoint titers from the eight commercial colloidal gold immunochromatographic kits for each isolate, with the per-sample minimum, median, and maximum titer and within-sample fold range. Sheet 2 (Digital PCR Quantitative Detection): platform-specific dPCR concentrations (copies/mL) for each isolate, with inter-platform summary statistics (median, minimum, maximum, and CV% of log₁₀-transformed concentrations). Sheet 3 (Correlation and Regression Analysis): strain-level log₂-transformed antigen titers and log₁₀-transformed dPCR concentrations, Pearson correlation and linear regression results (r, R2, regression equation), sensitivity analysis excluding the outlier Hp06, and detailed regression statistics (standard errors, 95% confidence intervals, residual standard error, F-statistic, and P-value). Kit-specific and platform-specific identifiers are anonymized for commercial confidentiality; the dataset contains all values required to reproduce Figures 1–2 and Table 3.Please click here to download this file.
Supplementary Table 2: Viability PCR results for the 24 Helicobacter pylori isolates. Per-isolate dPCR copy numbers of the viability reagent–treated (+VR) and reagent-omitted (−VR) aliquots after heat inactivation at 56 °C for 25 min, with the calculated viable fraction (%) and equivalent ΔCq for each isolate. The median viable fraction across all isolates was 4.6% (range 0.00%–33.00%).Please click here to download this file.
Discussion
In this study of 24 cultured H. pylori isolates, immunochromatographic antigen titer and dPCR genomic copy number showed a moderate but significant positive correlation (r = 0.536, P = 0.007); however, antigen titer explained only 29% of the variance in dPCR copy number (R2 = 0.287), so the two measures are related but not interchangeable. The key limitation of this study is its small sample size (n = 24), which constrains statistical power and explains the exploratory nature of the classification thresholds used below.
This study quantitatively analyzed the antigen titer in H. pylori cultures and the nucleic acid copy numbers detected by dPCR, revealing a moderate yet significant correlation between the detection results of these two methods (r = 0.536, P = 0.007). Although a significant correlation between the two methods is observed at the population level, disparities at the individual level are frequently encountered in clinical practice. This is because different detection targets mirror distinct biological traits of pathogens. Specifically, antigen tests detect proteins that might endure subsequent to bacterial clearance, whereas nucleic acid tests detect DNA that could persist at low levels even after the elimination of viable bacteria. Such discordance has been well documented across various infectious diseases. For example, in clinical diagnosis of Clostridioides difficile infection, some carriers have positive results in toxin gene detection but negative results in toxin protein antigen detection, which leads to a misdiagnosis as an infected person and causes over-treatment and the emergence of drug resistance. Therefore, the Infectious Diseases Society of America (IDSA)12 clearly distinguished the clinical significance of "toxin detection" and "toxin gene detection" for Clostridioides difficile in the guidelines. It is not sufficient to diagnose infection only by nucleic acid testing, and it is recommended to adopt methods that can directly detect active toxin protein. Additionally, in community-acquired pneumonia after antibiotic treatment, the bacterial DNA load in the patient's sputum decreases rapidly, while the urinary antigen remains positive after recovery and persists for several weeks to several months13. Similar phenomena are also observed in the diagnosis and treatment of H. pylori infection. In 2022, Mayo Clinic Laboratories evaluated that in 223 follow-up patients after antibiotic treatment, PCR was relatively sensitive in detecting low-level residual DNA in fecal samples. Some patients, although clinically recovered and antigen-negative, still had PCR-positive results for several weeks14. All these further confirm the biological differences of different detection targets.
In this study, the identification of a quantitative correlation and equivalence between the antigen titer of H. pylori detected by immunochromatographic method and the dPCR quantification values offers practical guidance for the characterization of H. pylori reference materials and for the evaluation of in vitro diagnostic reagents. 1) Promote the upgrading of product performance evaluation model: Currently, the clinical trial evaluation of H. pylori antigen detection reagents adopts blind synchronous comparison with clinical "gold standards" such as histology, culture, or urea breath test15. This research proposes that regulatory bodies should mandate enterprises to furnish pertinent correlation data between their test results and nucleic acid quantitative methods in the application materials during the review process, and clearly define the performance of their products in the "inconsistent result range", so as to more realistically reflect the detection ability of the product in complex clinical scenarios and more comprehensively define the LOD of the reagent. 2) This provides a new approach for the assignment of bacterial reference materials: reference materials for quality control and calibration can be transformed from a single "CFU" to "multidimensional characteristic values"8 that include antigen titer and nucleic acid copy numbers. The regression model established in this study can provide a coarse estimation of the order of magnitude for the relationship between these two values, providing a quantitative basis for the use of reference materials and for inter-laboratory comparisons.
We recommend that manufacturers include not only the limit of detection (LOD) in analytical units (e.g., CFU/mL or antigen titer) but also its equivalence in genomic copies—as determined by digital PCR (dPCR)—so that results can be compared and aligned across laboratories and platforms. Such dual-unit reporting is consistent with the metrological traceability requirements of ISO 175118 and with the detection-capability evaluation framework of CLSI EP17-A216.
The potential reasons for the occurrence of "low antigen–high nucleic acid" samples are as follows: 1) Genetic variation of the strain: If the amino acid in the antigenic epitope is replaced, or if the secretion protein is blocked during transport and secretion, an "escape" phenomenon in antigen detection may occur17. 2) dPCR is designed to target and amplify conserved gene sequences. The specific gene targeted by dPCR in this study was not disclosed in the manufacturer's documentation. However, commercial antigen detection kits may target different H. pylori antigens (e.g., VacA, urease, flagellar proteins, or whole-cell antigens), and any mismatch between the dPCR target gene and the antigen recognized by a given kit could manifest as quantitative discordance across the four quadrants of the scatter plot—high dPCR/low antigen, low dPCR/high antigen, high-high concordance, or low-low concordance—rather than binary positive/negative discrepancies18. 3) Limitations of the detection method: Antigen detection technology is limited by extremely low or extremely high concentrations of antigens, which will weaken the signal due to insufficient affinity with antibodies or oversaturation, and is also affected by the sample matrix. 4) Asymmetry of detection limit performance: The lower limit of detection (LOD) of dPCR can reach 10–100 copies/mL, while the detection limit of colloidal immunochromatographic method for urease is approximately 104–105 CFU/mL. When the bacterial quantity is at the critical value, the phenomenon of "low antigen–high nucleic acid" is prone to occur. 5) The influence of infection status on clinical outcomes is significant, particularly in distinguishing bacterial infections from viral ones. In the infection process, gene copy number and antigen expression level do not exhibit a constant corresponding relationship. Following successful treatment, nucleic acid levels may decline rapidly, whereas antigen clearance may be delayed for some time19.
The bacterial suspensions used in this study were derived from both gastric biopsy specimens and fecal samples, representing distinct matrix environments with different interference profiles. Gastric biopsy-derived isolates are largely free of stool-associated PCR inhibitors but may be subject to residual pepsin exposure during specimen processing. In contrast, fecal specimens contain PCR inhibitors (e.g., bile salts, complex polysaccharides, hemoglobin degradation products) that can reduce amplification efficiency and lead to underestimated dPCR quantification, as well as intestinal proteases that may degrade target antigens even when bacterial DNA remains intact. These matrix-specific effects operate independently of the target-region mismatch mechanisms described above and indicate that preparation protocols and method validation should be matched to the specimen type when interpreting quantitative discordance across clinical specimens.
To experimentally quantify the ratio of viable to non-viable bacteria following heat inactivation, viability PCR using a viability PCR reagent system was performed on all 24 cultured isolates. This reagent works analogously to propidium monoazide (PMA): it selectively penetrates cells with compromised membranes and covalently modifies their genomic DNA to block subsequent amplification. The percentage of viable bacteria was calculated with the formula: Viable % = (DNA copies/µL treated with viability reagent (VR)) / (DNA copies/µL without VR) × 100. Across all isolates, the median viable fraction after heat inactivation was 4.6% (range: 0.00%–33.0%), verifying that our 56 °C, 25 min heat inactivation drastically reduces bacterial viability yet fails to fully eliminate viable organisms. These viability data strongly support our interpretation that discordant high-dPCR/low-antigen-titer profiles primarily originate from residual cell-free DNA and DNA within non-viable bacterial particles rather than intact viable H. pylori. Full viability quantification results for all 24 strains are summarized in Supplementary Table 2.
In this study, the four-quadrant classification (based on exploratory, dataset-specific thresholds) revealed that 8 samples exhibited high antigen–low nucleic acid and 4 samples belonged to low antigen–low nucleic acid, alongside 9 high–high and 3 low–high concordant categories. The presence of high antigen–low nucleic acid samples (n = 8) suggests that antigen expression and nucleic acid content do not always correspond, even in pure cultures. All 24 isolates were harvested in the stationary growth phase (72 h culture; see Protocol section 1). In stationary phase, DNA replication has largely ceased while structural and metabolic antigens persist or even continue to accumulate; this growth-phase decoupling offers a plausible biological basis for the asymmetry between the abundant high antigen low nucleic acid class (n = 8) and the small low antigen–high nucleic acid class (n = 3), although it cannot by itself exclude other mechanisms such as inter-strain differences in antigen expression or partial lysis during heat inactivation. The existence of low antigen–high nucleic acid samples (n = 3) confirms that a low antigen titer does not inevitably correspond to a low nucleic acid load, showing that nucleic acid testing complements antigen testing in specific scenarios. These thresholds are exploratory and dataset-specific, and do not represent validated clinical diagnostic criteria.
This study is limited by the small sample size (n = 24), which makes the statistical power insufficient to support robust subgroup analysis. The sample was divided into six titer groups, with an average of only 4 samples in each group, so formal inter-group comparisons lack sufficient statistical power to detect meaningful differences. Therefore, the Kruskal-Wallis test was not applied, to avoid presenting inferential statistical results with insufficient power. Furthermore, all samples were cultured isolates and did not cover the more complex matrix effects found in clinical samples such as gastric mucosa, feces, or saliva.
Disclosures
The authors have nothing to disclose.
No AI tools were used in the writing, editing, statistical analysis, code development, or figure preparation of this manuscript.
AUTHOR CONTRIBUTIONS:
All authors confirmed their respective contributions to this work. Individual author roles are listed below. All authors read and approved the final submitted manuscript and take full responsibility for the accuracy and integrity of the research data. Wenwen Sun: Investigation, Data curation, Formal analysis, Methodology, Writing draft, Funding acquisition; Xiaona Han: Investigation, Methodology; Jin Zhang: Investigation, Methodology; Xinxin Duan: Investigation, Methodology; Tingting Li: Conceptualization, Supervision; Manyu Li: Conceptualization, Supervision, Writing – review and editing; Haiwei Zhou: Conceptualization, Supervision, Writing – review and editing.
Acknowledgements
This study is funded by Youth Development Research Foundation of the National Institutes for Drug Control (NIDC) (Grant No. 2025C5).
Materials
| Name | Company | Catalog Number | Comments |
|---|---|---|---|
| 2X dPCR Probe Master Mix Plus (Rox) | Sniper | RT021096A | Digital PCR Quantitative Detection Reagent |
| Bacterial Genomic DNA Extraction Kit | Tiangen Biochemical Technology (Beijing) Co., Ltd. | Y2213/DP302-02 | Bacterial nucleic acid extraction |
| Bio-Rad QX200 Droplet Digital PCR System | Jiangsu Bioperfectus Technologies Co., Ltd. | QX200 | Digital PCR Quantitative Detection |
| Digital PCR Integrated Machine | Sniper | DQ24 | Digital PCR Quantitative Detection |
| Digital PCR Integrated Machine | Ustar Biotechnologies (Hangzhou) Ltd. | DQ24 | Digital PCR Quantitative Detection |
| Digital Water Bath | Yiheng Scientific Instrument Co., Ltd. | DK-8D | Heat inactivation of bacterial suspensions at 56 °C |
| Forward primer | Sangon Biotechnology (Shanghai) Co., Ltd. | / | Digital PCR nucleic acid amplification |
| Gastric Helicobacter pylori Antigen Detection Kit (Colloidal Gold Method) | Shanghai Chemtron Biotech Co., Ltd. | B202301020 | H. pylori antigen detection |
| Helicobacter pylori Agar Medium (solid) | Qingdao Haibo Biotechnology Co., Ltd. | HB8647 | H. pylori culture medium |
| Helicobacter pylori antigen detection kit (colloidal gold method) | Bioneovan Co., Ltd. | 202403001 | H. pylori antigen detection |
| Helicobacter pylori antigen detection kit (colloidal gold method) | Jiangsu Mole Bioscience Co., Ltd. | 20240310 | H. pylori antigen detection |
| Helicobacter pylori antigen detection kit (colloidal gold method) | Hangzhou Genesis Biodetection & Biocontrol Ltd. | GG230601021 | H. pylori antigen detection |
| Helicobacter pylori antigen detection kit (colloidal gold method) | Jiangsu Cowin Biotech Co., Ltd. | 28223 | H. pylori antigen detection |
| Helicobacter pylori antigen detection kit (colloidal gold method) | Beijing Core Technology Co., Ltd. | 2415810 | H. pylori antigen detection |
| Helicobacter pylori antigen detection reagent (immunochromatographic method) | Guangzhou Wondfo Biotech Co., Ltd. | W028402001 | H. pylori antigen detection |
| Helicobacter pylori antigen detection reagent (latex method) | ABON Biopharm (Hangzhou) Co., Ltd. | 0000805308 | H. pylori antigen detection |
| Heracell Tri-Gas Incubator | Thermo Fisher Scientific | N/A | Microaerobic culture; gas composition: 5% O2, 10% CO2, 85% N2 |
| Microcentrifuge Tubes (1.5 mL / 2 mL) | Axygen Scientific Inc. | MCT-150-C / MCT-200-C | Sample dilution and nucleic acid extraction |
| Nucleic acid extraction or purification reagents | Jiangsu Bioperfectus Technologies Co., Ltd. | SDK60105 | Bacterial nucleic acid extraction |
| Nucleic acid extraction reagent | TargetingOne | Pathogens TNA-B1 (11019) | Bacterial nucleic acid extraction |
| PBS, 1X (pH 7.2-7.4, 0.01 M, cell culture) | Solarbio Science & Technology Co., Ltd. | P1020 | Sample dilution |
| Petri Dishes (90 mm) | Beekman Biotech | N/A | Sterile culture plates for bacterial isolation and subculture |
| Pipette Tips (10 uL / 200 uL / 1000 uL) | Axygen Scientific Inc. | T-300 / T-200-Y / T-1000-B | Sterile filtered tips for sample dilution and reagent dispensing |
| Probe | Sangon Biotechnology (Shanghai) Co., Ltd. | / | Digital PCR nucleic acid amplification |
| Reverse primer | Sangon Biotechnology (Shanghai) Co., Ltd. | / | Digital PCR nucleic acid amplification |
| SPSSPRO Online Statistical Analysis Platform | SPSSPRO | Web-based (https://www.spsspro.com/; accessed August 2026) | Statistical analysis: Pearson correlation, linear regression |
| Sterile Defibrinated Sheep Blood | Solarbio Science & Technology Co., Ltd. | TX0030-100 mL | Supplement for H. pylori culture plates |
| TD-1 Digital PCR System | TargetingOne | TD-1 | Digital PCR Quantitative Detection |
| Viability PCR Reagent System | Promega | A8881 | Viability PCR assessment of heat-inactivated H. pylori |
| Vortex Mixer | Scientific Industries Inc. | SI-0256 | Homogenization of bacterial suspensions |
References
- Ndip RN, et al. Helicobacter pylori isolates recovered from gastric biopsies of patients with gastro-duodenal pathologies in Cameroon: current status of antibiogram. Trop Med Int Health. 2008;13(6):848-54.
- Malfertheiner P, et al. Management of Helicobacter pylori infection: the Maastricht VI/Florence consensus report. Gut. 2022;71(9):1724-62.
- Hooi JKY, et al. Global prevalence of Helicobacter pylori infection: systematic review and meta-analysis. Gastroenterology. 2017;153(2):420-9.
- International Agency for Research on Cancer. Schistosomes, liver flukes and Helicobacter pylori. IARC Monogr Eval Carcinog Risks Hum. 1994;61:1-241.
- de Martel C, et al. Global burden of cancer attributable to infections in 2018: a worldwide incidence analysis. Lancet Glob Health. 2020;8(2):e180-90.
- Wang YK, et al. Diagnosis of Helicobacter pylori infection: current options and developments. World J Gastroenterol. 2015;21(40):11221-35.
- Hindson BJ, et al. High-throughput droplet digital PCR system for absolute quantitation of DNA copy number. Anal Chem. 2011;83(22):8604-10.
- International Organization for Standardization. ISO 17511:2020, In vitro diagnostic medical devices—requirements for establishing metrological traceability of values assigned to calibrators, trueness control materials and human samples. International Organization for Standardization; Geneva; 2020.
- Morisset D, et al. Quantitative analysis of food and feed samples with droplet digital PCR. PLoS One. 2013;8(5):e62583.
- World Health Organization. WHO international standard for SARS-CoV-2 RNA, NIBSC code 20/146. World Health Organization; Geneva; 2020.
- Forootan A, et al. Methods to determine limit of detection and limit of quantification in quantitative real-time PCR (qPCR). Biomol Detect Quantif. 2017;12:1-6.
- Johnson S, et al. Clinical practice guideline by the Infectious Diseases Society of America (IDSA) and Society for Healthcare Epidemiology of America (SHEA): 2021 focused update guidelines on management of Clostridioides difficile infection in adults. Clin Infect Dis. 2021;73(5):e1029-44.
- Hyams C, Williams OM, Williams P. Urinary antigen testing for pneumococcal pneumonia: is there evidence to make its use uncommon in clinical practice? ERJ Open Res. 2020;6(1):00223-2019.
- Marrero Rolon R, et al. Erratum for Marrero Rolon et al., “Clinical evaluation of a real-time PCR assay for simultaneous detection of Helicobacter pylori and genotypic markers of clarithromycin resistance directly from stool.” J Clin Microbiol. 2022;60(2):e0245221.
- China Food and Drug Administration. Technical review guidelines for registration of Helicobacter pylori antigen/antibody detection reagents. China Food and Drug Administration; Beijing; 2018.
- Clinical and Laboratory Standards Institute. EP17-A2, Evaluation of detection capability for clinical laboratory measurement procedures; approved guideline. 2nd ed. Clinical and Laboratory Standards Institute; Wayne, PA; 2012.
- Yamaoka Y, Graham DY. Helicobacter pylori virulence and cancer pathogenesis. Future Oncol. 2014;10(8):1487-500.
- Leal YA, et al. Utility of stool sample-based tests for the diagnosis of Helicobacter pylori infection in children. J Pediatr Gastroenterol Nutr. 2011;52(6):718-28.
- Devonshire AS, et al. The use of digital PCR to improve the application of quantitative molecular diagnostic methods for tuberculosis. BMC Infect Dis. 2016;16:366.