The work proposes an end-to-end multimodal emotion analysis framework that leverages transformer encoders, disentangled emotion representations, and graph-based cross-modal attention with visual mapping to improve emotion recognition accuracy across two datasets.
A subscription to JoVE is required to view this content. Sign in or start your free trial.
Research Article
Visual Mapping of Multimodal Emotion Features for Intelligent Interaction Design
In This Article
Summary
Abstract
By enabling machines to comprehend, interpret, and react to human affective states, visual mapping of multimodal emotion traits is crucial to intelligent interface design. Nevertheless, current multimodal emotion detection algorithms primarily focus on predictive performance, providing little insight into interpretability, interaction awareness, or feature-level cross-modal interactions. This work introduced a framework for the visual mapping of multimodal emotion aspects that combines interaction-oriented visualization, interpretable representation learning, and emotion prediction. Without using manually created features, transformer-based encoders were used to extract high-level emotion embeddings from textual, audio, and visual modalities. To improve robustness, emotion-specific and modality-specific information were separated using a disentangled representation learning technique. Additionally, a graph-based cross-modal attention network was created to use adaptive attention weighting to simulate subtle emotional relationships between modalities. A multi-view visual mapping module was created to depict temporal emotion trajectories, cross-modal attention distributions, and latent emotion embeddings in order to improve transparency. The Carnegie Mellon University Multimodal Opinion Sentiment and Emotion Intensity (CMU-MOSEI) dataset and the Chinese Multimodal Sentiment Analysis Dataset (CH-SIMS) were used to assess the suggested framework. According to experimental results, the suggested framework provided improved feature-level interpretability and interaction-aware visualization while consistently outperforming representative baseline techniques in terms of accuracy, F1-score, correlation, and mean absolute error. In addition, the visual mapping module facilitated qualitative interpretation of multimodal emotion representations, cross-modal interactions, and temporal emotion dynamics, supporting interaction-aware visualization and analysis.
Introduction
The ability to correctly identify and understand human sentiment has become crucial for improving interaction between humans and machines. In addition to being essential for improving human–computer interaction, emotion analysis has the potential to revolutionize a number of fields, including pre-diagnostic medical diagnosis1, classroom behavioral analysis2, patient psychological tracking3, fatigue identification in vehicles4, and intelligent management in smart home settings5. Recent developments in affective computing and deep learning6 have increased interest in creating real-time systems that can capture the intricacy of human emotion.
Many current methods primarily rely on unimodal data, such as textual, graphic, or auditory signs7,8,9. These approaches repeatedly fail to detect refined signals such as sarcasm or context-specific nuances. Research has moved to multimodal emotion evaluation, which incorporates complementary data from multiple sources to overcome these restrictions10,11,12. The advantages of merging multiple modalities have been demonstrated by baseline models such as early fusion-long short-term memory (EF-LSTM)13, light and FM deep neural networks (LF-DNN)14, tensor fusion networks (TFN), and low-rank multimodal fusion approaches. However, most of these approaches rely on offline feature generation and are not appropriate for dynamic, real-world situations.
In order to accommodate emotional states, multimodal emotion identification research and applications have grown within the past ten years15. One of the most challenging and significant areas of research nowadays is the continuous monitoring of emotional states using a variety of data sources16. The idea of multimodality emerged quite naturally with the emergence of such a varied knowledge system, and it has led to many advancements in the application of emotions in domains such as emotional computation, human-computer interaction (HCI), learning, video games, consumer service, medical care, user experience (UX) assessment, etc. However, it has not always been so simple to apply emotion recognition techniques in UX evaluation.
One of the primary reasons to focus on multimodal recognition rather than unimodal methods is the inherent disadvantages of relying on a single information source. Unimodal emotion detection systems can suffer from lower accuracy due to missing or unclear data, whereas MER schemes are more reliable and offer a more comprehensive, thoughtful understanding of expressive states by integrating multiple data sources17. For example, facial language alone may not be enough to precisely classify feelings, particularly when the gestures are complex or unclear. Though combining facial expressions with other forms of communication, such as language or physical cues, might increase the accuracy of feelings recognition.
Extensive research on emotion recognition has been conducted on several modalities. Early studies focused on identifying distinguishing features from different modalities, like graphic, acoustic, or text-based input. Though it is becoming increasingly evident that integrating various modalities can provide balanced emotional information, leading to more reliable and precise sentiment detection. This segment reviews key advances in single-modality and multimodal emotion analysis, focusing on baseline approaches, their shortcomings, and the rationale for our method.
The initial study on emotion recognition focused primarily on a single modality. In the visual area, groundbreaking research led to the categorization of prototypical facial movements20. Subsequent advancements included techniques for capturing temporal dynamics, such as visual movement21 and hidden Markov models22, while facial responses were divided into action units using the Facial Action Coding System (FACS)23. LSTMs and convolutional neural networks (CNNs) have been successfully used to extract meaningful features directly from raw audio signals; methodologies for audio-based emotion identification have advanced from conventional signal processing to deep learning24. The extraction of contextual sentiment signals in text-based emotion analysis has been greatly enhanced by recurrent neural networks (RNNs) incorporating attention mechanisms and, more recently, by transformer-based models. Although their achievements, unimodal techniques are intrinsically incapable of accurately representing the complexities that people experience because they lack the supplementary information found in other modes.
Some attention mechanism-based models, such as the DialogXL model25, were proposed in 2021 to gather longer-term environmental data in the area of conversational sentiment identification. Kim et al.26 introduced the EmoBERTa model in 2021 to increase the accuracy of ERC. This model uses speaker data to improve the features of speakers in conversations and their interactions with one another. In 2022, Li et al.27 presented the CoG-BART method. The organization uses supervised contrastive learning to improve the model's ability to interpret relevant data. It should be noted that supervised learning requires a substantial amount of labeled data.
A typical example of such work is the Multimodal Interaction-Aware Representation (MIAR) framework28, which uses feature interaction tokens and contrastive alignment to improve generalization across modalities. MIAR improves modality alignment and achieves strong performance across multiple datasets; however, it primarily focuses on predictive accuracy without addressing visual mapping. Similarly, the Cross-Attentional Audio-Visual Fusion model29 effectively captures fine-grained audio-visual interactions for valence and arousal prediction but is limited to two modalities and lacks visualization capabilities. Temporal modeling approaches based on LSTM networks and autoencoder fusion successfully capture temporal dynamics of emotions, yet provide limited insight into modality interactions and the learned emotional representations. More recently, transformer-based methods such as the Transformer-based Multimodal Fusion Network (TMFN)30 have demonstrated strong performance on CMU-MOSI and CMU-MOSEI through enhanced multimodal fusion and contrastive learning. Nevertheless, these approaches remain primarily performance-driven and offer limited support for explainability, feature-level interpretation, and interaction-oriented visualization.
To enhance the integration of textual, acoustic, and visual data, several multimodal emotion recognition techniques have been proposed. Although they were unable to capture intricate cross-modal interactions, early fusion techniques such as EF-LSTM and LF-DNN demonstrated the advantages of using multimodal information for sentiment and emotion analysis. Although the TFN improved performance on benchmark datasets like CMU-MOSI and CMU-MOSEI and introduced explicit modeling of inter-modal interactions, its limited interpretability and high computational complexity hindered its usefulness. To improve modality alignment and dynamic feature fusion, more modern techniques such as MIAR, cross-attentional fusion models, TMFN, and adaptive multimodal transformers have used transformer topologies and attention mechanisms. These methods primarily focused on predictive performance, offering little insight into feature-level emotional representations and cross-modal dependencies, despite achieving competitive results across common evaluation metrics such as accuracy, F1-score, and mean absolute error. Moreover, few studies have established visualization techniques that can disclose latent emotion embeddings, attention distributions, and temporal emotion dynamics, or they have integrated graph-based modeling of inter-modal interactions. The suggested approach incorporates multi-view visual mapping, graph-based cross-modal attention fusion, and disentangled representation learning to overcome these drawbacks and enhance multimodal emotion recognition performance.
Similarly, the Adaptive Multimodal Transformer32 proposes exchange-based fusion to adaptively mitigate noisy or missing modal information, thereby enhancing sentiment classification performance. Although this approach can effectively address discrepancies in the distribution of modal information, its design is task-specific to sentiment analysis and provides limited insight into the learned emotional representations. Another significant contribution is the Multimodal Fusion Model33, which integrates CNNs, multiplicative LSTMs, and transformer-based attention for real-time multimodal emotion recognition. The model performs full fusion on video, audio, and text modalities and shows robust recognition performance. Nevertheless, like other existing models, it primarily focuses on predictive accuracy and lacks explicit features for visualization and interaction-oriented interpretability.
In conclusion, while present state-of-the-art multimodal emotion recognition approaches have achieved considerable success in capturing cross-modal interactions and enhancing prediction accuracy, most of them are centered on recognition-driven tasks. The areas of feature-level interpretability, visualizing emotional representations in the image space, and incorporating the proposed framework for intelligent interaction design have received little attention. It is with these challenges in mind that the proposed framework is introduced.
The majority of current methods focus primarily on improving predictive performance while offering little interpretability of learned emotional representations and cross-modal interactions, despite notable advancements in multimodal emotion recognition28,29. Complex interactions among textual, acoustic, and visual modalities are frequently difficult for current fusion strategies to model, especially when modality discrepancies and information shortages occur 28,31. While transformer-based designs and attention mechanisms have enhanced representation learning, their transparency and interpretability are often diminished by the lack of explicit separation of emotion-specific and modality-specific information31,32,33. Additionally, only a small number of studies have investigated graph-based modeling of intermodal interactions or created visualization frameworks that can disclose temporal emotion dynamics, attention distributions, and emotion embeddings. These drawbacks demonstrate the necessity of an interpretable multimodal framework for intelligent human-machine interaction that combines interaction-oriented visual mapping with strong cross-modal learning.
This work presents an interpretable framework for visual mapping of multimodal emotion aspects in intelligent interface design. Without the need for manually created features, the system uses end-to-end deep learning to extract high-level emotional representations from textual, audio, and visual modalities. Cross-modal emotional interactions are modeled using a graph-based attention fusion mechanism that separates emotion-specific and modality-specific information, enabling disentangled representation learning and improving interpretability and robustness. Additionally, a multi-view visualization module is created to show temporal emotion dynamics, cross-modal attention patterns, and emotion embeddings. The efficacy and suitability of the suggested framework in intelligent human-machine interaction systems are evaluated through validation on benchmark multimodal emotion recognition datasets.
This work offers a unique framework for visual mapping of multimodal emotion aspects that goes beyond traditional prediction-oriented approaches to overcome the poor modeling of cross-modal interactions and the restricted interpretability in current multimodal emotion identification systems. Within a single architecture, the suggested approach combines transformer-based multimodal representation learning, disentangled emotion-aware feature modeling, graph-based cross-modal attention fusion, and interaction-oriented visualization. The framework clearly separates emotion-specific and modality-specific representations to improve interpretability, robustness, and cross-modal consistency, in contrast to current approaches that mainly concentrate on classification performance. Additionally, a graph-based attention mechanism is presented to enable adaptive modeling of inter-modal interactions by capturing fine-grained emotional interdependence among textual, audio, and visual modalities. A multi-view visual mapping module is created to increase transparency by revealing temporal emotion trajectories, cross-modal attention patterns, and latent emotion embeddings, which offer intuitive insights into the model's decision-making process. In addition to providing improved visualization and interpretability of multimodal emotional dynamics, experimental evaluation on the CH-SIMS and CMU-MOSEI benchmark datasets showed competitive performance in terms of accuracy, F1-score, mean absolute error, and correlation.
Access restricted. Please log in or start a trial to view this content.
Protocol
The proposed work aims to improve intelligent interaction design by offering an interpretable framework for visual mapping of multimodal emotion features. The CH-SIMS and CMU-MOSEI databases, which are accessible to the public, were used in this work. Both datasets were acquired from their official sources and utilized in compliance with the usage guidelines, research standards, and licensing terms set forth by their respective creators. The datasets' multimodal content, including text, audio, and video data, was first gathered and annotated by the dataset providers in accordance with their authorized participant permissions and data collection protocols. There was no direct human interaction, no recruiting of new participants, and no gathering of personally identifiable information in this study. Every analysis was conducted using publicly available research datasets. Consequently, our secondary data analysis did not require any further ethical approval or Institutional Review Board (IRB) review. The study was carried out in compliance with appropriate institutional norms controlling the use of publicly available datasets, ethical research procedures, and applicable data-use policies.
A graph-based cross-modal attention mechanism was employed to learn emotion characterizations across modalities using emotion- or modality-specific characteristics to improve understanding. A multi-view visual mapping component is used to enhance real-time emotion-aware interactive design, and its efficiency is estimated for emotion recognition. The findings show that the proposed method improves both interpretability and efficiency for emotion-aware intelligent user interfaces in the real world. Figure 1 shows the architectural workflow of the proposed work. Figure 1 shows the complete workflow of the suggested visual mapping framework for multimodal emotion feature learning in the context of intelligent interaction systems. The workflow starts with three synchronized input modalities, namely text, audio, and video, which capture complementary emotional information from the linguistic, prosodic, and facial expression modalities, respectively. A modality-specific transformer encoder processes each modality to obtain high-level representations of the raw input data. The representations are then fed into a disentangled representation learning module, where the emotion-specific embeddings are disentangled from the modality-specific features to ensure consistency in the learned emotions across heterogeneous data sources. The emotion-specific embeddings from each modality are then aggregated by a graph-based cross-modal attention network, which models the inter-modal emotional dependencies and assigns dynamic importance weights to each modality based on the interaction context. Finally, the framework provides both emotion classification outputs and interaction insights, which facilitate transparent emotion-aware decision-making and adaptive intelligent interaction design.
Multimodal data acquisition
The CH-SIMS and CMU-MOSEI datasets are two existing public-domain multimodal datasets that have collected multimodal information, such as synchronized video, audio, and text. The CH-SIMS dataset comprises multimodal examinations of Chinese people, including 2,281 video segments, derived from multiple video segments from movies, television dramas, and variety shows. Studies on multimodal analysis of emotions using multimodal data are made more engaging and feasible by the addition of corresponding audio and text to these video segments. However, one of the largest multimodal datasets for the examination of opinion, feelings, and emotion is the CMU-MOSEI dataset, which was collected from over 23,000 video clips of phrases spoken by over 1,000 speakers across a variety of topics. The dataset was randomly divided into training (70%), validation (15%), and testing (15%) subsets while preserving class distribution.
Textual transcriptions, audio signals, and video frames are obtained and timestamp-aligned to match at a fine-grained temporal level. Frame-level integration ensures that the proposed representation learning and graph-based fusion mechanisms can jointly model and leverage emotional content arising from visual expressions, vocal tones, and linguistic content. Effective extraction of inter-modal emotional dynamics is enabled by this type of multimodal acquisition technique, which is essential for intelligent interaction design and comprehensible visual mapping.
Table 1 presents the key structures of the multimodal emotion datasets used in the proposed method. To obtain a wider range of related feelings, such as spoken words, voice intonations, and facial expressions, CH-SIMS and CMU-MOSEI integrate video, audio, and text modalities from these datasets. Furthermore, a limited number of data samples are available in CH-SIMS, enabling a thorough examination of modality interactions and emotion variation in China. On the other hand, the CMU-MOSEI dataset is more important for evaluating the durability of the representation learning and related visualization algorithms covered in this work, as it contains a large amount of data across various languages, subjects, and annotated emotion levels. Additionally, compared to earlier research, it reduces difficulties in selecting information when testing models.
Multimodal preprocessing and synchronization
The timestamp annotations from the CH-SIMS and CMU-MOSEI datasets were used to synchronize textual, auditory, and visual modalities, ensuring consistent multimodal representation learning. Each utterance functioned as the fundamental analysis unit and was linked to matching audio and video segments within the same temporal interval. Alignment was carried out at the utterance level. The transcript was divided into segments based on the start and end timestamps of each utterance. Transcript-audio-visual correspondence was established by extracting the corresponding video frames and audio signals that fell within the same time interval. While audio segments were processed using Wav2Vec 2.0 to produce acoustic representations, visual frames from the video segment were sampled at a predetermined rate and encoded using the Vision Transformer (ViT). The RoBERTa encoder was used to create textual embeddings from the utterance transcripts. Temporal synchronization was achieved by aligning all modality features to a single utterance boundary, since the three modalities produced feature sequences of varying lengths. A fixed-length format was used to normalize sequences of varying lengths. Longer sequences were shortened to the maximum permitted sequence length, while shorter sequences were zero-padded. During training, attention masks were used to separate padded elements from legitimate feature positions. Modality-specific embeddings were projected into a common latent space prior to fusion in order to overcome different sequence lengths across modalities. This guaranteed dimensional consistency and made it possible for the graph-based attention mechanism to facilitate successful cross-modal interaction learning. To preserve data quality and synchronization integrity, samples with corrupted files, missing annotations, or incomplete modality information were excluded from the studies.
Transformer-based feature extraction
A deep learning method is used to learn high-level emotion-aware feature representations from information across multiple modalities, such as vision, audio, and text, in an end-to-end manner after aligning the multimodal data and any required preprocessing. By using a transformer encoder to learn intrinsically discriminative feature representations from raw multimodal data, the proposed method eliminates the need for feature engineering. To facilitate consistency across the datasets used in the proposed approach, a fixed-size embedding is learned for each modality. For example, 768-dimensional feature embeddings are learned across each of the individual modalities, including image, audio, and text modalities, collectively forming a unified feature space used across the entire approach, particularly a feature extraction approach used across the proposed CH-SIMS dataset and the CMU-MOSEI dataset to learn high-level features across data of various sizes.
Visual modality: Vision transformer for emotion-aware frame embeddings
A Vision Transformer (ViT-Base) model was used to extract visual information from video frames in order to obtain emotion-relevant spatial representations. Before extracting features, each video segment's frames were scaled to (224 × 224) pixels and sampled at regular temporal intervals. Using a patch size of 16 × 16 pixels, the ViT-Base architecture produces a series of visual tokens that are processed by 12 transformer encoder layers. The retrieved frame-level representations were projected into a 768-dimensional embedding space using a pretrained ViT model as the visual backbone. The frame-level embeddings were aggregated using mean pooling to create the final visual representation for each segment. During training, image normalization and common augmentation methods, such as random cropping and horizontal flipping, were used to enhance generalization. The suggested multimodal fusion framework was then used to combine these visual embeddings with textual and auditory representations.
To maintain temporal dynamics in emotion, video samples from the CH-SIMS and CMU-MOSEI datasets will be uniformly sampled for the visual modality. Each video's frames,  , can be split into N fixed-size sections, which are then flattened and inversely transferred to a latent embedding space with dimension
  . A series is created by adding positional embeddings and a learnable grouping token:
 (1)
(1)
where  stands for positional encoding and
  is the patch embedding matrix.
Stacked transformer encoder layers, composed of feed-forward networks and multi-head self-attention, are used to process the embedded patch sequence. The transformation at layer l is described as:
 (2)
(2)
 (3)
(3)
To obtain the emotion-aware visual feature vector, the output equivalent to the class token is extracted as the feature vector  . To address consistent visual emotion representations despite differences in language and content across datasets, frame-level embeddings from each video segment are combined to capture facial expressions and emotion evolution.
Audio modality using Wav2Vec 2.0 for prosody and semantic acoustic embeddings Contextualized speech embeddings were produced using a pretrained Wav2Vec 2.0 encoder as the acoustic backbone. A fixed-length acoustic feature vector for every phrase was obtained by aggregating the output hidden representations using mean pooling. The Wav2Vec 2.0 model was used to extract acoustic representations from audio signals to capture contextual and emotion-relevant speech characteristics. Before feature extraction, audio recordings were normalized and resampled to 16 kHz. To ensure synchronization between the textual and visual modalities, each utterance-level audio segment was isolated using the timestamp bounds provided by the dataset annotations. The pretrained acoustic encoder was adjusted during model training to enhance task-specific adaptation, enabling the derived representations to more accurately represent the emotional aspects of the speech signals. Graph-based cross-modal attention fusion and disentangled representation learning were then performed using the final audio embeddings.
In the audio modality, Wav2Vec-2.0 is used to model speech signals derived from initial speech information in the CH-SIMS and CMU-MOSEI datasets, directly extracting audio features related to emotion. A convolutional feature encoding exists for each input speech signal  :
:
 (4)
(4)
where Z stands for low-level prosodic traits like melody, tone, and energy. A transformer-based context network is useful to the aforementioned structures, representing long-range time-based dependencies:
 (5)
(5)
Prosodic and semantic acoustic data, which are essential for expressing emotion, are included in these contextual acoustic representations. A specific-length audio embedding is created by performing a temporal pooling procedure:
 (6)
(6)
The design avoids the use of acoustic features such as MFCCs and achieves durability using English speech data from CMU-MOSEI and Chinese speech data from CH-SIMS by simply extracting representations from waveforms.
Text Modality using RoBERTa for contextual emotion embeddings
For the textual modality, the deep bidirectional transformer, RoBERTa, is applied to the speech transcripts from the two data sets to generate contextual semantics and affective meaning. RoBERTa-based transformer encoders were used to extract textual representations from transcript data to capture contextual semantic and emotional information. A pretrained RoBERTa model was used for the English-language CMU-MOSEI dataset, whilst a Chinese RoBERTa variant was used for the Chinese CH-SIMS dataset to better account for language-specific linguistic features. Text preprocessing included tokenization using the appropriate RoBERTa tokenizer for each language and text normalization. To ensure consistent batch processing, input sequences were converted to token embeddings and either padded or trimmed to a predetermined maximum sequence length. In accordance with the RoBERTa input format, special classification and separator tokens were introduced. A fixed-length textual embedding was obtained by aggregating the contextualized token representations produced by the transformer encoder using the final [CLS]-equivalent sentence representation. To adapt the learned representations to the emotion recognition task, the pretrained RoBERTa encoders were refined through multimodal training. The suggested multimodal fusion framework was then used to merge the textual embeddings with the audio and visual characteristics.
The token embeddings and positional encodings can be combined for each tokenized input,  , to create the input representation in the deep bidirectional transformation technique known as
 (7)
(7)
This form is represented through the layers of the L transformer, which uses self-attention to discover the context dependencies among words:
 (8)
(8)
The contextual emotion embedding is obtained using the classification token's final hidden state:
![Equation depicting vector transformation, fₜ = Hᴸ[CLS], fₜ ∈ ℝ⁷⁶⁸, relevant to data analysis.](/files/ftp_upload/71171/71171eq16.jpg "figure-protocol-16") (9)
(9)
Sentiment polarity, intense emotions, and associated implications are examples of emotion-related linguistic characteristics that will be represented by this embedding. RoBERTa makes language-agnostic modeling easier. This enables the system to use the same embedding size for both English texts from the CMU-MOSEI dataset and Chinese texts from the CH-SIMS dataset.
Three modality-specific feature vectors of 768 dimensions, each visual fv, audio fa, and textual ft modalities are extracted by the suggested deep feature representation learning step. In the intelligent interaction design, these learned representations create a unified multimodal feature space that serves as the foundation for feature-level visual mapping, graph-based cross-modal fusion, and disentangled representation learning.
Disentangled representation learning
After learning a deep feature representation, additional processing of the multimodal feature vectors from the visual, auditory, and text modalities can yield a disjointed emotion description. If the modality-specific feature embeddings of the auditory, visual, and text modalities used in the prior step are represented by fv, fa and ft, accordingly, such that  and
and  , the objective of this step is to factorize all of the modality features into two distinct latent depictions, which include the emotion depictions after taking into consideration the previous semantics of each of the different modalities.
This is accomplished by feeding each modality feature, fm into two parallel projection networks: an emotion encoder  and a modality encoder
  , where the two encodings are produced.
 (10)
(10)
Where  the latent feature linked to the emotion is represented by
  represents a latent feature specific to a modality. This allows emotion-specific embeddings to communicate with a space repeatedly across multiple inputs, including audio, visual, and text, while maintaining the unique structural data associated with each modality.
An effective separation is enforced by reconstructing with independence constraints. The reconstruction of the original modality feature is given by:
 (11)
(11)
where  is a decoder network. The reconstruction loss preserves the following data:
 (12)
(12)
Additionally, orthogonality, or decorrelation, between emotion and modality-specific depictions often limits information overlap:
 (13)
(13)
By achieving these objectives, the model might learn emotion representations that are reliable, understandable, and resistant to modality variability. Later graph-based cross-modal fusion and visual-mapping features, especially for intelligent interaction design, rely heavily on interpretable, structured emotion representations.
Emotion consistency across modalities
The addition of emotion consistency clearly enhances the effectiveness of the fusion among the modalities. This is because fusion strategies do not need to account for large gaps between the two representations, since the modality-specific emotion embeddings share a latent space. The two emotions' combined illustration is described as follows  . Weighted fusion will be more stable when emotion-specific representations are consistent because variations between signals from various modalities will no longer have an impact on the result.
 (14)
(14)
By enforcing semantic alignment of emotional information, this goal minimizes discrepancies across modalities and ensures that emotion perception remains consistent regardless of the modality used to express it. Consequently, a cohesive and affective representation space is created by projecting emotional cues obtained from speech signals, facial expressions, and linguistic content.
Impact on cross-modal fusion
Cross-modal fusion becomes more effective when emotion consistency is introduced across modalities. Fusion mechanisms no longer have to make up for significant inter-modal representation gaps because the emotion-specific embeddings are aligned in a common latent space. The fused emotion representation is defined as follows:
 (15)
(15)
Where αm represents the weight of attention given to modality m. The weighted fusion becomes more stable and comprehensible when emotion-specific representations are consistent, as the fusion result shows complementary emotional evidence rather than contradictory modality signals.
Mathematically, lowering  variance between various emotion-specific representation types in relation to is equivalent to:
 (16)
(16)
where  represents the mean emotion expression. Reduced variance results in the input modalities being weighted according to their precise emotional significance rather than modality noise, ensuring improved network convergence and more accurate attention assessment.
The ultimate learning goal of disentangled emotion visualizations is to combine fragmentation, reconstruction, and emotion uniformity:
 (17)
(17)
which two hyperparameters, λ1 and λ2, control the relationship between cross-modal emotion reliability and disassociation. The suggested model acquires modality-invariant, interpretable, and fusible emotional representations to accomplish this, with an emphasis on providing a solid basis for later graph-based fusion and feature-level representation in intelligent interface design.
Graph-based cross-modal attention fusion
A graph-based cross-modal attention network was used to simulate fine-grained emotional relationships between modalities. To facilitate information flow across modalities, a fully connected multimodal graph was built, with each modality-specific embedding (text, audio, and visual) represented as a graph node. Modality relationships were used to establish the graph adjacency matrix, which was then improved via a learnable attention method. A shared latent space was created by concatenating and projecting the outputs from several attention heads. A unified multimodal emotion representation was then produced by aggregating node representations using attention-weighted pooling. The prediction and visualization modules for interaction-aware analysis and emotion recognition then received this fused representation. The graph-fusion module had a hidden representation dimension of 256 and two graph attention layers, each with eight attention heads. To ascertain the relative importance of nearby modalities, attention coefficients between connected nodes were calculated and standardized using the softmax function. Each graph-attention layer was followed by layer normalization, residual connections, and a dropout rate of 0.2 to increase training stability and reduce overfitting. After concatenating and projecting the outputs of several attention heads onto a common latent space, the node representations were combined into a single multimodal emotion embedding using attention-weighted pooling. After that, the fused representation was used for multi-view visual mapping and emotion prediction.
Diverse cross-modal interactions were captured using multi-head graph attention. The softmax function was used to normalize the attention coefficients between connected nodes for every node. To increase training stability and avoid overfitting, the graph fusion module's stacked graph-attention layers were followed by residual connections, layer normalization, and dropout regularization.
Let's, the terms individually, represent the representations corresponding to the particular emotions gathered by the visual, audio, and text modalities; each component resides within the shared latent space  . The models for the modality nodes use a notation for the graph
  , with the nodes of the collection
  equivacorresponding to the three modality nodes themselves, to explicitly strengthen the emotional dependencies shared among the various modality representations.
After assigning an emotion-specific feature vector to each node in the graph, we have:
![Static equilibrium equation \(H=[Z_v^e, Z_a^e, Z_t^e]^T \in \mathbb{R}^{3 \times a_e}\).](/files/ftp_upload/71171/71171eq45.jpg "figure-protocol-40") (18)
(18)
Unlike traditional fusion methods, which use predetermined or fixed fusion weights, the proposed method learns adaptive edge weights based on their significance and interdependencies, both across channels and across emotional situations.
A Graph Attention Network (GAT) is utilized for cross-modal fusion. An attention coefficient is computed for each node i and its neighboring nodes, i.e., node j:
 (19)
(19)
The emotional effect of switching from mode j to modality i is measured by the normalized weights αij.
Next, each modality node's fused appearance is computed as a weighted grouping of its neighbors:
 (20)
(20)
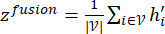
where the activation function  is non-linear. Ultimately, the updated features of each node are combined to obtain a global fused emotion representation:
 (21)
(21)
It is a useful technique for interpretable emotion modeling and subsequent visual mapping because it captures complementary information from various modalities while preserving intricate inter-modal relationships.
Algorithm 1 (Supplementary File 1) provides the general scheme to carry out the graph-based cross-modal fusion. Initially, a graph is created with the emotion-specific characteristics linked to each of the visual, audio, and textual modalities. The attention scores for each graph's node pairs, which represent the combination of emotional dependency, are then calculated. The attention scores are then normalized to indicate the relative contribution of each modality to the specified emotional context, enabling learning of the attention weights. The general emotion embedding is produced in the last stage by aggregating the features associated with the graph's nodes. In this sense, the algorithm's general fusion of the multimodal features linked to the specified emotions shows promise for adaptability, interpretability, and contextual intelligence.
Figure 2 shows the structure and working of the proposed cross-modal attention network for multimodal sentiment fusion. The emotion-specific embeddings, derived independently for the text, auditory, and video modalities, are initially passed through modality-level attention mechanisms that learn the relative importance of linguistic, vocal, and facial information for a given emotional context. The attention-weighted representations of the modalities are then combined to form a unified emotion embedding, in which the attention matrix captures the inter-modal dependencies and interaction strengths. The attention matrix learned by the network dynamically modulates the contributions of the modalities, enabling it to focus on its strongest instructional modality while ignoring noisy, less informative ones. The fused emotion representation enables accurate emotion recognition and fine-grained analysis of emotional states such as neutral, embrace, and worry.
Visual mapping module
With the assistance of the visual mapping section, created specifically for this purpose, an intelligent interaction designer can convert the unified representation of the emotive state into a visual form that is understandable and readily consumable after the cross-modal fusion process, based on the graph.
To make it easier to grasp latent emotional representations, dimensionality-reduction techniques were used to visualize the learned multimodal emotion embeddings. After reducing feature dimensionality while maintaining most of the variance using Principal Component Analysis (PCA), the embeddings were projected into a two-dimensional space for display using t-distributed Stochastic Neighbor Embedding (t-SNE). A perplexity number of 30, a learning rate of 200, and 1,000 optimization iterations were used for t-SNE. Emotion-specific clusters and modality relationships were visualized using the obtained projections. The normalized cross-modal attention weights obtained by the graph-based attention network were used to create attention heatmaps. The relative contributions of textual, audio, and visual modalities during emotion prediction are depicted in these heatmaps. The learned attention coefficients were used as edge weights to create cross-modal interaction graphs, which allowed for the visual examination of inter-modal relationships and information flow inside the fusion framework. Emotion trajectory plots were created by monitoring the development of latent emotion embeddings across successive utterances to examine temporal emotional dynamics. These trajectories shed light on how emotional states and modality contributions evolve throughout time. Matplotlib and Scikit-learn are two Python packages used to create all the visuals. To evaluate interpretability, cluster formation, modality contributions, and temporal emotion dynamics, qualitative analyses of embedding visualizations, interaction graphs, and attention heatmaps were conducted.
Let the variable  represent the fused representation of the emotive state by the graph attention network function. In contrast to the output-level visualization of the emotive state plots, the module's main goal is to convert the emotive state representations and the corresponding weights of the attention mechanism into a comprehensible visual form.
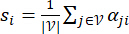
Using the learned αji, an attention heatmap is created to visually examine each modality's contribution. The incoming attention weights are then added together to determine a composite importance score for each modality:
 (22)
(22)
where si represents modality I's relative emotional contribution. To help create an attention heatmap, the obtained values are normalized and mapped to a color map that makes it easy for the user to identify the prominent modality at various time steps or interactive states. Through various visual, auditory, or textual input modalities, such an interface helps the user understand how the system's attention mechanism operates.
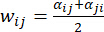
The learned graph is specifically modeled as a "weighted interaction graph" to represent the cross-modal dependency of human emotions. The modality itself is represented by each node in the graph, and the strength of the interactions involving human emotions is represented by weights in the form of αji on the edges that connect them. The weighted graph above illustrates the intensity of human emotional interactions. The definition of i and j is:
 (23)
(23)
The graph visualization's line thickness or transparency is appropriately displayed thanks to these weights. This makes it easier to understand how the modalities interact. The designer can better understand how emotional indicators interact during the fusion process with the assistance of cross-modal interaction graphs.
The fused emotion embeddings  at various time steps are reduced to a lower-dimensional space by means of a dimensionality reduction algorithm such as PCA or t-SNE in order to display the evolution of temporal emotions:
 (24)
(24)
where the projection function is represented by  . The emergence of 2D/3D emotion trajectories, which show emotion transitions, intensities, and stability in interactions, can be interpreted as an intuitive depiction of the evolution of emotional states over time. These aspects can be used for intelligent interaction, decision-making, and real-time monitoring.
Unlike conventional emotion systems that merely provide mappings to particular classes or scores, this system focuses on demonstrating how human emotions form within it. It reveals its decision-making process by offering visualizations of intermediate features, including weighing factors, interactions between models, and their corresponding paths. This allows the user to comprehend how each factor—visual, vocal, or linguistic affects it in producing its responses to human emotion.
Mapping emotions to comprehensible forms through visual representations can thus bridge the gap between emotion analysis using deep learning methods and their integration for intelligent interface design. The data gathered from both approaches can then be used to create more precise user interfaces. Thus, the suggested approach can give interaction designers vital information to create more precise user interfaces. To put it another way, emotion comprehension becomes a very active part of interaction design. Accuracy can only increase when emotion comprehension is actively incorporated into interaction design.
The visual mapping module makes explainability possible in a number of interconnected but different ways: feature-level explainability reveals underlying representations of emotion created by the DNN, enabling us to comprehend the semantics used to describe each feature related to emotion; modality-level explainability uses data from the interaction graphs and the visual attention heatmaps to describe how each modality visual, audio, or textual contributes to the decisions made to express emotions; and finally, the trajectories resulting from the emotion embedding allow us to understand how each visual and textual modality changes over time from a dynamic interaction perspective. Please refer to Algorithm 2 (Supplementary File 1).
The fused multimodal emotional features are mapped to visually significant representations for intelligent interaction design using the suggested visual mapping Algorithm 2. The graph-based multimodal attention weights are used to quantify differences across the input visual, audio, and textual elements at each time step. These differences are then mapped to visual representations to highlight the main sources influencing the emotions using heatmap visual elements. To provide an insightful view of the interaction between the input elements and convey the emotional evolution generated by the multimodal input elements, it then computes pairwise interaction strengths to create the multimodal interaction weights. In the meantime, a view of emotional evolution is created by mapping the fused emotional elements gathered over time into a low-dimensional space to produce a continuous emotional element evolution.
Emotion prediction and interaction feedback
The outcome of the fused emotion representation, represented as , is then utilized as a function for both interaction feedback and emotion prediction. Furthermore, emotion prediction is described as a multitask model comprising a regression task for continuous emotion intensity recognition and a classification task for discrete emotion recognition. The following softmax-based classification model is used for discrete emotion recognition:
 (25)
(25)
where  represents the expected emotion class probabilities and Wc and bc are learnable constraints. The cross-entropy loss is utilized to enhance the classification objective:
 (26)
(26)
where yk is the ground-truth tag, and K is the number of emotion classes. A regression branch is used to estimate emotion intensity in parallel, producing a prediction of various continuous affective attributes, including valence and arousal. Give it the following definition:
 (27)
(27)
where the expected emotion intensity score is indicated by  . Mean-squared error loss is used to enhance the regression task:
 (28)
(28)
In general, the two tasks are combined in the prediction objective:
 (29)
(29)
where the objectives of regression and classification are balanced by λ. It suggests dynamic modification of the visualization module based on the identified emotion state to enable this type of interaction-aware feedback. The interaction context at a given time t is represented by ct. The visualization module's response is provided by:
 (30)
(30)
where the visualization adaptation function is represented by  . This makes it possible to adjust the modality heatmaps, interaction graphs, and emotion trajectories in real time based on anticipated changes and emotions. This indicates that the system provides substantial support for feedback in addition to performing well on emotion-state prediction.
Access restricted. Please log in or start a trial to view this content.
Results
This work validates the proposed visual mapping framework for multimodal emotion features in terms of both interaction-aware interpretability and predictive performance, using two benchmark datasets, CH-SIMS and CMU-MOSEI. According to experimental results, the suggested approach consistently performs better than current multimodal emotion recognition techniques across a variety of metrics, including correlation, accuracy, F1-score, and mean absolute error (MAE). The disentangled emotion representation, the graph-based c...
Access restricted. Please log in or start a trial to view this content.
Discussion
The experimental findings demonstrate that, across the CH-SIMS and CMU-MOSEI datasets, the proposed visual mapping framework for multimodal emotion characteristics outperforms current multimodal emotion recognition techniques. Compared with early and late fusion models, such as EF-LSTM and TFN, the proposed technique achieves higher accuracy and F1 Scores, demonstrating its robustness in handling diverse emotional information. The improvement in the method can be attributed to the disentangled emotion representation, whi...
Access restricted. Please log in or start a trial to view this content.
Disclosures
The authors have no conflicts of interest.
Acknowledgements
The authors would like to acknowledge the support provided by the School of Housing, Building and Planning, Universiti Sains Malaysia, Penang, Malaysia, and the School of Design Art, Changsha University of Science & Technology, Changsha, China. The authors also express their appreciation to the Xiamen Academy of Arts and Design, Fuzhou University, Xiamen, China, for their academic and research support throughout this work.
Access restricted. Please log in or start a trial to view this content.
Materials
| Name | Company | Catalog Number | Comments |
|---|---|---|---|
| Adam | PyTorch Optimizer Library | https://pytorch-optimizers.readthedocs.io/en/latest/ (Learning Rate = 1 × 10⁻⁴) | Parameter optimization during model training |
| CH-SIMS | Original Dataset Repository | Latest Public Release | Benchmark dataset for Chinese multimodal sentiment/emotion analysis |
| CMU-MOSEI | CMU Multimodal SDK Repository | https://github.com/CMU-MultiComp-Lab/CMU-MultimodalSDK (Latest Public Release) | Benchmark dataset for multimodal sentiment and emotion recognition |
| Disentangled Emotion Encoder | Custom Implementation | https://pytorch-geometric.readthedocs.io/en/latest/(Dual Encoder Architecture) | Separation of emotion-specific and modality-specific latent representations |
| Graph Attention Network (GAT) | PyTorch Geometric | Multi-head GAT (https://pytorch-geometric.readthedocs.io/en/latest/) | Modeling cross-modal emotional relationships and adaptive feature fusion |
| Graph-Based Cross-Modal Attention Layer | Custom Implementation | Multi-Head Attention Fusion | Learning fine-grained emotional dependencies among modalities |
| Matplotlib | Matplotlib Project | 3.7+ | Generation of plots and visual analytics |
| NetworkX | NetworkX Project | 3.0+ | Construction and visualization of cross-modal interaction graphs |
| NVIDIA GPU | NVIDIA Corporation | CUDA-enabled GPU | Acceleration of transformer and graph neural network training |
| Principal Component Analysis (PCA) | Scikit-learn | sklearn.decomposition.PCA | Initial reduction of high-dimensional emotion embeddings |
| Python | Python Software Foundation | 3.8+ | Core programming language for implementing the multimodal emotion analysis framework |
| PyTorch | PyTorch Foundation | 2.0+ | Development, training, and optimization of deep neural networks |
| RoBERTa | Hugging Face Transformers | https://huggingface.co/docs/transformers/index (roberta-base, 768-dim embeddings) | Extraction of contextual linguistic and semantic emotion representations |
| Seaborn | Seaborn Project | 0.12+ | Generation of attention heatmaps and statistical visualizations |
| t-distributed Stochastic Neighbor Embedding (t-SNE) | Scikit-learn | scikit-learn.org (Perplexity = 30, Iterations = 1000) | Visualization of latent emotion clusters and trajectories |
| Ubuntu Linux | Canonical Ubuntu | 20.04 LTS or later | Experimental execution environment |
| Vision Transformer (ViT-Base) | Google Research Vision Transformer | ViT-Base/16, 768-dim embeddings | Extraction of emotion-aware visual representations from video frames |
| Wav2Vec 2.0 | Meta AI Research | Base Model, 768-dim embeddings | Extraction of contextual acoustic and speech emotion features |
References
- Zhu X, et al. EMVAS: End-to-end multimodal emotion visualization analysis system. Complex Intell Syst. 2025;11:1-15.
- Zhu X, et al. A client-server based recognition system: Non-contact single/multiple emotional and behavioral state assessment methods. Comput Methods Programs Biomed. 2025;260:108564.
- Lasri I, Riadsolh A, Elbelkacemi M. Facial emotion recognition of deaf and hard-of-hearing students for engagement detection using deep learning. Educ Inf Technol. 2023;28:4069-4092.
- Saibene A, Assale M, Giltri M. Expert systems: Definitions, advantages and issues in medical field applications. Expert Syst Appl. 2021;177:114900.
- Poria S, Cambria E, Bajpai R, Hussain A. A review of affective computing: From unimodal analysis to multimodal fusion. Inf Fusion. 2017;37:98-125.
- Chatterjee R, et al. Real-time speech emotion analysis for smart home assistants. IEEE Trans Consum Electron. 2021;67(1):68-76.
- Zhu X, Huang Y, Wang X, Wang R. Emotion recognition based on brain-like multimodal hierarchical perception. Multimed Tools Appl. 2024;83:56039-56057.
- Khan M, El Saddik A, Alotaibi FS, Pham NT. AAD-Net: Advanced end-to-end signal processing system for human emotion detection and recognition using attention-based deep echo state network. Knowl Based Syst. 2023;270:110525.
- Chaturvedi I, Chen Q, Cambria E, McConnell D. Landmark calibration for facial expressions and fish classification. Signal Image Video Process. 2022;16:377-384.
- Li D, Liu J, Yang Z, Sun L, Wang Z. Speech emotion recognition using recurrent neural networks with directional self-attention. Expert Syst Appl. 2021;173:114683.
- Zhu X, et al. A review of key technologies for emotion analysis using multimodal information. Cogn Comput. 2024;16:1504-1530.
- Wang R, et al. Multimodal emotion recognition using tensor decomposition fusion and self-supervised multitasking. Int J Multimed Inf Retr. 2024;13:39.
- Fan C, Lin J, Mao R, Cambria E. Fusing pairwise modalities for emotion recognition in conversations. Inf Fusion. 2024;106:102306.
- Williams J, Kleinegesse S, Comanescu R, Radu O. Recognizing emotions in video using multimodal DNN feature fusion. Proceedings of Grand Challenge and Workshop on Human Multimodal Language. Melbourne, Australia. 2018;10.18653/v1/W18-3302.
- Zhao Z, Wang Y, Wang Y. Multi-level fusion of Wav2Vec 2.0 and BERT for multimodal emotion recognition. arXiv. 2022;arXiv:2207.04697.
- Middya AI, Nag B, Roy S. Deep learning based multimodal emotion recognition using model-level fusion of audio-visual modalities. Knowl Based Syst. 2022;244:108580.
- Maithri M, et al. Automated emotion recognition: Current trends and future perspectives. Comput Methods Programs Biomed. 2022;215:106646.
- Wu Y, Mi Q, Gao T. A comprehensive review of multimodal emotion recognition: Techniques, challenges, and future directions. Biomimetics. 2025;10(4):418.
- Zheng S, Zhang X, Liu Y, Li Z. CMFF: A cross-modal multi-layer feature fusion network for multimodal sentiment analysis. Appl Soft Comput. 2025;184(Pt B):113868.
- Yan L, Shi Y, Wei M, Wu Y. Multi-feature fusing local directional ternary pattern for facial expressions signal recognition based on video communication system. Alex Eng J. 2023;63:307-320.
- Guo X, Zhang Y, Lu S, Lu Z. Facial expression recognition: A review. Multimed Tools Appl. 2024;83(8):23689-23735.
- Liu ZT, Han MT, Wu BH, Rehman A. Audio emotion recognition based on convolutional neural network with attention-based bidirectional long short-term memory network and multitask learning. Appl Acoust. 2023;202:109178.
- Mirsamadi S, Barsoum E, Zhang C. Automatic audio emotion recognition using recurrent neural networks with local attention. 2017 IEEE International Conference on Acoustics, Speech and Signal Processing (ICASSP), New Orleans, LA, USA. 2017; 10.1109/ICASSP.2017.7952552.
- Gu T, He Z, Zhao H, Li M, Ying D. Aspect-based sentiment analysis with multi-granularity information mining and sentiment hint. Expert Syst Appl. 2024;252:124104.
- Shen W, Chen J, Quan X, Xie Z. DialogXL: All-in-one XLNet for multi-party conversation emotion recognition. Proc AAAI Conf Artif Intell. 2021;35(15):13789-13797.
- Kim T, Vossen P. EmoBERTa: Speaker-aware emotion recognition in conversation with RoBERTa. arXiv. 2021;arXiv:2108.12009.
- Li S, Yan H, Qiu X. Contrast and generation make BART a good dialogue emotion recognizer. Proc AAAI Conf Artif Intell. 2022;36(10):11002-11010.
- Zhu J, Yu J. MIAR: Modality interaction and alignment representation fusion for multimodal emotion. arXiv. 2026;arXiv:2601.02414.
- Praveen RG, Granger E, Cardinal P. Cross attentional audio-visual fusion for dimensional emotion recognition. 2021 16th IEEE International Conference on Automatic Face and Gesture Recognition (FG 2021), Jodhpur, India. 2021;10.1109/FG52635.2021.9667055.
- Salas-Cáceres J, López M, Martínez A, Rodríguez P. Multimodal emotion recognition based on a fusion of audio-visual information with temporal dynamics. Multimed Tools Appl. 2025;84:27327-27343.
- Fu J, Zhang Y, Wang L, Chen H. TMFN: A text-based multimodal fusion network with multi-scale feature extraction and unsupervised contrastive learning for multimodal sentiment analysis. Complex Intell Syst. 2025;11:133.
- Tuerhong G, Fu F, Wushouer M. Adaptive multimodal transformer based on exchanging for multimodal sentiment analysis. Sci Rep. 2025;15:27265.
- Gupta C, Sharma R, Patel S, Verma A. A multimodal fusion model for real-time environment emotion recognition using audio-visual-textual features. J Big Data. 2025;12:256.
- Yu W, Li X, Zhang H, Wang Z, Liu Z. CH-SIMS: A Chinese multimodal sentiment analysis dataset with fine-grained annotation of modality. Proceedings of the 58th Annual Meeting of the Association for Computational Linguistics. 2020; 10.18653/v1/2020.acl-main.343.
- Zadeh A, et al. Multimodal language analysis in the wild: CMU-MOSEI dataset and interpretable dynamic fusion graph. Proceedings of the 56th Annual Meeting of the Association for Computational Linguistics, Melbourne, Australia. 2018; 10.18653/v1/P18-1208.
- Zadeh A, Chen M, Poria S, Cambria E, Morency LP. Tensor fusion network for multimodal sentiment analysis. arXiv. 2017;arXiv:1707.07250.
- Tsai YHH, Bai S, Yamada M, Morency LP, Salakhutdinov R. Multimodal transformer for unaligned multimodal language sequences. Proceedings of the 57th Annual Meeting of the Association for Computational Linguistics, Florence, Italy. 2019; 10.18653/v1/P19-1656.
- Moreno M, Rioseco P, Van Den Bosch H. Spectrum of the linearized Vlasov–Poisson equation around steady states from galactic dynamics. arXiv. 2023;arXiv:2305.05749.
Access restricted. Please log in or start a trial to view this content.