Here, we present a protocol for assessing aortic intrinsic wall stiffness (elastic modulus) via pin myography and approaches to interrogate the potential role of the circulating milieu in modulating aortic intrinsic wall stiffness.
Method Article
Assessing Murine Aortic Intrinsic Stiffness Using Pin Myography: A Translational Framework For Interrogating The Influence of the Circulating Milieu
In This Article
Summary
Abstract
Aortic stiffening is an independent risk factor for cardiovascular disease and other chronic conditions, including cognitive decline, kidney dysfunction, vision impairment, and reduced glucose–insulin function. In vivo, aortic stiffness is commonly assessed using tonometry- or ultrasound-based techniques that visualize arterial waveforms or longitudinal arterial segments, respectively. However, in vivo measurements are influenced by multiple factors—such as arterial pressure and autonomic input—which limit mechanistic insight into how and why aortic stiffness changes. Preclinical murine models, which permit direct acquisition of aortic tissue, offer a unique experimental framework to assess both in vivo aortic stiffness and the intrinsic mechanical properties of the aorta, free from confounding physiological variables. These models also enable direct interrogation of the circulating milieu (i.e., collection of circulating bioactive molecules in the bloodstream) and its role in modulating aortic stiffness across the preclinical-to-clinical translational spectrum. Alterations in the circulating milieu have emerged as a key mechanistic underpinning of aortic stiffening in numerous conditions—including primary aging and premature aging associated with cancer and cancer therapies—across both preclinical and clinical studies, as well as in mediating the effects of interventions. This article provides a step-by-step guide for assessing: (1) intrinsic aortic stiffness (elastic modulus) in preclinical murine models, and (2) the contribution of the circulating milieu (and its constituents) to aortic stiffening using both preclinical and clinical biospecimens.
Introduction
Aortic stiffening is an independent risk factor for cardiovascular disease and other chronic diseases1,2. Assessment of aortic stiffness in vivo can lack mechanistic resolution, given the integrative physiological processes that regulate the stiffness of the aorta in vivo (e.g., blood pressure and autonomic input)2. As such, assessment of aortic intrinsic stiffness (i.e., aortic wall stiffness/elastic modulus) ex vivo using pin myography allows the opportunity for direct assessment of aortic stiffness independent of confounding physiological variables2. Moreover, the use of an ex vivo experimental approach allows for the interrogation of potential molecular mechanisms that may mediate aortic wall stiffening. In contrast to other established methods for assessing arterial stiffness ex vivo, such as pressure myography, biaxial planar testing and cyclic/pulsatile myograph systems, which rely on physiological systems modeling (e.g., intraluminal pressure and pulsatile hemodynamics), pin myography allows for the direct assessment of aortic wall stiffness via isometric force, under highly controlled settings that do not require in vivo modeling.
The circulating milieu (i.e., collection of bioactive molecules in the blood stream), which comes in direct and frequent contact with the aorta, is commonly altered in settings of aortic stiffening (e.g., chronological/primary aging and premature aging, such as in cancer survivors or models of cancer survivorship)3,4. We have established, using both preclinical (murine) and clinical (human) biospecimens (plasma and serum), that the circulating milieu directly contributes to aortic stiffening with both primary4 and premature aging3. Moreover, we established an experimental framework for determining the direct contribution(s) of select constituents within the circulating milieu in mediating its effect on aortic stiffening3,5,6. Here, we outline and describe the step-by-step experimental approaches for assessing aortic intrinsic stiffness and the contribution of the circulating milieu (and its constituents) to aortic stiffening using pin myography and provide representative results (with figures and citations).
Protocol
Male wild-type C57BL/6J young adult (4 months of age) mice were used throughout this study. Housing and procedures involving experimental mice were approved by the University of Colorado Anschutz Medical Campus Institutional Animal Care and Use Committee (IACUC).
1. Preparation of cold physiological saline solution (CPSS)
- Prepare Ca2+ Ringer's Stock Solution in 1 L of diH2O and store at 4 °C (Table 1).
- Add 13.9 g of MOPS in 100 mL of diH2O to prepare the MOPS buffer stock solution and store at 4 °C.
- Add 0.186 g of EDTA in 100 mL of diH2O to prepare the EDTA stock solution, pH to 8.0, and store at room temperature.
- Prepare CPSS containing stock solutions prepared above and the chemicals listed below (Table 2). Bring the total volume to 2 L with diH2O, pH to 7.4 at 34 °C, and filter CPSS through a ≤ 0.45 µm filter. Distribute in 50 mL conical tubes and store in -20 °C.
2. Dissection of the mouse aorta (Figure 1, Figure 2, and Figure 3)
- Anesthetize the mouse by inhaled isoflurane (2.5%) and place the mouse in a dorsal recumbent position (Figure 1A-C).
- Once the mouse is under the surgical plane of anesthesia, collect blood by performing a cardiac puncture and complete secondary euthanasia method by bilateral thoracotomy (Figure 1B–C).
- Next, carefully remove the aorta from the aortic arch to the abdominal aorta (Figure 1D–F).
- Place the aorta in CPSS and remove all connective and perivascular adipose tissue using Fine Science Tools Vannas Spring Scissors (2.5 mm) (Figure 2A–E).
- Carefully cut three 1 mm wide aortic segments in the thoracic region just below the aortic arch (Figure 3).
- Place the two 1 mm aortic segments in a 1.5 mL tube filled with CPSS and store in -80 °C until stress-strain pin myography experiments. Store the 3rd segment appropriately for subsequent histological measurements as described below.
3. Stress-strain pin myography experiments
NOTE: The Pin Myography System will be used to perform in vitro testing of aortic stiffness (Figure 4 and Figure 5).
- First, pre-heat the chambers to 37 °C containing approximately 6 mL of phosphate-buffered saline (PBS) and thaw 1 mm frozen aortic segments.
NOTE: Alternative physiological salt solutions that are appropriately oxygenated and pH-controlled may also be used as described previously7. - Once 37 °C is obtained, follow the manufacturer's calibration protocol.
- Place the calibration bridge on the myograph so that the T-balance bar does not touch the pin connected to the force transducer of the pin myography chamber.
- Ensure the force transducer pin is not subject to any force. When the relative force is stable, place a 2 g weight on the T-bridge so that the T-balance bar is now applying ~2 g of force on the force transducer pin.
- Confirm that the force readout is within 9.71–9.91 mN. If so, calibration is complete.
- Determine baseline micrometer reading and record value (i.e., initial reading).
- Under a dissection scope, determine the baseline micrometer distance at which the two parallel pins are nearly touching (Figure 4).
NOTE: Do not allow the two pins to touch, as this could cause damage or disrupt the force transducer within the myograph chamber.
- Under a dissection scope, determine the baseline micrometer distance at which the two parallel pins are nearly touching (Figure 4).
- Under a dissection microscope, place 1 mm aortic segment over the two pins and record the width of the segment using micro calipers (Figure 6A). Then connect the chamber unit to the pin myography system interface.
NOTE: Increase the pin width to place tension on the aorta segment while mounting the aorta to secure it onto the two pins, which prevents the aorta segment from being dislodged. - If tension is placed on the aorta and the chamber has been connected and mounted on the pin myography system, return the micro positioner to the "initial position" as determined in step 3.3 above.
- Complete pre-stretch of the aorta.
- Stretch the aorta by increasing the distance between the two pins by 1 mm from the initial micro positioner position (Figure 6B).
- Next, relax the aorta by returning the pins to the initial micro positioner reading. Perform this stretch-relax sequence three times (Figure 6A).
NOTE: Following the last stretch-relax sequence, the micro positioner should be back to the initial reading.
- On the pin myography system interface, zero force reading for each chamber in use (Figure 7).
- Commence stress-strain experiment.
- Increase the force reading to approximately 1 mN by adjusting the micro positioner (Figure 7).
- Following ~1 mN force equilibration (3–5 s), record the new micro positioner reading at the ~1 mN force and record the first force reading.
- Increase the micro positioner by 50 µm (i.e., 5 clicks/hashes) and allow the aorta segment to be stretched for 3 min. Following 3 min, record force.
- Continue increasing the micro positioner 50 µm every 3 min and record force until "yield point" is reached.
NOTE: Yield point is the highest amount of force generated before irreversible structural damage occurs on the aorta (i.e., a tear or break in the aorta, a significant drop in force). - Confirm the yield point by stretching the aorta an additional 50 µm following the initial yield point. Ensure that the force value remains decreased or is slightly above the yield point. If the yield point is not confirmed, continue with 3 min increases until the yield point is achieved.
- Upon confirmation of the yield point, experiments are complete. Begin analysis now.
4. Analysis of stress-strain pin myography experiments to determine collagen and elastin region elastic modulus
- Using the force readings obtained from the myograph, generate a stress-strain curve using the following equations:
Strain (λ)=∆d/[d(i)]
here d is the diameter and di is the initial diameter and;
Stress (t)=λL/[2(HD)]
where L is one-dimensional load, H is intima media thickness, and D is vessel length. Once the stress-strain curves are generated, use them to calculate the high-force and low-force regions as described previously8,9 (Figure 8). - Calculate the high force region (Collagen Region) (Figure 8B).
- Determine the elastic modulus of the stress-strain curve as the slope of the linear regression fit to the final four points of the stress-strain curve. To obtain the high-force measurement from the stress-strain graph, follow the steps below.:
- Right-click a data point on the graph and select Select data > Add > Enter series name: Elastic modulus.
- Series X values: Select 4 data points from the strain values. These should be the 3 points as the force approaches the "yield point". Make sure to include the yield point as the fourth point.
- Series Y values: Select 4 data points from the stress values. These should be the 3 points as the force approaches the "yield point". Make sure to include the yield point as the fourth point.
- Click OK and Add Trendline > Linear > Display Equation on chart > Display R-squared value on chart.
- The slope of the equation is the high force elastic modulus. Ensure the R-squared value is ≥ 0.99 for the elastic modulus to be accurate.
- Determine the elastic modulus of the stress-strain curve as the slope of the linear regression fit to the final four points of the stress-strain curve. To obtain the high-force measurement from the stress-strain graph, follow the steps below.:
- Calculate the low force region (elastin region) (Figure 8C)
- Determine the boundaries of the elastin-dominant region (low force region where curvature is ~0) of the stress–strain curve by fitting a seventh-order polynomial equation to the data (r2 > 0.99) and then calculating the roots of the equation. Consider the first root, the boundary between the very low-force region and the elastin region, and the second root, the boundary between the elastin region and the onset of collagen fiber engagement.
- Then determine the modulus of elasticity of the low-force region as the slope of a linear equation fit to the stress-strain data between the two roots8,9. To obtain this:
- Make a spreadsheet that contains columns as illustrated in Supplementary Table 1.
- Turn this into a "txt" document and open it in the R code software "Modulus of Elasticity" R script.
- In order to use the data, check for normal slopes- the 3rd derivative graph on the R output should be shaped like "M".
- In the results tab, the numeric value under the Slope column is the modulus of elasticity. Make sure the R-squared value is greater than or equal to 0.99 for the modulus of elasticity to be accurate.
- To get this value on the spreadsheet, select the strain values (and their corresponding stress values) between the first and the second derivative obtained from the R code results tab.
- Follow the steps outlined in step 4.2 to obtain the equation and the R2 value on the spreadsheet graph.
5. Assessment of aortic diameter and wall thickness
- Place the last 1 mm aortic segment in a cryomold filled with optimal cutting temperature (OCT) compound. Orient the ring with the lumen flat and centered at the bottom of the mold with the luminal axis perpendicular to the cutting surface to obtain transverse sections.
- Prepare a container of 2-methylbutane cooled in liquid nitrogen and then submerge the cryomold in cold 2-methylbutane until OCT turns opaque white.
- Store the cryomold in -80 °C until sectioning. Set cryostat temperature to the appropriate OCT cutting temperature (≈-20 °C) and then mount the frozen block onto the specimen holder.
- Once fixed to the mount, carefully trim the block while keeping the thickness at 7 µm until tissue appears.
- Label a slide with the mouse ID and cut 4–5 transverse sections of the aortic tissue at 7 µm thickness.
- To transfer the sliced tissue to the slides, place all cut sections on the cryostat stage (also called the knife stage) before placing the labeled slide directly over them.
- Once the transfer is complete, air-dry slides.
- Image sections under 10x magnification on a brightfield microscope. Save images in a JPG/TIFF format with a scale bar at the bottom of the picture.
- For analysis, open ImageJ, go to File > Open and select the aortic image.
- Once the aortic image is up, zoom into the scale bar using Control + + icon and then use the line tool to measure the length of the scale bar. To populate the result, press Control + M. The measurement calculated under length is the measurement of the scale bar.
- To calibrate the software, go to Analyze > Set Scale. For the Distance in pixels enter the length of the line calculated by ImageJ in step 8. For the Known distance enter the actual length of the scale bar, and under units write the unit of measurement (µm, mm, cm, etc).
- Check the global box to automatically calibrate all subsequent images. Note whether the scale bar in the other images differs, or whether ImageJ is closed; if so, recalibration is required.
- For wall thickness, use the straight line tool and draw a perpendicular line from luminal edge to outer adventitial edge. Press Control + M to auto-populate the length in the results tab.
- Repeat step 5.13 to perform measurements at 6 evenly spaced positions around the circumference of the aorta and record each value.
- To calculate the mean thickness per mouse aorta, average all thicknesses obtained from 4–5 samples of the same mouse.
- To measure the luminal diameter, select the polygon tool and trace the inner luminal border clockwise. Record perimeter (µm) by pressing Control + M.
- Repeat tracing counterclockwise, starting at a different point. Make sure that the two circumference values are close to each other and average them for that aortic ring.
- Repeat step 5.16 for the 4–5 aortic samples of the same mouse and average all the circumference values.
- To calculate the diameter, use the equation: Diameter (µm) = Perimeter/3.14.
6. Circulating milieu-mediated aortic elastic modulus
NOTE: To determine whether circulating factors or specific compounds alter intrinsic aortic stiffness, thoracic aortic rings from intervention naïve mice can be incubated ex vivo under defined standard culture conditions (37 °C, 5% CO2, 20% O2, humidified) (Figure 9).
- Dissect the thoracic aorta and cut two 1 mm ring segments per condition. Remove all perivascular adipose tissue.
- In a 96-well plate, incubate the aortic rings in standard media, which consists of DMEM + 1% penicillin-streptomycin.
- Add experimental treatment to the media. For plasma or serum (untreated plasma/serum can be used for this), use 10% of the total media volume. Use preclinical and clinical (human) plasma or serum3,4,6 (Figure 9).
- For establishing the causal role of a circulating factor shown to be different between study groups, repeat the plasma/serum exposure while simultaneously correcting for the observed difference in concentration between groups (i.e., normalizing the concentration of the factor of interest), determine the direct effect of the factor of interest at a concentration that represents the average group difference, or block the signaling of the factor that is believed to be responsible for mediating the effect of the circulating milieu.
NOTE: The latter two approaches were previously executed, respectively, with Trimethylamine-N-Oxide (TMAO)5 and with blockade of the receptor for advanced glycation end products3. - For elucidating the role of excess superoxide-related oxidative stress or mitochondria-
specific superoxide-related oxidative stress in this model system, use the following respective concentrations when incubating aorta rings: TEMPOL: 1 µM5,10 and MitoQ: 1 µM6. - After 48–72 h of incubation, load the aortic rings into the pin myograph and follow the steps outlined above.
Results
Age-related aortic stiffening
For intrinsic mechanical stiffness, the force corresponding to each stretching interval is recorded and used for the calculations. In the previously discussed calculations, one will generate stress-strain curves and calculate the elastic modulus for the 1) collagen region and/or 2) elastin region of these curves, as described above and originally shown by Gioscia-Ryan et al9. Elastic modulus of the more collagen-dominant region of the stress-strain curve is determined as the slope of the linear equation, fit to the final 4 points of the stress-strain curve8,9,11,12,13. The elastin dominant region (low force region) of the stress-strain curve was identified by fitting a seventh-order polynomial equation (r 2> 0.99) and then calculating its roots. The first root was taken as the boundary between the very low-force region and the elastin region, while the second root was considered the boundary between the elastin region and the onset of collagen fiber engagement8,9,14. The elastic modulus of the elastin region was then determined as the slope of a linear equation that fits the stress-strain data between the two roots. See Figure 8 for representative results of stress-strain curves and subsequent elastin and collagen region graphs.
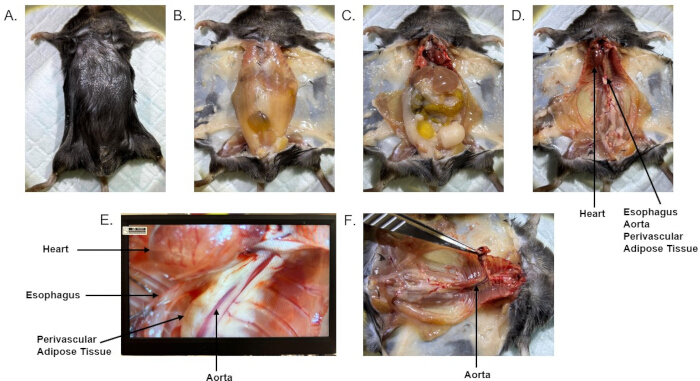
Figure 1: Dissection of the mouse aorta. (A) Anesthetized mouse in dorsal recumbency, (B-C) removal of skin, skeletal muscle, and ribs, (D) removal of all internal organs, connective tissue, and fat, (E) magnified view of intact heart, esophagus, and thoracic aorta, (F) dissection of aorta. Please click here to view a larger version of this figure.
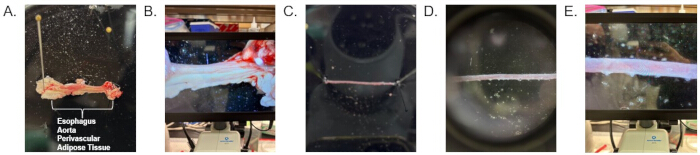
Figure 2: Cleaning of the mouse aorta. (A,B) Removal of the mouse aorta containing the esophagus, aorta, and perivascular adipose tissue, (C–E) representative images of a cleaned aorta. Please click here to view a larger version of this figure.
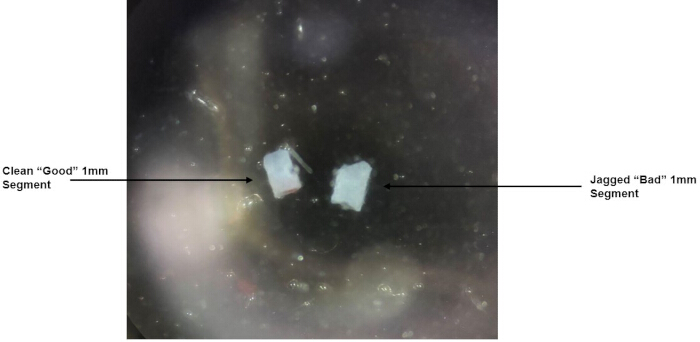
Figure 3: Representative images of a good and bad 1 mm cut aortic segment. Please click here to view a larger version of this figure.
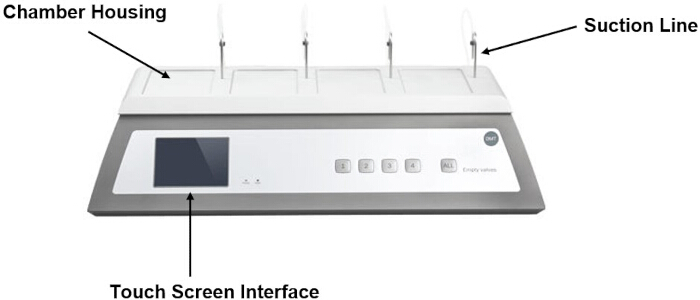
Figure 4: Multi pin myography system. Please click here to view a larger version of this figure.
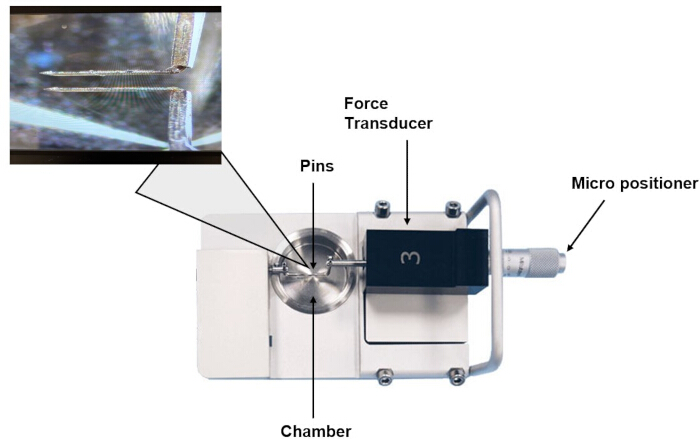
Figure 5: Multi pin myography system chamber unit. Please click here to view a larger version of this figure.
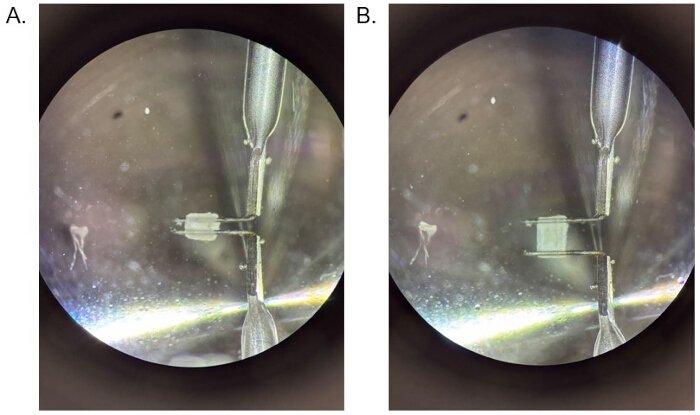
Figure 6: Mounted aortic ring on chamber pins. (A) Unstretched aorta and (B) Stretched aorta. Please click here to view a larger version of this figure.
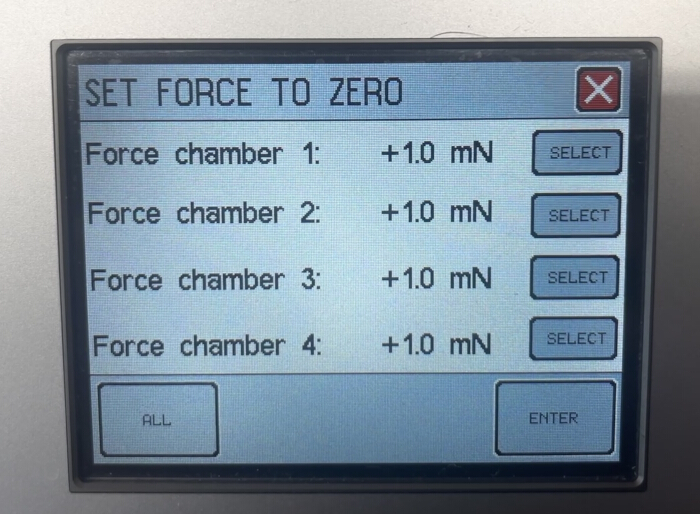
Figure 7: Pin myography interface. Representative image of increasing aortic tension to 1 mN force. Please click here to view a larger version of this figure.
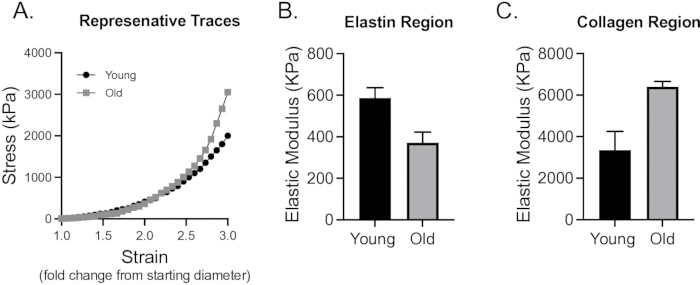
Figure 8: Representative results for age-related aortic stiffening. (A) Stress-strain curves generated from pin myography. (B) The collagen region of the stress-strain curve. (C) Elastin region of the stress-strain curve. These data were adapted from previously published data12. Please click here to view a larger version of this figure.
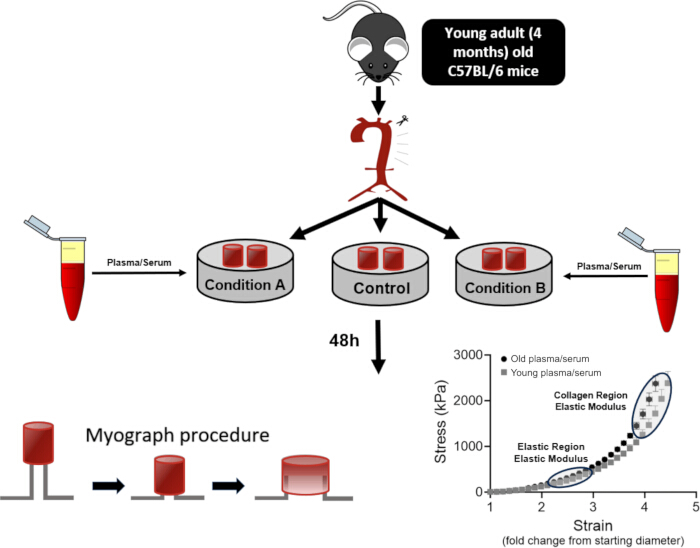
Figure 9: Representative schematic for elucidating the role of preclinical or clinical biospecimens (plasma or serum) on the aortic elastic modulus of invention naïve aortic rings. Please click here to view a larger version of this figure.
| Chemical | Molarity | Amount |
| NaCl | 724.7 mM | 42.35 g |
| KCl | 23.5 mM | 1.75 g |
| Calcium Chloride Dihydrate (CaCl2·2H2O) | 10 mM | 1.47 g |
| Magnesium Sulfate Heptahydrate (MgSO4 ·7H2O) | 5.84 mM | 1.439 g |
Table 1: Ca2+ Ringer's stock solution preparation.
| Chemical | Molarity | Amount |
| Ca 2+ Ringers Stock | ------- | 400 mL |
| MOPS stock | 3.01 mM | 10 mL |
| EDTA stock | 0.0255 mM | 8 mL |
| Monosodium Phosphate (NaH2PO4) | 1.2 mM | 0.288 g |
| D-(+)-Glucose (Dextrose) | 5.0 mM | 1.802 g |
| Sodium pyruvate | 2.0 mM | 0.44 g |
| BSA | ------- | 20.0 g |
Table 2: Cold physiological saline solution (CPSS) preparation.
Supplementary Table 1: Example spreadsheet to determine modulus of elasticity of the low-force region.Please click here to download this file.
Discussion
The use of pin myography for the assessment of aortic intrinsic stiffness ex vivo provides the opportunity to assess aortic intrinsic stiffness independent of potentially confounding in vivo physiological variables, such as blood pressure and autonomic input2. Moreover, this ex vivo experimental approach provides the opportunity to screen potential molecular mechanisms that may underlie differences in aortic intrinsic stiffness. Here, we provided a step-by-step guide for assessing aortic intrinsic stiffness using pin myography and provided representative results from work we have previously published using this approach. Furthermore, we have provided detailed instructions for how to interrogate the role of the circulating milieu, using both preclinical and clinical biospecimens, in modulating aortic intrinsic stiffness, and how one may go about establishing the causal role of a select factor within the circulation in conferring the observed differences in aortic intrinsic stiffness.
We have previously shown that the collagen region (i.e., collagen aortic elastic modulus) and the elastin region (i.e., elastin aortic elastic modulus) of aortic stiffness are higher and lower, respectively, in aortas collected from old (27 months of age) relative to young adult (6 months of age) wild-type C57BL/6N mice8,9. In addition, we have established a direct role for the circulating milieu in mediating age-related aortic stiffening – i.e., exposure of aorta rings from young adult intervention naïve wild-type C57BL/6J mice to plasma from old mice and middle-age/older adults (≥ 65 years of age) induces an increase in collagen aortic elastic modulus, and vice-versa when aorta rings from old mice are exposed to plasma from young adult mice and young adult humans (~ average age of 35 years), and that these differences are related to the donor's aortic stiffness measured in vivo via carotid-femoral pulse wave velocity4. We have also found that plasma collected from young adult mice previously treated with the commonly administered chemotherapeutic agent Doxorubicin (to model aortic stiffening in cancer survivors) can directly induce aortic stiffening, and we elucidated a molecular mechanism that may underlie this observation3.
Building upon the observed differences of higher aortic elastic modulus with aging, we found that middle-aged/older adults with higher aortic stiffness in vivo, relative to young adults, have higher circulating levels of the gut-derived metabolite TMAO, and that circulating TMAO concentrations were positively associated with aortic stiffness in vivo5. As a next step to interrogate the direct role of TMAO in mediating aortic stiffness, we incubated aorta rings from young adult intervention naïve mice to a concentration of TMAO that was representative of the mean group difference in circulating TMAO between young and older adults, and found that this concentration could directly increase the collagen elastic modulus of the aorta. We subsequently found that this concentration of TMAO induced aortic stiffening via excess superoxide-related oxidative stress, as co-incubation of TMAO with the superoxide scavenger TEMPOL could lower the TMAO-mediated increase in the collagen elastic modulus5. In a separate line of investigation, we have found that MitoQ can be used in the same manner as TEMPOL to determine the contribution of excess mitochondria-derived superoxide in mediating higher aortic collagen elastic modulus induced by the circulating milieu6.
As with any model system, there are limitations that must be considered. Although the use of pin myography allows for the direct interrogation of aortic wall stiffness without the influence of potentially confounding physiological variables, that is inherently a limitation to translating this approach to in vivo settings. Thus, results derived via pin myography must be interpreted conservatively, and within the confines of what the method is specifically testing (i.e., intrinsic wall stiffness) and should not immediately be extrapolated to in vivo physiology. Indeed, storage of aortic samples for subsequent elastic modulus testing at -80 °C renders cells non-viable; however, the mechanical properties within the aortic wall are maintained to determine the contributions of the intrinsic properties to aortic stiffening. Moreover, there are select aspects of the experimental setup that should be considered, particularly for the culture conditions in the circulating milieu-related experiments. For example, the composition of the media used for culturing endothelial cells differs from the media used for culturing vascular smooth muscle cells. Thus, it is imperative that any differences observed in circulating milieu-mediated aortic stiffness are viewed as an initial screening, which then provides the premise for conducting additional experiments aimed at determining the biological mechanisms that may underlie the observed differences in aortic elastic modulus (e.g., vascular cell phenotypic switching and/or alterations in nitric oxide bioavailability).
In conclusion, the experimental approach of pin myography can be used to directly measure aortic intrinsic stiffness (elastic modulus) as well as the contribution of the circulating milieu (and its constituents) to aortic stiffness. Our representative results and citations throughout provide evidence of the validity of these experimental approaches.
Disclosures
The authors have nothing to disclose.
Acknowledgements
We want to thank all the laboratory trainees and staff in the Seals Laboratory at the University of Colorado Boulder and the Clayton Laboratory at the University of Colorado Anschutz who have assisted with pin myography experiments over the years.
The sources of funding were National Institutes of Health T32 AGAG000279 (BLN & MNK), American Heart Association 26POST1556999 (MNK), and National Institutes of Health R00 HL159241 (ZSC).
Materials
| Name | Company | Catalog Number | Comments |
|---|---|---|---|
| 2-methylbutane | Fisher Scientific | AA19387AP | |
| BSA | Fisher Bioreagents | BP1600 | |
| Calcium Chloride Dihydrate | Sigma-Aldrich | C7902 | |
| Cryomold | Fisher Scientific | NC9511236 | |
| D-(+)-Glucose (Dextrose) | Sigma-Aldrich | G7021 | |
| DMEM | Fisher Scientific | MT10017CV | |
| EDTA (A.C.S.) | Fisher Chemical | E478 | |
| KCl | Sigma-Aldrich | P4504 | |
| Magnesium Sulfate Heptahydrate | Sigma-Aldrich | M2773 | |
| MitoQ | Cayman Chemical | 845959-50-4 | |
| Monosodium Phosphate | Sigma-Aldrich | S5011 | |
| MOPS (Na salt) | Sigma-Aldrich | M9024 | |
| Multi Pin Myography System | Danish Myo Technology (DMT) | 620M | |
| NaCl | Fisher Chemical | S271 | |
| Penicillin-streptomycin | Fisher Scientific | 15-140-148 | |
| RAGE antibody | R&D System | AF1145 | |
| Sodium pyruvate | Sigma-Aldrich | P2256 | |
| TEMPOL | Sigma-Aldrich | 2226-96-2 | |
| Tissue-tek OCT compound | Sakura | 4583 | |
| Trimethylamine N-oxide (TMAO) | Sigma Aldrich | 317594 |
Reprints and Permissions
This article has been published
Video Coming Soon