This protocol describes training individuals with tetraplegia and high paraplegia, together with their companions, to safely operate a self-balancing exoskeleton for personal use. The protocol includes participant screening, device fitting, standardized training sessions, safety procedures, and competency assessments.
Method Article
Demonstration of a Training Protocol for Individuals with Tetraplegia and High Paraplegia Using a Self-Balancing Exoskeleton
* These authors contributed equally
In This Article
Summary
Abstract
First-generation personal and home-use exoskeletal-assisted walking devices for individuals with spinal cord injury (SCI) require the use of forearm crutches or a walker and sufficient trunk control for balance and mobility, limiting their use among individuals with tetraplegia and high paraplegia. In addition, these devices typically permit only forward walking, which may restrict maneuverability in indoor environments. A self-balancing exoskeleton that provides trunk stability, enables standing and walking without an assistive walking device, permits hands-free activity, and allows forward, lateral, and backward stepping as well as bending and squatting was evaluated in individuals with tetraplegia and high paraplegia. A prospective, interventional, single-group, open-label study was conducted at two sites. Eligible participants with SCI and their companions who successfully completed screening evaluations were trained and evaluated as pairs. The protocol included participant screening, device fitting, four standardized training sessions, and competency evaluations. Training activities included device donning and doffing, standing and sitting, indoor and outdoor walking, ambulatory functions, activities of daily living, safety procedures, and device care and storage. Performance assessments included donning and doffing within 10 min, the timed-up-and-go (TUG) test within 3 min, and a distance of at least 40 m the 6-min walk test (6MWT). Among the first 16 participants who completed the protocol, all achieved the TUG and 6MWT performance goals, 15 achieved the donning goal after four training sessions, and all achieved the doffing goal. This article describes a standardized training protocol for individuals with tetraplegia and high paraplegia and their companions to safely operate a self-balancing exoskeleton for personal use.
Introduction
Spinal cord injury (SCI) is a medically complex and life-altering condition for which there is currently no cure. In general, the higher and more severe the spinal cord lesion, the greater the neurological deficit. Depending on the neurological level and completeness of injury1, paralysis resulting from SCI can affect multiple organ systems, including bowel, bladder, sexual function, respiration, heart rate, blood pressure regulation, and thermoregulation2,3,4,5,6,7,8,9.
Since 2009, exoskeletal-assisted walking devices have been investigated in the United States for their safety and efficacy in individuals with paralysis resulting from SCI10,11,12,13,14,15,16. Some studies have reported improvements in bowel and bladder function, self-esteem, fitness, and body composition11,16,17,18,19,20,21,22,23,24. These improvements have been attributed to the ability of device users to participate in overground walking for several hours per week.
In 2014 and 2016, two powered lower-extremity exoskeletons received clearance from the United States Food and Drug Administration (FDA) for personal, home, and community use by individuals with paraplegia25,26,27. Operation of these devices requires the use of forearm crutches or a walker for balance and mobility during walking and therefore requires adequate upper-extremity strength, hand function, and trunk stability28,29,30. Important limitations of these devices include reduced suitability for individuals with tetraplegia, the inability to bend or squat, and the inability to move laterally or backward. In addition, individuals with paraplegia at thoracic level 6 (T6) and above may experience challenges related to impaired trunk control during device use.
Recent technological advances have supported the development of several self-balancing exoskeleton systems31,32,33,34. Tian et al.33 reported the development and verification testing of a self-balancing exoskeleton capable of facilitating multiple rehabilitation movements in five male participants undergoing balance and locomotion training. Subsequent studies further evaluated self-balancing and locomotion capabilities through straight-line and turning experiments involving both a dummy model and human participants35,36. Although these studies demonstrated promising technical performance, published clinical trial data and training methodologies for individuals with SCI remain limited. Furthermore, despite the growing self-balancing exoskeleton market, no published studies have described a standardized protocol for training individuals with SCI and their companions for personal or home use of a self-balancing exoskeleton, nor have they specifically addressed use among individuals with tetraplegia or high paraplegia.
The goal of this method is to provide a standardized protocol for training individuals with tetraplegia and high paraplegia, together with a companion, to safely operate a self-balancing exoskeleton for personal use. The novelty of this approach is the use of a self-balancing exoskeleton that enables standing and walking without an assistive walking device, thereby allowing the hands to remain available for functional activities while also permitting bending, squatting, and forward, lateral, and backward stepping37. The device evaluated in this study was a powered hip-knee-ankle lower-extremity exoskeleton with 12 actuated degrees of freedom. The device incorporates self-balancing capability with dynamic walking control and embedded hardware and software safety features designed to reduce fall risk. In addition to forward stepping, the device permits lateral and backward stepping, as well as hip and knee flexion for bending and squatting. The device is designed to be worn over clothing, weighs 76 kg (167.5 lb), and is controlled through a joystick interface while standing. Additionally, the device provides trunk support for individuals with higher-level SCI, including tetraplegia and paraplegia at T6 and above. The protocol was evaluated in individuals with tetraplegia and high paraplegia and their companions during supervised indoor activities, simulated home environments, and limited community settings. This article describes participant eligibility criteria, device fitting procedures, training methods, competency assessments, and protocol implementation considerations relevant to personal use of a self-balancing exoskeleton.
Protocol
All procedures were performed in accordance with the approved study protocol and informed consent process authorized by the Institutional Review Boards (IRBs) at the James J. Peters Veterans Affairs Medical Center (Protocol #1807014) and the Kessler Foundation (Protocol #R-1272-24). All study activities were conducted in compliance with the registered ClinicalTrials.gov protocols (James J. Peters Veterans Affairs Medical Center: NCT06777576; Kessler Foundation: NCT06814015). The study was conducted at two sites: the Spinal Cord Damage Research Center at the James J. Peters Veterans Affairs Medical Center (Bronx, NY, USA) and the Center for Mobility and Rehabilitation Engineering at the Kessler Foundation (West Orange, NJ, USA).
Performance Goals and Outcome Definitions
Outcome measures included the 6-min walk test (6MWT; performance goal: ≥40 m), Timed Up and Go (TUG; performance goal: ≤3 min), and 10-m walk test (10MWT; performance goal: ≥0.2 m/s). Activities of daily living (ADLs) were evaluated using representative indoor and limited outdoor functional tasks, including manual-door navigation, kitchen activities, bathroom activities, living-room activities, elevator navigation, and outdoor walking. Performance goals for donning and doffing were ≤10 min each. Detailed descriptions of the 10MWT, 6MWT, ADL assessments, and donning/doffing procedures are provided in Supplementary File 1.
Trainer Certification
The training protocol described in this manuscript was developed by the manufacturer of the self-balancing exoskeleton38 with substantial input from the investigative teams at both study sites. The protocol was designed to support the training and evaluation of 24 SCI device users and their companions for a United States Food and Drug Administration (FDA) 510(k) submission. This report describes the training methods used for the first 16 SCI device users and companions who completed the study. An extensive trainer certification program was conducted at both study sites by device experts from the manufacturer and is described in Supplementary File 2 (Section S1, Trainer Certification). The investigative teams at both sites had prior experience using exoskeleton-assisted walking devices for individuals with SCI and had evaluated training protocols for rehabilitation and personal/home use since 2011.
1. Pre-screening and Informed Consent
NOTE: The purpose of pre-screening is to exclude potential participants who do not meet the study eligibility criteria using self-reported yes/no questions before conducting more comprehensive screening evaluations. No study data are collected during pre-screening. Potential participants who answer “No” to any required inclusion question are excluded from further evaluation.
- Ask the pre-screening questions described in Supplementary File 2 (Section S2, Pre-Screening).
NOTE: If a potential SCI participant answers “Yes” to all pre-screening questions but the companion does not, the companion is excluded and another eligible companion may be enrolled. Participants who answer “Yes” to all required questions may proceed to the informed-consent process. - During the informed-consent process, explain to the SCI participant and companion the study purpose, screening procedures, known risks, medical restrictions, study time commitment, training process, companion responsibilities, participant confidentiality safeguards, and the planned use of study results.
- Explain the known risks associated with device use, including skin abrasions, equipment malfunction, falls, and unforeseeable adverse events (AEs). Explain that all study data will be de-identified to maintain participant confidentiality.
- Explain that the companion will be trained to operate and supervise the exoskeleton while the SCI participant is using the device and that both the SCI device user and companion will be evaluated as a pair and must successfully complete all required basic and critical skills (Supplementary File 3).
- Provide the SCI participant and companion with an opportunity to ask questions regarding all study procedures. Then ask both individuals to verbally describe their understanding of the study requirements, risks, and participation expectations. The certified trainer determines whether the responses demonstrate adequate understanding. If not, the study information is reviewed until both individuals can accurately describe the study requirements.
- Obtain separate signed informed-consent forms from the SCI participant and companion before performing any screening evaluations.
2. Screening Procedures
- Interview the potential SCI participant regarding lower-extremity fracture history, severe spasticity, uncontrolled hypertension, and unhealed or open wounds. If any of these conditions are present, inform the study physician, who will examine the participant and use clinical judgment to determine eligibility for continued participation. Exclude participants with current fractures, severe spasticity, uncontrolled hypertension, unhealed or open wounds located at exoskeleton contact points, or other wounds deemed inappropriate for participation by the study physician.
- Ask the SCI participant whether they have any neurological condition or injury other than SCI or a progressive SCI condition. If both answers are “No,” continue the screening process. Exclude participants who answer “Yes” to either question.
- Exclude potential SCI participants who are unable to communicate because of cognitive or language disorders or who have cognitive deficits that interfere with study participation, as determined by the clinician. Consult the study physician if the participant’s cognitive ability is uncertain.
- Perform the screening evaluations for potential SCI participants described in Supplementary File 2 (Section S3, Detailed Screening Procedures). Exclude participants with neurological injury levels at or below T7, evidence of a pre-existing foot fracture, hip T-scores or knee bone mineral density (BMD) values that do not meet the eligibility criteria described in Supplementary File 2 (Section S3, Bone Mineral Density Eligibility Criteria), or a positive pregnancy test.
- Exclude potential companions who are unable to communicate effectively with the trainer because of cognitive or language disorders, have any disease, concomitant injury, or medical condition that interferes with the performance or interpretation of the protocol-specified assessments, have insufficient availability to complete the study, or are participating in another interventional clinical trial.
- Perform the companion lifting test as described in Supplementary File 2 (Section S3, Companion Physical Qualification Assessment).
- Exclude potential companions who are unable to reach the required weight tier based on the weight-adjusted level of the potential SCI participant. Immediately terminate the lifting test if any signs of mechanical strain or physical distress are observed, and exclude that companion from study participation. Another eligible companion may subsequently be evaluated.
- Evaluate the companion’s physical ability to safely support and assist the SCI device user during exoskeleton-assisted movements using the standardized Companion Physical Qualification Assessment described in Supplementary File 2 (Section S3).
3. Device Fitting Specifications (Part of the Screening Procedures)
NOTE: Detailed device-fitting procedures and specifications are provided in Supplementary File 2 (Section S3, Device Fitting Specifications).
- After confirming that the potential SCI participant has successfully completed all medical and safety screening evaluations, provide three joystick options (A, B, and C) and instruct the participant to select the option that is most comfortable and appropriate for their level of hand function according to the procedures described in Supplementary File 2 (Section S3, Joystick Selection Controller Operability Assessment).
- Measure and record the participant’s anthropometric measurements, including total body weight using an appropriate wheelchair-user scale (Table of Materials), limb lengths using a flexible measuring tape, and joint range of motion (ROM) using a goniometer. Apply the eligibility criteria described in Supplementary File 2 (Section S3, Anthropometric Measurements Used for Device Fitting and Trajectory Generation).
- Provide the manufacturer’s engineer with the participant’s body weight, height, thigh and leg segment lengths, and hip, knee and ankle joint ROM measurements. These measurements are uploaded to the manufacturer’s proprietary software to generate the individualized joint trajectories used by the exoskeleton. Additional information is provided in Supplementary File 2 (Section S3, Determination of Optimization Trajectories for Device Use).
- Verify successful installation of the individualized hardware configuration and motor-control profile before participant use.
- Perform a visual skin examination before device fitting and document any pre-existing skin abnormalities at potential device-contact locations.
- Install mandatory foam padding over the back, thighs, knees, tibias, and ankles. Add optional protective foam padding when additional comfort or friction reduction is required. Manually inspect all device-contact locations and install optional hip padding as described in Supplementary File 2 (Section S3, Foam Padding).
- Measure ankle dorsiflexion with the knee fully extended according to the procedures described in Supplementary File 2 (Section S3, Device Fitting Specifications). Foot wedges, when compensation for limited ankle dorsiflexion is required, are installed by the manufacturer’s engineer, as described in Supplementary File 2 (Section S3, Wedges).
- Record blood pressure and heart rate before, during, and after fitting activities and monitor for orthostatic symptoms.
- Identify and document the participant’s preferred transfer method for entering the exoskeleton.
- Evaluate alignment of the hip, knee, and ankle joint centers and verify adequate clearance at all device-contact locations.
- Explain the device-control functions to the SCI participant-companion pair and instruct the SCI participant to operate all required controls for standing, walking, and sitting.
- Adjust the exoskeleton as needed to eliminate excessive pressure and optimize fit during sitting, standing, walking, and FREE-mode activities. Additional foam padding may be added after the SCI device user returns to the seated position.
- Place the participant in the exoskeleton and perform an approximately 20-min fitting assessment according to the procedures described in Supplementary File 2 (Section S3, Fitting Assessment).
- Instruct the SCI participant to perform repeated standing and sitting movements while wearing the exoskeleton according to the procedures described in Supplementary File 2 (Section S3, Fitting Assessment).
- Measure blood pressure during or immediately after standing and sitting in the exoskeleton. Ask the participant whether symptoms of orthostatic hypotension or muscle spasms are present. Use physician judgment to determine eligibility if severe spasticity or unresolved orthostatic symptoms occur during the fitting assessment.
- Verify that the headrest extends to at least the top of the participant’s head and evaluate all device-contact locations during sitting and standing.
- Evaluate the participant’s ability to operate the joystick controller while wearing the exoskeleton according to the procedures described in Supplementary File 2 (Section S3, Fitting Assessment).
- Instruct the participant to sit on an appropriate chair or seat as described in Supplementary File 2 (Section S3, Fitting Assessment). Remove the participant from the exoskeleton and inspect the buttocks, ischial regions, tibial tuberosities, and all other device-contact locations for redness, skin irritation, or abrasions.
- Perform a post-fitting skin examination following device removal. Identify areas of excessive pressure, including redness, bruising, swelling, pinched skin, or other signs of tissue irritation. Perform appropriate device adjustments and padding modifications, and consult the study physician before continuing if necessary. Additional information is provided in Supplementary File 2 (Section S3, Skin Integrity and Pressure Assessment).
- Repeat fitting assessments as needed. If acceptable alignment and pressure distribution cannot be achieved after device adjustments, exclude the participant from further study participation because of failure to meet the fitting requirements.
- Review all screening and fitting findings jointly with the study physician and certified trainers before proceeding to the training sessions described in Supplementary File 2 (Section S4, Detailed Visits, Training Session Curriculum, and Progression Procedures).
- Proceed to exoskeleton training only after successful completion of all screening, fitting, safety, skin-integrity, and device-operability requirements.
4. Device Description and Configuration
NOTE: The exoskeleton consists of two articulated lower limbs connected to an upright back structure. The device is worn externally over the user’s clothing and secures the user at the waist, torso, thighs, legs, and feet using a vest, belt, shoulder straps, shoulder pads, and lower-extremity interfaces (Figure 1A). The device also includes 12 actuators, integrated sensors, a rechargeable battery, a joystick-based control interface, armrests, a headrest, a front HALO safety bar, and a rear companion handle (Figure 1B).
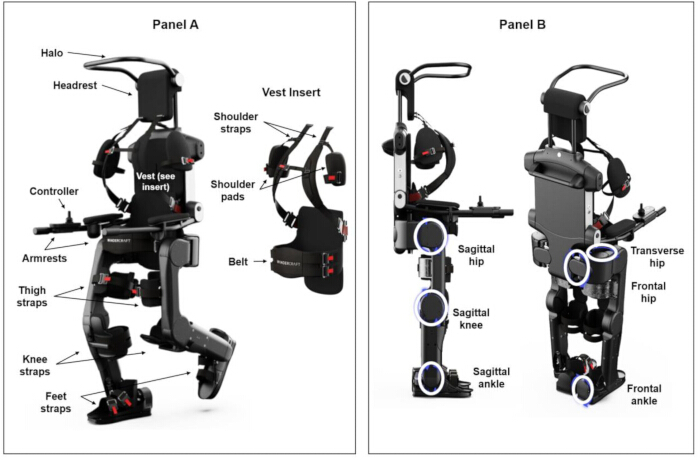
Figure 1. Self-balancing Personal Exoskeleton. (A) Self-balancing personal exoskeleton worn by a user. The device is secured at the torso, waist, thighs, legs, and feet and includes a fabric vest, shoulder straps, shoulder pads, armrests, headrest, and front protective bar (HALO). (B) Schematic representation of the exoskeleton showing the 12 motor-driven joints located bilaterally at the sagittal hip, knee, and ankle joints and at the transverse hip, frontal hip, and ankle joints. The self-balancing design permits hands-free standing and walking without forearm crutches or a walker. Reproduced with permission from the manufacturer. Please click here to view a larger version of this figure.
- Ensure that the battery has been fully charged using the dedicated charger before device use. Charge the battery only when the exoskeleton is unoccupied. The charging procedure is described in Supplementary File 2 (Section S5, Device Maintenance and Care).
NOTE: Refer to Supplementary File 2 (Sections S3 and S5) for detailed exoskeleton configuration procedures, anthropometric measurements, manufacturer-generated trajectory procedures, hardware selection, fitting accessories, and battery maintenance.
5. Device Controls and Operating Modes
- Turn the exoskeleton on and off using the POWER button located on the right side of the device while standing behind the exoskeleton.
- Use the PAUSE button located on the back of the exoskeleton to immediately stop device movement when necessary.
- Mount the pre-selected joystick-based remote-control unit on the armrest according to the procedures described in Supplementary File 2 (Section S3, Joystick Selection Controller Operability Assessment).
- Use INSTALLATION mode while the SCI device user is seated to open the device legs and facilitate transfers.
- Use SITTING mode to maintain a rigid seated position.
- Use READY-TO-STAND mode while seated to prepare the device for standing.
- Use STANDING mode to maintain a stationary standing position.
- Use WALKING mode to perform forward and backward walking and turning movements of up to 360°.
- Use PRECISION mode to perform short forward, backward, and lateral steps.
- Use FREE mode to perform lateral weight shifts and semi-squat movements.
- Use READY-TO-SIT mode to prepare the device for sitting.
- Use LOCKED mode to maintain the current position and ignore all user inputs except mode-exit commands and the POWER button.
- Use EMPTY mode to move the exoskeleton without a user.
- Operate the exoskeleton on indoor surfaces, including smooth carpet and tile, and on outdoor surfaces, including concrete and grass. The walking speed is fixed at 0.25 m/s by the manufacturer.
- Limit use to surfaces with slopes of ≤2% grade and surface irregularities of ≤1.27 cm. Before participant training, the sidewalks used for outdoor training at both study sites were measured and confirmed to meet these requirements. All participants completed outdoor training on these standardized walkway sections.
- Do not use the exoskeleton on stairs or curbs.
- Use the HALO, headrest, armrests, vest, and companion supervision using the rear handle as passive safety features during device operation.
- Verify that the active safety system is operational before device use. Confirm that the system disengages the motors and activates viscous braking during a power-loss event to permit a controlled descent.
NOTE: Refer to Supplementary File 2 (Section S3, Active Safety-System Validation and Maintenance) for detailed descriptions of active safety-system validation, maintenance verification procedures, and controlled-descent certification procedures.
- Train the companion to manage balance perturbations, obstacle avoidance, emergency stopping, controlled descents, and emergency extraction according to the procedures described in Supplementary File 2 (Section S3, Controlled Balance Perturbations; Companion Safety Assessment; and Emergency Extraction Procedure).
- Require each SCI device user-companion pair to demonstrate mastery of the controlled-descent procedure during certification and successfully complete all required critical tasks (Supplementary File 3) before independent device operation.
- The controlled-descent procedure and mastery criteria are described in Supplementary File 2 (Section S3, Controlled Descent Procedure for the Pair).
6. Exoskeleton Training Sessions Overview and Assistance Levels
- Conduct four trainer-led training sessions lasting 1-2 h before the initial independent certification assessment during Visit 6.
- Offer an additional practice session when required.
- Record the companion’s level of assistance (LOA) during evaluation visits (Figure 2).
- Rate companion assistance using the three-level LOA scale described in Supplementary File 2 (Section S4, Training Session 3).
- Train the SCI device user and companion in donning and doffing, standing and sitting, indoor and outdoor walking, ambulatory functions, activities of daily living (ADLs), safety procedures, and device care and storage. Representative use scenarios are summarized in Supplementary File 4.
- Instruct the SCI device user and companion to perform independent skin inspections before and after exoskeleton use.
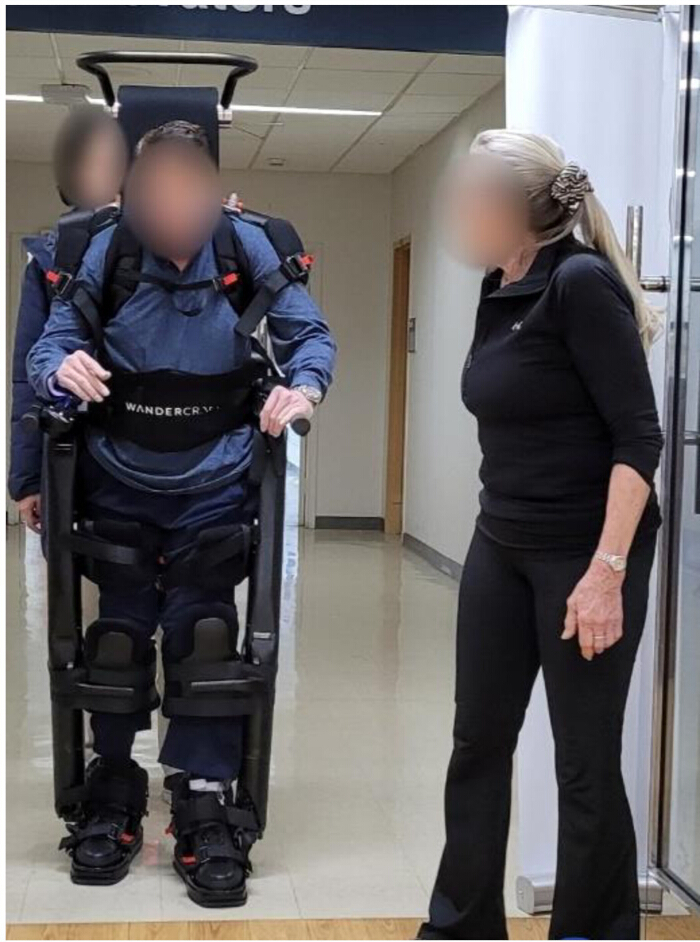
Figure 2. Training of a User with Spinal Cord Injury in the Self-balancing Exoskeleton. Representative photograph of an SCI device user walking indoors in the self-balancing exoskeleton during an early training session. The trainer is positioned behind the exoskeleton providing supervision and assistance, while the trained companion remains nearby. Written informed consent for publication of this photograph was obtained from the participants. Please click here to view a larger version of this figure.
7. Donning and Doffing
- Position the exoskeleton on the designated bench in the seated position, raise both armrests and the HALO, and activate INSTALLATION mode to open the device legs.
- Transfer the SCI device user into the exoskeleton using the participant’s preferred transfer method and a transfer aid when required.
- Secure the pelvic band, lower-extremity straps, shoulder straps, chest straps, tibial interfaces, HALO, and armrests before standing.
- Return the exoskeleton to the seated position before doffing.
- Release all restraints, open the tibial interfaces, position the wheelchair, and transfer the SCI device user out of the exoskeleton.
- Evaluate donning and doffing during certification according to Supplementary File 2 (Section S4, Donning and Doffing Certification Assessment).
8. Standing, Sitting, and Balance Training
- Explain the standing procedure to the SCI device user and companion.
- Press and hold the sit-to-stand button to place the device in READY-TO-STAND mode.
- Instruct the SCI device user to push and hold the joystick toward the green indicator to initiate standing.
- Confirm that the joystick indicators illuminate white, indicating STANDING mode.
- Monitor the SCI device user for orthostatic symptoms during the sit-to-stand transition.
- Instruct the SCI device user to perform a semi-squat, left weight shift, and right weight shift while in FREE mode.
- Explain that FREE mode may be used during activities of daily living (ADLs) to facilitate reaching, opening doors or cabinets, and manipulating objects.
- Activate FREE mode by pressing the top-right button on the remote-control unit.
- Press and hold the stand-to-sit button to place the device in READY-TO-SIT mode.
- Position a bench behind the exoskeleton before initiating any sitting maneuver.
- Instruct the SCI device user to pull and hold the joystick toward the green indicator to initiate sitting. Confirm that the SCI device user is safely seated before proceeding with doffing.
- Conduct a structured four-session training program consisting of standing, sitting, balance, safety, indoor mobility, outdoor mobility, and certification activities. Progress training from basic standing and sitting tasks to advanced mobility and ADL performance. Detailed session content, training dosage, repetition requirements, progression procedures, and certification activities are provided in Supplementary File 2 (Section S4, Training Progression Criteria).
- Require the SCI device user-companion pair to demonstrate competency during each training session before progressing to more advanced training activities.
- Conduct Session 5 as the certification evaluation session and verify proficiency in all required basic skills, critical tasks, safety procedures, and theoretical knowledge according to the certification checklist (Supplementary File 3).
9. Indoor Walking and Ambulatory Functions
- Instruct the SCI device user and companion to avoid collisions with walls, objects, or obstacles while walking indoors.
- Use PRECISION mode to perform short forward, backward, and lateral movements when maneuvering in confined spaces.
- Press the PAUSE button if an obstacle or hazardous situation is encountered during walking. Release the joystick immediately to stop the exoskeleton when an immediate hazard is identified.
- Instruct the companion to remain within arm’s reach of the SCI device user at all times.
- Instruct the companion to maintain both hands on the rear handle while navigating doorways, thresholds, crowded hallways, or other potentially unstable environments.
- Move the joystick in the desired direction to initiate walking while in WALKING mode.
- Move and hold the joystick to the left or right to perform directional changes, including 180° and 360° turns.
- Activate PRECISION mode by pressing the large center button on the remote-control unit and perform short forward, backward, and lateral steps as needed.
- Activate FREE mode by pressing the top-right button on the remote-control unit and perform lateral weight shifts, forward reaching, weight transfers, or semi-squat movements.
- Press FREE Mode again (to release this mode) to resume walking to navigate thresholds..
- Maintain both hands on the rear handle while assisting with doorway, elevator, or threshold navigation.
NOTE: Refer to Supplementary Files 2 and 4 for the complete training curriculum, representative use scenarios, progression procedures, competency requirements, and certification assessments.
- Maintain both hands on the rear handle while assisting with doorway, elevator, or threshold navigation.
10. Activities of Daily Living and Outdoor Walking
- Perform bathroom activities while using the exoskeleton, including hand washing, tooth brushing, and hair grooming while standing at a sink or mirror.
- Use PRECISION and FREE modes to position the SCI device user appropriately and facilitate reaching activities.
- Perform kitchen activities using FREE mode to access lower cabinets. Use PRECISION mode to move around countertop and carry lightweight objects.
NOTE: Do not handle loads ≥3.0 kg (≥6.6 lb) while using the exoskeleton because the balancing system is calibrated to the user’s body weight.
- Use seating that supports the combined weight of the SCI device user and exoskeleton and has a height of 38–56 cm, a minimum depth of 40 cm, and a minimum width of 40 cm.
- Ensure that the armrests are separated by at least 60 cm during sitting and standing activities and by at least 90 cm during donning and doffing.
- Use only stable, cushioned seating surfaces that are not mounted on wheels.
- Use FREE mode to reach objects and PRECISION mode to maneuver safely when approaching or leaving a seating surface.
- Walk outdoors on cement, asphalt, flat grass, and surface transitions with slopes of ≤2% grade (1.15°) and surface irregularities of ≤1.27 cm (0.5 in).
- Walk a minimum distance of 50 m outdoors while being timed. Encourage continuous walking but allow the SCI device user to pause or stop as needed.
- Do not expose the exoskeleton to water, excessive heat, excessive cold, or direct sunlight.
11. Safety Procedures, Device Care, and Storage
- Instruct the companion to immediately grasp the rear handle with both hands if the exoskeleton begins to lose balance and to maintain contact until stability is restored.
- Monitor the audio-feedback system during device use and respond immediately to balance-loss alerts.
- When a fall becomes unavoidable, allow the device fall-control system to activate and perform its programmed fall-response procedure during forward, backward, or lateral falls.
- Stand behind the exoskeleton, press the POWER button with one hand, and maintain control of the rear handle with the other hand. Guide the exoskeleton through a controlled descent until it reaches a stable position on the ground.
- Release all restraints and remove the SCI device user from the exoskeleton. Obtain additional assistance during emergency extraction when required.
- Perform emergency extraction if the SCI device user must be removed from the exoskeleton immediately.
- Train and evaluate the SCI device user-companion pair on all safety procedures, controlled-descent procedures, and emergency extraction procedures before certification for independent device use. Detailed safety training requirements and certification procedures are provided in Supplementary File 2 (Section S4, Training Session 2: Safety Procedures Training).
- Monitor the battery-charge indicator before each session. Turn off the exoskeleton and remove the SCI device user before charging the battery. Charge the battery fully before subsequent use.
- After each use, with the exoskeleton powered off, clean and disinfect all user-contact and companion-contact surfaces using either a hydrogen peroxide-based cleaner or Super Sani-Cloth wipes, according to manufacturer recommendations. Wash removable fabric components according to the manufacturer’s instructions.
- Perform routine device maintenance according to the manufacturer’s recommendations. Store the exoskeleton in a dry, well-ventilated location.
12. Training Schedule and Assessments
- Refer to Supplementary File 2 (Section S4, Detailed Visits, Training Session Curriculum, and Progression Procedures) for the complete training schedule and assessment procedures. Certification is based on successful completion of the standardized Basic and Critical Skills Checklist (Supplementary File 3). Performance assessments included the 10MWT, 6MWT, SWOC39, ADLs, and donning/doffing assessments, as described in Supplementary File 1.
NOTE: If the SCI device user-companion pair fails one or more critical tasks during the first Usability Test attempt, they are permitted one additional opportunity to successfully complete those tasks during Visits 8 or 9.
Statistical Analysis
Continuous variables are reported as mean ± standard deviation (SD) and 95% confidence intervals (CI). Comparisons between participants with tetraplegia (Tetra) and high paraplegia (HPara) were performed using unpaired t-tests. Training-session outcomes were analyzed using a two-factor repeated-measures analysis of variance (ANOVA) with factors of session (Sessions 1–4 and Assessment Session 5) and injury group (Tetra versus HPara). Outcomes analyzed included total session time, upright time, total steps, and walking distance. Effect sizes for comparisons between Tetra and HPara were calculated using Cohen’s d, defined as (X₁ − X₂)/s, where X₁ is the mean value for Tetra, X₂ is the mean value for HPara, and “s” is the standard deviation of the total study cohort (N = 16)40.
Results
Sixteen SCI device user–companion pairs completed the protocol, including all study visits using the self-balancing exoskeleton. Seven participants were classified as tetraplegia (Tetra), ranging from C4-A to C6-C, and nine were classified as high paraplegia (HPara), ranging from T1-A to T5-C. Demographic characteristics of the SCI device users and companions are summarized in Table 1. There were no significant differences between Tetra and HPara in age (38 ± 20.5 vs. 49 ± 13.9 years; p = .2274), duration of injury (6.2 ± 8.4 vs. 9.6 ± 7.5 years; p = .4128), height (172 ± 5.8 vs. 176 ± 7.6 cm; p = .2269), or companion age (46 ± 19.4 vs. 33 ± 16.8 years; p = .1712). Body weight was significantly lower in the Tetra group than in the HPara group (67.9 ± 9.3 vs. 83.9 ± 12.1 kg; p = .0117). Individual participant data are presented in Table 1.
| PID | NLI, AIS | Sex | Age (y) | Height (cm) | Weight (kg) | DOI (y) | Group | Etiology | Companion Age (y) | Companion Sex |
| Tetraplegia | ||||||||||
| 1 | C4, A | M | 20 | 178 | 52.2 | 3 | Tetra | Tr | 23 | M |
| 2 | C4, C | M | 43 | 173 | 72.6 | 10 | Tetra | Tr | 73 | F |
| 3 | C5, B | M | 21 | 173 | 59.0 | 2 | Tetra | Tr | 54 | M |
| 4 | C5, C | M | 28 | 165 | 72.6 | 2 | Tetra | Tr | 39 | M |
| 5 | C5, D | M | 73 | 180 | 75.7 | 24 | Tetra | NTr | 21 | F |
| 6 | C6, A | M | 23 | 165 | 65.8 | 1.5 | Tetra | Tr | 61 | M |
| 7 | C6, C | M | 56 | 170 | 77.1 | 0.9 | Tetra | Tr | 53 | F |
| Mean or Count | M = 7 | 38 | 172 | 67.9 | 6.2 | n = 7 | Tr = 6 | 46 | M = 4 | |
| SD or Count | F = 0 | 20.5 | 5.8 | 9.3 | 8.4 | NTr = 1 | 19.4 | F = 3 | ||
| High Paraplegia | ||||||||||
| 8 | T1, A | M | 54 | 188 | 93 | 8 | HPara | Tr | 27 | M |
| 9 | T1, C | M | 29 | 183 | 77.1 | 9 | HPara | Tr | 32 | M |
| 10 | T3, A | M | 57 | 183 | 85.7 | 17 | HPara | Tr | 39 | M |
| 11 | T4, A | M | 70 | 170 | 89.8 | 3 | HPara | NTr | 76 | F |
| 12 | T4, A | M | 49 | 168 | 60.0 | 11 | HPara | Tr | 25 | F |
| 13 | T4, C | M | 59 | 170 | 86.2 | 3 | HPara | NTr | 27 | M |
| 14 | T5, A | M | 51 | 178 | 72.6 | 25 | HPara | Tr | 24 | F |
| 15 | T5, C | M | 28 | 180 | 99.8 | 2 | HPara | Tr | 23 | F |
| 16 | T5, C | M | 40 | 168 | 91.0 | 8 | HPara | NTr | 26 | M |
| Mean or Count | M = 9 | 49 | 176 | 83.9 | 9.6 | n = 9 | Tr = 6 | 33 | M = 5 | |
| SD or Count | F = 0 | 13.9 | 7.6 | 12.1 | 7.5 | NTr = 3 | 16.8 | F = 4 | ||
| Tetraplegia vs. High Paraplegia | ||||||||||
| 95% CI Lower | −7.578 | −3.064 | 4.163 | −5.171 | −32.487 | |||||
| 95% CI Upper | 29.261 | 11.854 | 27.944 | 11.882 | 6.63 | |||||
| p value | 0.2274 | 0.2269 | 0.0117 | 0.4128 | 0.1712 | |||||
| Total Group (N = 16) | ||||||||||
| Mean | M = 16 | 44 | 175 | 76.8 | 8.1 | Tetra = 7 | Tr = 12 | 39 | M = 9 | |
| SD | F = 0 | 17.3 | 7.0 | 13.4 | 7.8 | HPara = 9 | NTr = 4 | 18.6 | F = 7 | |
Table 1: Demographic Characteristics of the Exoskeleton Users with Spinal Cord Injury and Their Companions Data are presented as individual participant values and as mean ± standard deviation (SD) or counts, as appropriate. Participants were grouped as tetraplegia (Tetra, n = 7) or high paraplegia (HPara, n = 9). Weight was significantly lower in participants with tetraplegia compared with high paraplegia (p = 0.0117), whereas no significant between-group differences were observed for age, height, duration of injury, or companion age. Ninety-five percent confidence intervals (CI) and p values are reported for comparisons between groups. Abbreviations: PID = participant identification number; NLI = neurological level of injury; AIS = American Spinal Injury Association Impairment Scale; DOI = duration of injury; M = male; F = female; Tetra = tetraplegia; HPara = high paraplegia; Tr = traumatic injury; NTr = non-traumatic injury; SD = standard deviation; CI = confidence interval Please click here to download this Table.
Safety was monitored throughout the study through systematic collection of AEs. Across the study, comprising 144 SCI device user visits and 144 companion visits, 17 AEs were reported, of which eight were device related. Most device-related AEs consisted of mild skin irritation and muscle spasms, findings commonly reported during exoskeleton use. During one training session, a device-related fall occurred when the exoskeleton unexpectedly tipped to the left. The companion attempted to maintain bilateral hand support but was unable to prevent the fall. The participant briefly contacted the ground with the left hand and safely landed in a long-sitting position. The exoskeleton was powered off and placed flat on the floor. The participant reported no pain or discomfort, and examination by the study physician revealed no swelling, redness, bruising, warmth, abrasions, or other injuries. The participant was transferred to a wheelchair with a two-person assist and was medically cleared to resume training. No study-related or device-related serious AEs (SAEs) occurred, and no participant withdrew because of an AE.
After four training sessions, all 16 SCI device users and companions completed the TUG within the prespecified goal of ≤3 min and achieved the 6MWT performance goal of ≥40 m. Eleven of 16 participants (68.8%) achieved the prespecified 10MWT performance goal of ≥0.20 m/s. Fifteen of 16 participants (93.8%) successfully donned the exoskeleton within the target time of ≤10 min, and all 16 participants (100%) successfully doffed the exoskeleton within the target time. Individual participant data and companion LOA scores are presented in Table 2.
| PID | NLI, AIS | Donning (min) | LOA | Doffing (min) | LOA | TUG (min) | LOA | 6MWT (m) | LOA | 10MWT (m/s) | LOA |
| Performance Goal ≤10 min | Performance Goal ≤10 min | Performance Goal ≤3 min | Performance Goal ≥40 m | Performance Goal ≥0.20 m/s | |||||||
| Tetraplegia (Tetra) | |||||||||||
| 1 | C4, A | 4.2 | 1 | 1.4 | 1 | 2.5 | 2 | 57 | 3 | 0.17 | 3 |
| 2 | C4, C | 11.2 | 1 | 3.1 | 1 | 2.1 | 2 | 62 | 3 | 0.19 | 3 |
| 3 | C5, B | 3.7 | 1 | 1.3 | 1 | 2.8 | 2 | 52 | 2 | 0.20 | 2 |
| 4 | C5, C | 5.3 | 1 | 1.1 | 1 | 2.0 | 2 | 72 | 3 | 0.23 | 3 |
| 5 | C5, D | 4.7 | 2 | 0.8 | 2 | 2.2 | 2 | 72 | 2 | 0.18 | 2 |
| 6 | C6, A | 7.0 | 1 | 2.2 | 2 | 2.4 | 1 | 65 | 1 | 0.21 | 1 |
| 7 | C6, C | 4.8 | 1 | 1.5 | 1 | 1.9 | 2 | 66 | 2 | 0.20 | 2 |
| Mean | 5.8 | 1.6 | 2.3 | 63.7 | 0.197 | ||||||
| SD | 2.6 | 0.8 | 0.3 | 7.4 | 0.02 | ||||||
| Count and % Achieved Performance Goal | 6 of 7 85.7% | 7 of 7 100% | 7 of 7 100% | 7 of 7 100% | 5 of 7 71.4% | ||||||
| High Paraplegia (HPara) | |||||||||||
| 8 | T1, A | 5.0 | 1 | 1.7 | 1 | 2.1 | 1 | 63 | 2 | 0.18 | 2 |
| 9 | T1, C | 6.0 | 2 | 1.3 | 2 | 2.1 | 2 | 63 | 3 | 0.19 | 3 |
| 10 | T3, A | 3.4 | 2 | 1.0 | 2 | 1.7 | 3 | 60 | 3 | 0.19 | 3 |
| 11 | T4, A | 5.5 | 2 | 2.5 | 1 | 2.7 | 2 | 60 | 2 | 0.17 | 3 |
| 12 | T4, A | 6.0 | 1 | 1.3 | 1 | 2.2 | 1 | 67 | 1 | 0.23 | 1 |
| 13 | T4, C | 3.8 | 2 | 1.4 | 2 | 2.3 | 3 | 66.6 | 3 | 0.20 | 3 |
| 14 | T5, A | 3.3 | 2 | 0.9 | 2 | 2.8 | 3 | 70.5 | 3 | 0.21 | 3 |
| 15 | T5, C | 6.1 | 1 | 1.6 | 1 | 1.8 | 1 | 67.9 | 2 | 0.21 | 2 |
| 16 | T5, C | 4.1 | 1 | 0.6 | 2 | 3.0 | 2 | 68.8 | 2 | 0.20 | 2 |
| Mean | 4.8 | 1.4 | 2.3 | 65.2 | 0.198 | ||||||
| SD | 1.2 | 0.6 | 0.5 | 3.8 | 0.02 | ||||||
| Count and % Achieved Performance Goal | 9 of 9 100% | 9 of 9 100% | 9 of 9 100% | 9 of 9 100% | 6 of 9 66.7% | ||||||
| Tetra (n=7) vs. HPara (n=9) | |||||||||||
| 95% CI Lower | −2.295 | −0.464 | −0.3525 | −8.075 | −0.027 | ||||||
| 95% CI Upper | 0.141 | 0.577 | 0.4938 | 0.74 | 0.003 | ||||||
| Effect Size (Cohen's d) | 0.523 | 0.309 | −0.086 | −0.272 | −0.038 | ||||||
| p value | 0.081 | 0.8257 | 0.1151 | 0.0996 | 0.1186 | ||||||
| Total Group (N = 16) | |||||||||||
| Mean or Count | 5.258 | 1.469 | 2.3111 | 64.55 | 0.198 | ||||||
| SD or Count | 1.913 | 0.647 | 0.379 | 5.51 | 0.018 | ||||||
| Count and % Achieved Performance Goal | 15 of 16 93.8% | 16 of 16 100% | 16 of 16 100% | 16 of 16 100% | 11 of 16 68.8% |
Table 2: Donning and Doffing Times, Walking-Test Performance, and Companion Level of Assistance Individual participant results and group summary statistics are presented for participants with tetraplegia (Tetra), high paraplegia (HPara), and the Total Group. Outcomes include donning time, doffing time, timed-up-and-go (TUG), 6-min walk test (6MWT), and 10-m walk test (10MWT). Predefined performance goals established before study initiation are shown for each assessment, and individual participant values are reported. The number and percentage of participants achieving each predefined performance goal are also reported. Data are presented as mean ± standard deviation (SD), counts, or percentages, as appropriate. Ninety-five percent confidence intervals (CI), effect sizes (Cohen’s d), and p values are reported for comparisons between participants with tetraplegia and high paraplegia. No statistically significant differences were observed between groups for any outcome measure (all p > 0.05). Companion level of assistance (LOA) was recorded for each assessment. Abbreviations: PID = participant identification number; NLI = neurological level of injury; AIS = American Spinal Injury Association Impairment Scale; LOA = level of assistance (1 = maximal assistance, 2 = intermittent assistance, 3 = close contact guard or no physical assistance); TUG = timed-up-and-go; 6MWT = 6-min walk test; 10MWT = 10-m walk test; min = minutes; m = meters; m/s = meters per second; SD = standard deviation; CI = confidence interval; Tetra = tetraplegia; HPara = high paraplegia. Please click here to download this Table.
Across the four training sessions and assessment session, there were no significant differences between Tetra and HPara for total session time (Figure 3A), upright time (Figure 3B), number of steps (Figure 3C), or distance walked (Figure 3D) (all p > .05). Both groups demonstrated significant improvements across sessions for all four outcomes (p < .0001) (Figure 3A–3D).
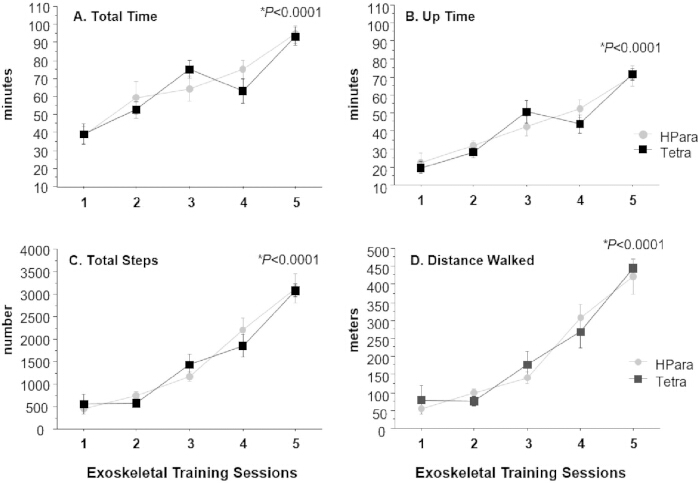
Figure 3. Performance During Exoskeleton-assisted Walking Training Sessions. Performance outcomes across four exoskeleton-assisted walking training sessions (1–4) and the assessment session (5) for participants with tetraplegia (Tetra, n = 7) and high paraplegia (HPara, n = 9). (A) Total session time. (B) Upright time. (C) Total number of steps. (D) Distance walked. Data are presented as mean ± standard deviation (SD). Both groups demonstrated significant improvements across training sessions for all outcome measures (repeated-measures ANOVA, main effect for sessions, p < 0.0001). Tetra = tetraplegia; HPara = high paraplegia. Please click here to view a larger version of this figure.
Fourteen of 16 participants (87.5%) successfully completed all six ADL tasks, whereas two participants (12.5%) successfully completed five of six ADL tasks by Session 4 (Table 3). Companion LOA during ADL performance is presented in Table 3.
| PID | NLI, AIS | 1. Hallway Walking and Manual Door Navigation | 2. Kitchen Counter and Shelf Activities | 3. Bathroom Sink and Mirror Activities | 4. Living-Room Activities | 5. Elevator Navigation | 6. Outdoor Walking ≥50 m | Completed All 6 ADLs | Completed 5 ADLs |
| Tetraplegia (Tetra) | |||||||||
| 1 | C4, A | 3 | 3 | 2 | 2 | 2 | 2 | ✓ | |
| 2 | C4, C | 2 | 2 | 2 | 2 | 2 | 3 | ✓ | |
| 3 | C5, B | 2 | 2 | 2 | 2 | 2 | 2 | ✓ | |
| 4 | C5, C | 1 | 2 | 2 | 1 | 1 | 2 | ✓ | |
| 5 | C5, D | 2 | 2 | 2 | 2 | 2 | 2 | ✓ | |
| 6 | C6, A | 1 | 1 | 1 | 1 | 1 | NT | ✓ | |
| 7 | C6, C | 1 | 1 | 1 | 1 | 1 | 2 | ✓ | |
| High Paraplegia (HPara) | |||||||||
| 8 | T1, A | 2 | 2 | 1 | 2 | 1 | 2 | ✓ | |
| 9 | T1, C | 2 | 1 | 1 | 1 | 2 | 1 | ✓ | |
| 10 | T3, A | 3 | 3 | 2 | 3 | 3 | 3 | ✓ | |
| 11 | T4, A | 2 | 3 | 2 | 3 | 2 | 3 | ✓ | |
| 12 | T4, A | 1 | 1 | 1 | 1 | 1 | 1 | ✓ | |
| 13 | T4, C | 3 | 3 | 3 | 3 | 2 | 3 | ✓ | |
| 14 | T5, A | 3 | 3 | 2 | 2 | 2 | NT | ✓ | |
| 15 | T5, C | 1 | 3 | 1 | 1 | 2 | 2 | ✓ | |
| 16 | T5, C | 1 | 1 | 1 | 1 | 1 | 1 | ✓ | |
| Total Participants (Count and % Achieved Performance Goal) | 14/16 87.5% | 2/16 12.5% | |||||||
Table 3: Activities of Daily Living Skills Achieved in the Exoskeleton and Level of Assistance Provided by the Companion. Companion level of assistance (LOA) was recorded during performance of six activities of daily living (ADLs): hallway walking and manual-door navigation, kitchen counter and shelf activities, bathroom sink and mirror activities, living-room activities, elevator navigation, and outdoor walking for at least 50 m. LOA scores were defined as 1 = maximal assistance, 2 = intermittent assistance, and 3 = close contact guard or no physical assistance. The number and percentage of participants achieving the predefined ADL performance goal are reported. Fourteen of sixteen participants (87.5%) successfully completed all six ADLs, whereas two of sixteen participants (12.5%) successfully completed five ADLs. Two SCI participants were not tested (NT) on the outdoor-walking assessment because of inclement weather. Abbreviations: PID = participant identification number; NLI = neurological level of injury; AIS = American Spinal Injury Association Impairment Scale; ADL = activity of daily living; LOA = level of assistance; Tetra = tetraplegia; HPara = high paraplegia; NT = not tested. Please click here to download this Table.
SCI device users reported a mean RPE of 9.2 ± 2.6, indicating mild exertion during exoskeleton use. Perceived safety ratings were high for both SCI device users (6.9 ± 0.3) and companions (6.5 ± 0.8), indicating a high level of perceived safety during device operation. Most participants consistently reported the highest safety ratings throughout the study.
Overall, the majority of SCI device users and companions achieved the prespecified performance goals for walking assessments and ADLs. Use of the self-balancing exoskeleton was associated with mild perceived exertion and high perceived safety ratings among both SCI device users and companions.
Supplementary File 1. Standardized descriptions of the functional performance assessments used during the study, including the 10-m Walk Test (10MWT), 6-min Walk Test (6MWT), Standardized Walking Obstacle Course (SWOC), activities of daily living (ADL) assessment, and donning/doffing assessment procedures. This file provides the standardized assessment procedures and outcome definitions referenced throughout the protocol to ensure consistent implementation across study sites.Please click here to download this file.
Supplementary File 2. Detailed trainer certification, participant screening, device fitting, trajectory generation, safety-system validation, training curriculum, progression criteria, certification procedures, and device maintenance protocols used during the study. This file provides the detailed operational procedures that support the methods described in the main protocol while maintaining the readability of the primary manuscript.Please click here to download this file.
Supplementary File 3. Standardized checklist of basic skills, critical tasks, and certification criteria used to evaluate competency of the SCI device user–companion pair during training and certification. This checklist was used to standardize competency assessment and certification across all participants and study sites.Please click here to download this file.
Supplementary File 4. Summary of standardized use scenarios, representative tasks, and usability evaluations performed during training and certification of SCI device user–companion pairs. This file summarizes the standardized use scenarios used to evaluate safe device operation and usability during participant training and certification.Please click here to download this file.
Discussion
This prospective study describes the training methods used to teach individuals with tetraplegia (Tetra) and high paraplegia (HPara) to use a self-balancing exoskeleton over four training sessions. In this sample of 16 SCI device users and 16 companions, preliminary findings support the feasibility of achieving the walking and mobility skills required to operate the device. Companion assistance, measured by LOA, was most frequently required during donning and doffing and least frequently required during walking assessments. Within the limitations of this small sample, no SAEs occurred, and no AEs resulted in study withdrawal.
Individuals with tetraplegia have not previously been systematically trained and evaluated for the use of exoskeleton-assisted walking devices in personal, home, and community settings. Similarly, individuals with paraplegia at T6 and above have had limited access to exoskeletons for personal or home use because of impaired trunk musculature and reduced postural control25,26,27. The present study demonstrated the feasibility of performing complex mobility tasks, including sit-to-stand transitions, continuous walking, turning, and controlled stopping with a self-balancing exoskeleton.
Notably, the self-balancing design may fill a critical gap for individuals with higher-level SCI who lack sufficient hand function and/or trunk stability required for traditional crutch-dependent systems31,32,33,34,35,36,37. This technology also enables a new group of users to perform hands-free ADLs, such as personal hygiene at a sink and food preparation and cleanup tasks in the kitchen, which are challenging with earlier-generation exoskeletal devices.
Although gait speed and walking distance were not primary outcomes of this study, both measures depend on the device’s programmed walking speed and the user’s ability to perform timely weight shifts. Walking speeds achieved in this study were lower than those reported for the two other FDA-cleared exoskeletons intended for personal use11,13,21. Higher exoskeleton-assisted walking speeds reported in the literature are typically achieved with assistive device-dependent exoskeletons by individuals with lower-level SCI who can actively contribute to weight shifting and gait initiation13,21. Additional improvements in walking performance may be achieved with greater training exposure, as demonstrated in longer-duration studies of assistive device-dependent exoskeletons10,21. Nevertheless, the present findings suggest that overground walking can be achieved by individuals with high-level SCI after only four or five training sessions. The walking speeds and distances observed in this study may be sufficient for indoor use of the device.
The small sample size limits the generalizability of these findings. In addition, training and assessments were conducted in controlled environments and may not fully reflect the complexity and variability of home and community settings. Furthermore, the training protocol focused on short-term usability and feasibility; long-term skill retention and sustained effects on health, function, and quality of life were not evaluated.
An important implication of this protocol is that both SCI device users and companions were able to acquire the necessary skills within a relatively short training period. This clinically feasible timeframe is consistent with previous reports demonstrating that structured exoskeleton training can successfully teach powered overground walking skills in individuals with SCI13,21,28. To our knowledge, this is the first exoskeleton-assisted walking clinical trial to focus on three novel areas: (1) evaluation of a self-balancing exoskeleton intended for personal use; (2) inclusion of individuals with Tetra and HPara; and (3) joint training and evaluation of SCI device users and their companions to achieve safe operation, mobility proficiency, and performance of ADLs.
Disclosures
The authors declare no conflicts of interest related to the research, authorship, or publication of this article. Although this study received partial industry funding from Wandercraft, Inc., the investigators did not receive any personal financial compensation from the company.
Employees of Wandercraft, Inc., were not involved in participant recruitment, data collection, data analysis, interpretation of the results, or preparation of the Results section of this manuscript. The study investigators maintained full responsibility for the study design, conduct, data analysis, interpretation of the findings, and manuscript preparation.
Acknowledgements
The authors gratefully acknowledge the individuals who generously gave their time to participate in this study. The authors also acknowledge the institutional support provided by the James J. Peters Veterans Affairs Medical Center and the Kessler Foundation/Kessler Institute for Rehabilitation. This study was partially supported by Wandercraft, Inc., through an industry-sponsored grant administered under Cooperative Research and Development Agreements at each study site with appropriate ethical and legal approvals. Additional staffing and facility support were provided by the Spinal Cord Damage Research Center and the Spinal Cord Injury and Disorders Service at the James J. Peters Veterans Affairs Medical Center (Bronx, NY, USA), and by the Kessler Foundation/Kessler Institute for Rehabilitation (West Orange, NJ, USA).
Materials
| Name | Company | Catalog Number | Comments |
|---|---|---|---|
| Accusplit Pro Survivor 601X Stopwatch | Accusplit | 601X | Used to time donning/doffing, Timed Up and Go (TUG), 10-Meter Walk Test (10MWT), 6-Minute Walk Test (6MWT), and Standardized Walking Obstacle Course (SWOC) assessments. |
| Battery Charger | Wandercraft, Inc. | N/A | Used to recharge the exoskeleton battery before device use. |
| Defender 3000 Washdown Floor Scales | OHAUS Corporation | i-DF33 | Used to measure the combined and independent weights of the SCI participant, wheelchair, and other mobility devices. |
| Duro-Med Transfer Board, 8 in × 30 in | Briggs Healthcare | 518-1754-0400 | Used for wheelchair-to-exoskeleton transfers when required. |
| Hydrogen peroxide-based cleaner | Any commercially available | N/A | Used to clean and disinfect user-contact and companion-contact surfaces after each use. |
| Joystick Attachments | Wandercraft, Inc. | N/A | Three joystick attachment options provided for user selection based on comfort and hand-control ability. |
| LEAP Stopwatch | Leaptimer Industrial Co., Ltd. | PC2810 | Used to time donning/doffing, Timed Up and Go (TUG), 10-Meter Walk Test (10MWT), 6-Minute Walk Test (6MWT), and Standardized Walking Obstacle Course (SWOC) assessments. |
| Lunar iDXA Advance with iDXA Table, iDXA Advanced Package Software, Corescan Software, and Orthopedic Knee Software | GE Healthcare, Inc. | H8646LA, H8696AM, H8801CS, H8650KN | Dual-energy X-ray absorptiometry (DXA) scanner used to measure total body mass (weight), hip T-scores, and knee bone mineral density (BMD). |
| Olympic Barbell Collars, 2 in | RitFit | N/A | Used to secure weight plates during companion screening procedures. |
| Olympic Weight Plates | Wostoo | N/A | Used during companion screening procedures. |
| Physiotherapy Table (Bariatric Space Saver Wall Folding Mat Platform Model 1422) | Hausmann Industries, Inc. | 1422-3078-L01V26 | Used for SCI participant anthropometric and range-of-motion measurements during screening. Also used for participant stretching activities before and after study sessions. |
| Plastic Foot Wedges | Wandercraft, Inc. | N/A | Used to compensate for limited ankle dorsiflexion during device fitting. |
| Protective Foam Padding | Wandercraft, Inc. | N/A | Applied to device-contact locations when needed to improve comfort and reduce friction. |
| Self-Balancing Exoskeleton | Wandercraft, Inc. | N/A | Powered lower-extremity exoskeleton with self-balancing capability used for participant training and evaluation. |
| Super Sani-Cloth Large Canister (160 wipes) | PDI Healthcare, Inc. | Q55172 | Used to clean and disinfect user-contact and companion-contact surfaces after each use. Active ingredients include 55% isopropyl alcohol and 0.50% quaternary ammonium compounds. A minimum contact time of 2 min was used for disinfection. |
| Vital Signs Monitor 6000 Series | Welch Allyn | 901060 | Used to record blood pressure and heart rate before, during, and after exoskeleton use. |
| Vital Signs Monitor with Radical-7 Touchscreen and Stand | Masimo Corporation | Root Multimodal Base 9515; Radical-7 RDS7A | Used to record blood pressure and heart rate before, during, and after exoskeleton-use sessions. |
References
- Kirshblum S, Schmidt Read M, Rupp R. Classification challenges of the 2019 revised International Standards for Neurological Classification of Spinal Cord Injury (ISNCSCI). Spinal Cord. 2022;60:11-17.
- Lynch AC, et al. Bowel dysfunction following spinal cord injury: a description of bowel function in a spinal cord-injured population and comparison with age and gender matched controls. Spinal Cord. 2000;38:717-723.
- Park SE, et al. Impact of bladder, bowel and sexual dysfunction on health status of people with thoracolumbar spinal cord injuries living in the community. J Spinal Cord Med. 2017;40:548-559.
- Koyuncu E, et al. Neurogenic bowel dysfunction and its effect on quality of life in patients with spinal cord injury. J PMR Sci. 2017;20:77-82.
- Zhu C, et al. A retrospective chart review of heart rate and blood pressure abnormalities in veterans with spinal cord injury. J Spinal Cord Med. 2013;36:463-475.
- Wecht JM, Bauman WA. Implication of altered autonomic control for orthostatic tolerance in SCI. Auton Neurosci. 2018;209:51-58.
- Handrakis JP, et al. Self-reported effects of cold temperature exposure in persons with tetraplegia. J Spinal Cord Med. 2017;40:389-395.
- Spungen AM, Dicpinigaitis PV, Almenoff PL, Bauman WA. Pulmonary obstruction in individuals with cervical spinal cord lesions unmasked by bronchodilator administration. Spinal Cord. 1993;31(6):404-407.
- Spungen AM, et al. Self-reported prevalence of pulmonary symptoms in subjects with spinal cord injury. Spinal Cord. 1997;35:652-657.
- Edwards DJ, et al. Walking improvement in chronic incomplete spinal cord injury with exoskeleton robotic training (WISE): a randomized controlled trial. Spinal Cord. 2022;60:522-532.
- Esquenazi A, Talaty M, Packel A, Saulino M. The ReWalk powered exoskeleton to restore ambulatory function to individuals with thoracic-level motor-complete spinal cord injury. Am J Phys Med Rehabil. 2012;91:911-921.
- Spungen AM, et al. Exoskeletal-assisted walking in veterans with paralysis: a randomized clinical trial. JAMA Netw Open. 2024;7:e2431501.
- Tefertiller C, et al. Initial outcomes from a multicenter study utilizing the Indego powered exoskeleton in spinal cord injury. Top Spinal Cord Inj Rehabil. 2018;24:78-85.
- Tsai CY, et al. Exoskeletal-assisted walking during acute inpatient rehabilitation leads to motor and functional improvement in persons with spinal cord injury: a pilot study. Arch Phys Med Rehabil. 2020;101:607-612.
- Yang A, et al. Assessment of in-hospital walking velocity and level of assistance in a powered exoskeleton in persons with spinal cord injury. Top Spinal Cord Inj Rehabil. 2015;21:100-109.
- Zeilig G, et al. Safety and tolerance of the ReWalk exoskeleton suit for ambulation by people with complete spinal cord injury: a pilot study. J Spinal Cord Med. 2012;35:96-101.
- Asselin P, et al. Effect of exoskeletal-assisted walking on soft tissue body composition in persons with spinal cord injury. Arch Phys Med Rehabil. 2021;102:196-202.
- Asselin P, et al. Heart rate and oxygen demand of powered exoskeleton-assisted walking in persons with paraplegia. J Rehabil Res Dev. 2015;52:147-158.
- Chun A, et al. Changes in bowel function following exoskeletal-assisted walking in persons with spinal cord injury: an observational pilot study. Spinal Cord. 2020;58:459-466.
- Gorman PH, et al. The effect of exoskeletal-assisted walking on spinal cord injury bowel function: results from a randomized trial and comparison to other physical interventions. J Clin Med. 2021;10(5):964.
- Hong E, et al. Mobility skills with exoskeletal-assisted walking in persons with SCI: results from a three-center randomized clinical trial. Front Robot AI. 2020;7:93.
- Knezevic S, et al. Oxygen uptake during exoskeletal-assisted walking in persons with paraplegia. Arch Phys Med Rehabil. 2021;102:185-195.
- Raab K, Krakow K, Tripp F, Jung M. Effects of training with the ReWalk exoskeleton on quality of life in incomplete spinal cord injury: a single case study. Spinal Cord Ser Cases. 2016;2:15025.
- Tamburella F, et al. Overground robotic training effects on walking and secondary health conditions in individuals with spinal cord injury: systematic review. J Neuroeng Rehabil. 2022;19:27.
- Marinov B. Indego cleared by FDA for clinical and personal use [Internet]. Available from: https://exoskeletonreport.com/2016/03/indego-cleared-fda-clinical-personal-use/. Published 2016.
- Marinov B. Intended use of the 11 FDA-approved medical exoskeletons in 2023 [Internet]. Available from: https://exoskeletonreport.com/2023/03/intended-use-of-the-11-fda-approved-medical-exoskeletons-in-2023/. Published 2023.
- ReWalk Robotics. ReWalk personal exoskeleton. Marlborough (MA): ReWalk Robotics; 2014.
- Asselin PK, et al. Training persons with spinal cord injury to ambulate using a powered exoskeleton. J Vis Exp. 2016;112:54071.
- Ramanujam A, et al. Mechanisms for improving walking speed after longitudinal powered robotic exoskeleton training for individuals with spinal cord injury. In: Proceedings of the Annual International Conference of the IEEE Engineering in Medicine and Biology Society; 2018. p. 2805-2808.
- Ramanujam A, et al. Dynamic margins of stability during robot-assisted walking in able-bodied individuals: a preliminary study. Front Robot AI. 2020;7:574365.
- Strickland E. An exoskeleton made for dancing: the self-balancing Xomotion promises greater agility. IEEE Spectrum. 2025;62(6):24-63.
- Honari D, et al. XoPercept: fine-grained RGB-D perception and mapping for safe navigation in wearable humanoid exoskeletons. In: IEEE-RAS 24th International Conference on Humanoid Robots (Humanoids); Seoul, Republic of Korea; 2025. p. 609-616.
- Tian D, et al. Self-balancing exoskeleton robots designed to facilitate multiple rehabilitation training movements. IEEE Trans Neural Syst Rehabil Eng. 2024;32:293-303.
- Kerdraon J, et al. Evaluation of safety and performance of the self-balancing walking system Atalante in patients with complete motor spinal cord injury. Spinal Cord Ser Cases. 2021;7:71.
- Tian D, et al. A self-balancing bipedal exoskeleton AutoLEE-G3 with bioinspired design and control. IEEE/ASME Trans Mechatron. 2025:1-12. doi:10.1109/TMECH.2025.3642327.
- Tian D, et al. Biomimetic viscoelastic compliance control for self-balancing lower limb exoskeleton. IEEE Trans Ind Inform. 2024;20:13502-13512.
- Wandercraft. Eve self-balancing exoskeleton [Internet]. Available from: https://en.wandercraft.eu/. Accessed on February 13, 2026.
- Wandercraft. Walking at home and outdoors with Eve [Internet]. Available from: https://en.wandercraft.eu/. Published 2025.
- Held SL, Kott KM, Young BL. Standardized Walking Obstacle Course (SWOC): reliability and validity of a new functional measurement tool for children. Pediatr Phys Ther. 2006;18(1):23-30.
- Cohen J. Statistical power analysis for the behavioral sciences. 2nd ed. Hillsdale (NJ): Lawrence Erlbaum Associates; 1988.
Reprints and Permissions
This article has been published
Video Coming Soon