This retrospective study shows that higher body mass index is independently associated with greater acute postoperative pain intensity and increased opioid requirements after laparoscopic cholecystectomy, supporting BMI-informed perioperative pain assessment and individualized analgesic planning.
Research Article
Association Between Body Mass Index and Acute Postoperative Pain Following Laparoscopic Cholecystectomy: A Retrospective Clinical Study
July 7th, 2026
Opens in a new tab
In This Article
Summary
Loading...
$$\rightleftharpoonup{xx}$$
$$\longleftharp{xx}$$,
$$\longrightharp{xx}$$,
Abstract
Loading...
$$\rightleftharpoonup{xx}$$
$$\longleftharp{xx}$$,
$$\longrightharp{xx}$$,
Obesity has been increasingly recognized as a factor associated with altered pain perception and postoperative analgesic requirements; however, its relationship with acute postoperative pain following laparoscopic cholecystectomy remains incompletely defined. This retrospective observational study investigated the association between body mass index (BMI) and acute postoperative pain severity in adult patients undergoing elective laparoscopic cholecystectomy. Ninety-six patients were categorized into obese and non-obese groups according to BMI criteria for Chinese adults. Demographic characteristics, perioperative variables, postoperative numeric rating scale (NRS) pain scores at multiple time points, and opioid consumption converted to oral morphine equivalents (OME) were collected from medical records. Multivariable logistic regression was used to evaluate the association between BMI and moderate-to-severe postoperative pain, defined as a 24 h mean NRS score ≥4. Compared with non-obese patients, obese patients had higher NRS scores at 6 h, 12 h, and 24 h after surgery, higher first NRS scores in the post-anesthesia care unit, and greater postoperative opioid consumption. In the adjusted regression model, continuous BMI was independently associated with moderate-to-severe postoperative pain after adjustment for age, sex, American Society of Anesthesiologists classification, and intraoperative opioid consumption. These findings suggest that elevated BMI is associated with greater acute postoperative pain severity and analgesic requirements after laparoscopic cholecystectomy. BMI-informed perioperative risk assessment may help guide individualized postoperative pain management in this patient population.
Introduction
Loading...
$$\rightleftharpoonup{xx}$$
$$\longleftharp{xx}$$,
$$\longrightharp{xx}$$,
Laparoscopic cholecystectomy (LC) is one of the most widely performed minimally invasive abdominal procedures and is generally associated with less tissue trauma and faster recovery than open surgery. Nevertheless, clinically relevant acute postoperative pain may still occur after LC, and insufficient analgesia can delay mobilization, increase opioid exposure, and reduce patient satisfaction. Current postoperative pain management increasingly emphasizes procedure-specific assessment, multimodal analgesia, and opioid stewardship rather than uniform opioid-based regimens for all patients1,2.
Obesity is common among surgical patients and may influence perioperative pain and analgesic requirements through several mechanisms, including chronic low-grade inflammation, altered respiratory mechanics, increased abdominal wall thickness, and changes in opioid pharmacokinetics or pharmacodynamics3,4. These features are particularly relevant after LC, in which trocar-site pain, visceral pain related to pneumoperitoneum, and shoulder or diaphragmatic discomfort may coexist during the early postoperative period. However, interpretation of early postoperative pain after LC remains challenging because pain outcomes may be influenced by analgesic technique, anesthetic management, postoperative rescue analgesia, and the timing and method of pain assessment1,5,6.
For an international readership, it is important to clarify that this study used the obesity threshold recommended for Chinese adults. According to the Chinese adult body weight classification standard, obesity is defined as BMI ≥28.0 kg/m2, which is lower than the conventional World Health Organization threshold of BMI ≥30.0 kg/m2 commonly used in Western populations. This distinction reflects population-specific differences in body composition and obesity-related metabolic risk. Therefore, using BMI ≥28.0 kg/m2 is clinically appropriate for a Chinese surgical cohort and may improve the applicability of perioperative risk stratification in this population7.
Previous studies have evaluated postoperative pain after LC and have examined analgesic techniques such as non-steroidal anti-inflammatory drugs (NSAIDs), local anesthetic infiltration, regional blocks, and opioid-sparing strategies1,6,8. However, fewer studies have specifically quantified the independent association between BMI and early postoperative pain while accounting for perioperative covariates and standardized postoperative analgesic criteria. In addition, obese patients may require more cautious postoperative opioid use because of increased risks related to airway obstruction, hypoventilation, and opioid-induced respiratory depression9. These considerations support the need for BMI-informed pain assessment and individualized analgesic planning, particularly in patients with more severe obesity or higher opioid-related respiratory risk1,8,9.
This single-center retrospective observational study analyzed adult patients who underwent elective LC. The study aimed to evaluate whether BMI was independently associated with moderate-to-severe acute postoperative pain, defined as a 24 h mean NRS score ≥4, after adjustment for selected preoperative and intraoperative factors. Compared with previous approaches that focus on single pain assessments or unadjusted group comparisons, this study integrated serial postoperative pain scores, postoperative opioid consumption expressed as oral morphine equivalents (OME), standardized rescue analgesia criteria, and multivariable adjustment for perioperative covariates. The findings may provide practical evidence for BMI-informed postoperative pain assessment and individualized analgesic management after LC.
Protocol
Loading...
$$\rightleftharpoonup{xx}$$
$$\longleftharp{xx}$$,
$$\longrightharp{xx}$$,
This retrospective observational study was approved by the Ethics Committee of Anji County Hospital of Traditional Chinese Medicine (approval No. 2025-13). The requirement for written informed consent was waived by the Ethics Committee because this study used de-identified retrospective clinical data and involved no additional patient intervention. This study was reported in accordance with the Strengthening the Reporting of Observational Studies in Epidemiology (STROBE) guideline, and the completed STROBE checklist is provided as Supplementary File 1. The reagents, equipment, and software used are listed in the Table of Materials.
1. Study population and patient screening
Adult patients who underwent elective laparoscopic cholecystectomy at Anji County Hospital of Traditional Chinese Medicine between January 2025 and September 2025 were retrospectively screened using the hospital electronic medical record (EMR) system and anesthesia information system. The screening process is summarized in Supplementary Figure 1. A total of 132 potentially eligible patients were initially screened, and 36 were excluded according to the predefined eligibility criteria or because of incomplete key data. Finally, 96 patients were included in the final analysis, including 50 patients in the non-obese group and 46 patients in the obese group.
Patients were eligible if they met all of the following criteria: age 18–65 years; first-time elective laparoscopic cholecystectomy; American Society of Anesthesiologists (ASA) physical status I-II; general anesthesia with tracheal intubation; and complete records of height, body weight, perioperative variables, postoperative pain scores, and postoperative analgesic administration. Patients were excluded if they had a history of chronic pain or long-term use of analgesics, sedatives, antidepressants, or anxiolytic drugs; severe cardiac, pulmonary, hepatic, or renal dysfunction, or ASA physical status ≥III; a history of opioid or alcohol abuse; conversion from laparoscopic to open surgery; combined neuraxial anesthesia or regional nerve block; or missing or unclear key data, including pain scores, perioperative medication records, or opioid dosage information.
2. BMI grouping
Preoperative height and body weight were extracted from the EMR system. BMI was calculated as body weight in kilograms divided by height in meters squared. Patients were classified according to the Chinese adult body weight classification standard, in which obesity is defined as BMI ≥28.0 kg/m2 and non-obesity as BMI <28.0 kg/m2. BMI was used both as a categorical variable for intergroup comparisons and as a continuous variable in the multivariable logistic regression model.
3. Outcome measures and definitions
The primary outcome was moderate-to-severe postoperative pain, defined as a 24 h mean NRS score ≥4. The 24 h mean NRS score was calculated as the average of the NRS scores recorded at 6 h, 12 h, and 24 h after surgery. Secondary outcomes included the first NRS score in the post-anesthesia care unit (PACU), NRS scores at 6 h, 12 h, and 24 h after surgery, postoperative opioid consumption converted to oral morphine equivalents (OME), operative duration, anesthesia duration, time to first ambulation, length of hospital stay, and postoperative nausea and vomiting (PONV) within 24 h after surgery.
Operative duration was defined as the interval from skin incision to completion of skin closure. Anesthesia duration was defined as the interval from initiation of anesthetic induction to completion of tracheal extubation. Time to first ambulation was extracted from nursing documentation. Length of hospital stay was calculated from admission and discharge records in the EMR system.
4. NRS pain assessment
Postoperative pain intensity was assessed using the 11-point NRS, ranging from 0 to 10. A score of 0 indicated no pain, 1–3 indicated mild pain, 4–6 indicated moderate pain, and 7–10 indicated severe pain. Pain was assessed at rest using the standardized prompt: “Please rate your current pain at rest on a scale from 0 to 10, where 0 means no pain, and 10 means the most severe pain imaginable.” Only resting NRS scores were used for the present analysis.
NRS scores were recorded by trained PACU or ward nursing staff according to the institutional postoperative pain assessment routine. The first PACU NRS score was defined as the first valid pain score obtained after the patient had regained consciousness, was clinically stable, and was able to provide a self-reported pain score. Subsequent NRS scores were recorded at 6 h, 12 h, and 24 h after surgery. The first PACU NRS score was usually assessed within 30 min after PACU arrival. Because this was a retrospective study based on routine clinical care, nurses were not specifically blinded to BMI status; however, pain scores were collected before study grouping and statistical analysis. If duplicate NRS assessments were available at the same time point, the score recorded closest to the scheduled time point was used.
5. Perioperative anesthesia and monitoring
All patients underwent standardized general anesthesia with tracheal intubation (following institutionally approved protocols). After entering the operating room, routine monitoring was established, including electrocardiography, noninvasive blood pressure, pulse oxygen saturation, end-tidal carbon dioxide, and body temperature monitoring. When available, depth of anesthesia was monitored using bispectral index monitoring, with the anesthetic depth adjusted according to routine institutional practice.
Anesthesia was induced intravenously with propofol at 1.5β2.5 mg/kg, sufentanil at 0.2–0.4 µg/kg or an equivalent opioid dose, and a nondepolarizing neuromuscular blocking agent such as rocuronium at 0.6–0.9 mg/kg or cisatracurium at 0.15–0.2 mg/kg. Tracheal intubation was performed after adequate loss of consciousness and neuromuscular relaxation. Anesthesia was maintained with inhalational anesthetics and/or intravenous anesthetics according to the attending anesthesiologist’s routine practice, with opioids administered as needed to maintain hemodynamic stability and adequate analgesia. Ventilation was adjusted to maintain end-tidal carbon dioxide within the clinically acceptable range.
Intraoperative opioid administration was extracted from anesthesia records, including opioid name, route of administration, dose, and administration time. Operative duration, anesthesia duration, and intraoperative monitoring variables were obtained from the anesthesia information system. No neuraxial anesthesia or regional nerve block was used in either group, thereby reducing heterogeneity related to regional analgesic techniques. Body temperature was monitored throughout anesthesia, and warming measures were applied when clinically indicated to maintain perioperative normothermia. The consistency of key perioperative anesthesia and analgesia-related measures between groups is summarized in Supplementary Table 1.
6. Postoperative analgesic protocol and safety monitoring
The same postoperative pain assessment schedule and rescue analgesia criteria were applied to both obese and non-obese patients. Postoperative pain was routinely assessed using the NRS. Rescue analgesia was administered when NRS ≥4 according to the institutional postoperative analgesic protocol. The indication for rescue analgesia was identical between groups. Rescue analgesia consisted of intravenous opioid supplementation and/or non-steroidal anti-inflammatory drugs (NSAIDs), according to clinical judgment, patient condition, and contraindications. All postoperative analgesic exposure within the first 24 h after surgery was extracted from medical orders and nursing administration records, including drug name, dose, route, administration time, and frequency.
For patients receiving postoperative opioid rescue analgesia, respiratory safety monitoring was performed in the PACU and ward according to routine postoperative nursing practice. Monitoring included level of consciousness, respiratory rate, pulse oxygen saturation, and clinical signs of respiratory depression, including excessive sedation, hypoventilation, airway obstruction, or oxygen desaturation. In obese patients, particular attention was paid to respiratory status because obesity may increase susceptibility to opioid-related hypoventilation and airway obstruction. When clinically indicated, supplemental oxygen, intensified observation, or physician reassessment was provided according to institutional postoperative care procedures.
7. PONV assessment
Postoperative nausea and vomiting (PONV) within 24 h after surgery was extracted from nursing records and medical orders. PONV was defined as any documented nausea, retching, or vomiting episode, or the administration of rescue antiemetic medication within the first 24 h after surgery. The incidence of PONV was compared between the obese and non-obese groups.
8. Calculation of Postoperative Opioid Consumption (OME)
Postoperative opioid consumption was extracted from electronic medical orders and nursing administration records within the first 24 h after surgery. For each opioid administration, the drug name, route, dose, and administration time were recorded. To allow comparison across different opioid agents and routes, all opioid doses were converted to OME using the formula: OME (mg) = administered dose × conversion factor.
Dose units were standardized before conversion. Morphine, oxycodone, and tramadol doses were expressed in milligrams, whereas fentanyl and sufentanil doses were expressed in micrograms. The conversion factors used in this study are listed in Supplementary Table 2 and were adapted from published OME conversion literature. The total 24 h postoperative OME was calculated by summing all converted opioid doses administered during the first 24 h after surgery. Intraoperative opioid exposure was also converted to OME using the same conversion approach and included as a covariate in the multivariable regression model.
9. Data extraction and quality control
Demographic characteristics, BMI, ASA physical status, operative duration, anesthesia duration, intraoperative opioid consumption, postoperative opioid consumption, postoperative NSAID use, PONV, time to first ambulation, length of hospital stay, and postoperative NRS scores were extracted from the EMR system, anesthesia information system, and nursing records. A standardized data extraction form was used before statistical analysis.
To improve data reliability, extracted data were checked against the original electronic records. Implausible or inconsistent values, including BMI, NRS scores, opioid doses, operative duration, and anesthesia duration, were rechecked using the original source records. Records were considered incomplete if any key variable required for primary outcome definition or multivariable regression analysis was missing or unclear. Incomplete records were excluded from the final analysis rather than imputed. Nine records with missing or unclear key variables were excluded rather than imputed. After exclusion, no missing values remained for variables included in the primary outcome definition or multivariable regression analysis.
10. Statistical analysis
Statistical analyses were performed using SPSS software, version 26.0. Continuous variables were assessed for normality using the Kolmogorov-Smirnov test and for homogeneity of variance using Levene’s test. Normally distributed continuous variables were presented as mean ± standard deviation and compared using the independent-samples t-test. Non-normally distributed continuous variables were presented as median [interquartile range] and compared using the Mann-Whitney U test. Categorical variables were presented as n (%) and compared using the chi-square test or Fisher’s exact test, as appropriate.
A multivariable logistic regression model was constructed to evaluate the association between continuous BMI and moderate-to-severe postoperative pain. The dependent variable was moderate-to-severe postoperative pain, defined as a 24 h mean NRS score ≥4. The independent variables included BMI, age, sex, ASA physical status, and intraoperative opioid consumption. NRS-related variables were not included as covariates to avoid circular definition bias. The regression model was fitted using the enter method. Regression coefficients, standard errors, Wald χ2 values, odds ratios (ORs), 95% confidence intervals (CIs), and P values were reported.
Multicollinearity among regression covariates was assessed using variance inflation factors (VIFs), with VIF values <5 considered to indicate no substantial multicollinearity. Model discrimination was evaluated using the C-statistic, equivalent to the area under the receiver operating characteristic curve. Model calibration was evaluated using the Hosmer-Lemeshow goodness-of-fit test. Because sex may be clinically associated with postoperative pain, an exploratory sex × BMI interaction term was tested to assess whether the association between BMI and moderate-to-severe postoperative pain differed by sex.
Because this was a single-center retrospective study with a limited sample size, a post-hoc power analysis was performed for the primary continuous pain outcome using the observed between-group difference in the 24 h mean NRS score. The analysis was based on a two-sided independent-samples t-test, α = 0.05, n = 50 in the non-obese group, n = 46 in the obese group, and the observed group means and standard deviations. The estimated post-hoc power was >0.99. However, because the multivariable logistic regression model included 32 moderate-to-severe postoperative pain events and five covariates, corresponding to approximately 6.4 events per predictor variable, the regression analysis was interpreted cautiously as exploratory.
The number needed to harm (NNH) was calculated using the absolute risk increase in moderate-to-severe postoperative pain between the obese and non-obese groups. The formula was NNH = 1 / (risk in the obese group - risk in the non-obese group), and the result was rounded up to the nearest whole number. All statistical tests were two-sided, and P < 0.05 was considered statistically significant.
Results
Loading...
$$\rightleftharpoonup{xx}$$
$$\longleftharp{xx}$$,
$$\longrightharp{xx}$$,
Patient screening and baseline characteristics
A total of 132 patients who underwent elective laparoscopic cholecystectomy during the study period were initially screened and assessed for eligibility. Among them, 36 patients were excluded, including 6 patients aged <18 or >65 years, 5 patients with ASA physical status ≥III, 7 patients with chronic pain or long-term use of analgesics, sedatives, antidepressants, or anxiolytics, 2 patients with a history of opioid or alcohol abuse, 4 patients who were converted to open surgery, 3 patients who received combined neuraxial anesthesia or regional nerve block, and 9 patients with missing or unclear key data. Finally, 96 eligible patients were included in the final analysis, including 50 patients in the non-obese group and 46 patients in the obese group. The patient screening and selection process is summarized in Supplementary Figure 1.
The mean BMI was significantly higher in the obese group than in the non-obese group [(32.66 ± 3.87) kg/m2 vs. (22.83 ± 2.61) kg/m2, P < 0.001]. No statistically significant differences were observed between the two groups in age, sex distribution, ASA physical status, or length of hospital stay (all P > 0.05). These findings indicate that the two groups were broadly comparable in the main recorded demographic and perioperative baseline variables, except for BMI. Detailed baseline characteristics are shown in Table 1.
Perioperative parameters and analgesic exposure
Perioperative variables are summarized in Table 2. Postoperative opioid consumption, expressed as OME, was significantly higher in the obese group than in the non-obese group [(12.70 ± 4.03) mg vs. (7.64 ± 7.85) mg, P < 0.001]. In contrast, operative duration, anesthesia duration, intraoperative opioid consumption, postoperative NSAID use, time to first ambulation, and the incidence of PONV did not differ significantly between the two groups (all P > 0.05).
Because the same postoperative pain assessment schedule and rescue analgesia criteria were applied to both groups, the higher postoperative OME in the obese group was interpreted as reflecting greater postoperative analgesic requirements rather than different analgesic indications between groups. The consistency of key perioperative anesthesia and analgesia-related measures between groups is summarized in Supplementary Table 1.
Postoperative NRS scores within 24 h after surgery
Postoperative NRS scores are shown in Table 3. Compared with the non-obese group, the obese group had significantly higher NRS scores at 6 h (4.39 ± 1.45 vs. 3.20 ± 1.44, P < 0.001), 12 h (3.98 ± 1.44 vs. 2.56 ± 0.79, P < 0.001), and 24 h (3.24 ± 1.08 vs. 2.38 ± 0.53, P < 0.001) after surgery. The 24 h mean NRS score was also significantly higher in the obese group than in the non-obese group (3.87 ± 1.17 vs. 2.72 ± 0.61, P < 0.001). The between-group difference in the 24 h mean NRS score was 1.15 points, which may be clinically meaningful based on published thresholds for meaningful changes in acute pain scores.
The first NRS score in the PACU was also higher in the obese group than in the non-obese group (3.04 ± 1.30 vs. 2.38 ± 1.07, P = 0.005). All NRS scores reported in this study were resting pain scores collected by trained PACU or ward nursing staff according to the institutional postoperative pain assessment routine.
Incidence of moderate-to-severe postoperative pain and clinical effect size
Overall, 32 of 96 patients (33.33%) developed moderate-to-severe postoperative pain, defined as a 24 h mean NRS score ≥4. The incidence of moderate-to-severe postoperative pain was 30 of 46 patients (65.2%) in the obese group and 2 of 50 patients (4.0%) in the non-obese group. The absolute risk increase was 61.2 percentage points, corresponding to a number needed to harm (NNH) of approximately 2. These results suggest that the observed association between obesity and postoperative pain was not only statistically significant but also clinically relevant.
Multivariable logistic regression analysis
To reduce circular definition bias, NRS-related variables were excluded from the multivariable logistic regression model. The model included continuous BMI, age, sex, ASA physical status, and intraoperative opioid consumption as covariates. Moderate-to-severe postoperative pain was defined as a 24 h mean NRS score ≥4, with 32 events observed among 96 patients.
Continuous BMI was independently associated with moderate-to-severe postoperative pain after adjustment for these covariates (β = 0.317, SE = 0.069, Wald χ2 = 21.204, P < 0.001, OR = 1.374, 95% CI: 1.200–1.572). This finding indicates that each 1 kg/m2 increase in BMI was associated with a 37.4% increase in the odds of moderate-to-severe postoperative pain (Supplementary Table 3).
Sex was not significantly associated with moderate-to-severe postoperative pain in the adjusted model (female vs male: β = 0.813, SE = 0.599, Wald χ2 = 1.840, P = 0.175, OR = 2.254, 95% CI: 0.697–7.294). Age was also not statistically significant (β = 0.029, SE = 0.028, Wald χ2 = 1.081, P = 0.298, OR = 1.030, 95% CI: 0.975–1.087). ASA physical status (β = -0.844, SE = 0.599, Wald χ2 = 1.987, P = 0.158, OR = 0.430, 95% CI: 0.133–1.387) and intraoperative opioid consumption (β = -0.006, SE = 0.010, Wald χ2 = 0.380, P = 0.538, OR = 0.994, 95% CI: 0.975–1.013) were not significantly associated with moderate-to-severe postoperative pain. The full regression results are shown in Table 4 and Figure 1.
Model diagnostics were further assessed. Multicollinearity was not substantial, as all variance inflation factors were below the prespecified threshold. Model discrimination was good, with a C-statistic/AUC of 0.872. Model calibration was acceptable according to the Hosmer-Lemeshow goodness-of-fit test (P = 0.345). The sex × BMI interaction was not statistically significant (P = 0.723), suggesting that the association between BMI and moderate-to-severe postoperative pain did not significantly differ by sex. These diagnostic results are summarized in Supplementary Table 4.
To further explore the potential confounding effect of age, an exploratory age-stratified analysis was performed using <60 years and ≥60 years categories. In both age strata, the incidence of moderate-to-severe postoperative pain remained higher in obese patients than in non-obese patients. Among patients aged <60 years, the event rate was 65.8% (25/38) in the obese group and 2.9% (1/34) in the non-obese group (Pearson χ2 = 30.722, P < 0.001). Among patients aged ≥60 years, the event rate was 62.5% (5/8) in the obese group and 6.3% (1/16) in the non-obese group (Fisher’s exact test, P = 0.007). Because the number of patients in the older obese subgroup was small and odds-ratio estimates showed wide confidence intervals, these findings were interpreted descriptively rather than as confirmatory subgroup evidence (Supplementary Table 5).
An exploratory BMI-stratified analysis was further performed among obese patients using clinically relevant BMI categories of 28.0–29.9, 30.0–34.9, and ≥35.0 kg/m2. The incidence of moderate-to-severe postoperative pain was 33.3% (4/12), 76.2% (16/21), and 76.9% (10/13) across the three BMI strata, respectively. The linear-by-linear association test suggested an increasing trend across BMI strata (χ2 = 4.938, P = 0.026). Because the number of patients in some BMI strata was limited, these findings were interpreted descriptively rather than as confirmatory subgroup evidence (Supplementary Table 6).
Post-hoc power analysis
For the primary continuous pain outcome, post-hoc power analysis based on the observed 24 h mean NRS scores showed an estimated power of >0.99 using a two-sided independent-samples t-test with α = 0.05. However, because the logistic regression model included five covariates and 32 moderate-to-severe postoperative pain events, corresponding to approximately 6.4 events per predictor variable, the regression results were interpreted cautiously in view of the limited number of events per predictor variable.
PONV findings
Although postoperative opioid consumption was higher in the obese group, the incidence of PONV was numerically lower in the obese group than in the non-obese group (19.57% vs. 28.00%), without statistical significance. This finding should be interpreted cautiously because the study was not powered to detect differences in PONV, and PONV may be influenced by multiple factors, including sex, anesthetic exposure, antiemetic prophylaxis or treatment, opioid dose, documentation practice, and individual susceptibility.
DATA AVAILABILITY:
The de-identified raw data supporting the findings of this study have been provided in Supplementary File 2.
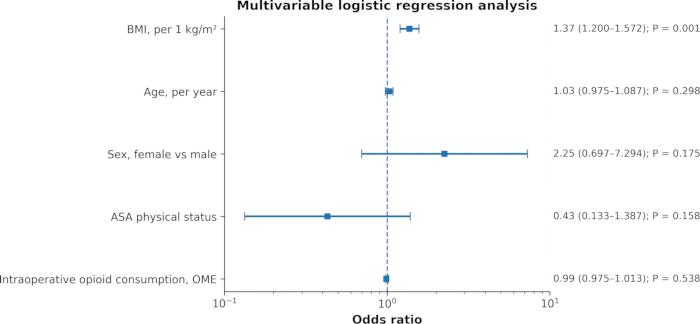
Figure 1: Forest plot of the multivariable logistic regression model for moderate-to-severe postoperative pain. The dependent variable was moderate-to-severe postoperative pain, defined as a 24 h mean NRS score ≥4. BMI was entered as a continuous variable. OR, odds ratio; CI, confidence interval; BMI, body mass index; ASA, American Society of Anesthesiologists; OME, oral morphine equivalents; NRS, numeric rating scale. Please click here to view a larger version of this figure.
| Variables | Non-obese group (n=50) | Obese group (n=46) | Test statistic (U/χ²) | P value |
| Age (years) | 54.14 ± 13.62 | 50.17 ± 10.26 | 1.601 | 0.113 |
| Male | 17 (34.00) | 17 (36.96) | 0.092 | 0.762 |
| Female | 33 (66.00) | 29 (63.04) | ||
| BMI(kg/m²) | 22.83 ± 2.61 | 32.66 ± 3.87 | -14.674 | <0.001 |
| Length of hospital stay (d) | 5.40 ± 1.96 | 5.67 ± 1.90 | 1058.5 | 0.493 |
| ASA classification | ||||
| Grade I | 15(30.00) | 17(36.96) | 0.003 | 0.959 |
| Grade II | 35(70.00) | 29(63.04) | ||
Table 1: Baseline characteristics of patients according to BMI category. BMI, body mass index; ASA, American Society of Anesthesiologists. Data are presented as mean ± SD or n (%), as appropriate.
| Variables | Non-obese group (n = 50) | Obese group (n = 46) | Test statistic (U/χ²) | P value |
| Duration of surgery (h) | 1.36 ± 0.62 | 1.39 ± 0.45 | 1040.5 | 0.42 |
| Duration of anesthesia (h) | 1.71 ± 0.65 | 1.78 ± 0.44 | 933 | 0.11 |
| Postoperative NSAID use | 9 (18.00) | 11 (23.91) | 0.508 | 0.476 |
| Intraoperative opioid consumption (OME, mg) | 103.00 ± 35.17 | 108.85 ± 26.99 | 955 | 0.152 |
| Postoperative opioid consumption (OME, mg) | 7.64 ± 7.85 | 12.70 ± 4.03 | 379.5 | <0.001 |
| Postoperative nausea and vomiting | 14 (28.00) | 9 (19.57) | 0.936 | 0.333 |
| Time to first ambulation (h) | 20.26 ± 3.79 | 21.98 ± 6.03 | 992 | 0.244 |
Table 2: Perioperative variables and analgesic exposure. OME, oral morphine equivalents; NSAID, non-steroidal anti-inflammatory drug; PONV, postoperative nausea and vomiting. Data are presented as mean ± SD or n (%), as appropriate.
| Variables | Non-obese group (n = 50) | Obese group (n = 46) | U value | P value |
| NRS score at 6 h postoperatively | 3.20 ± 1.44 | 4.39 ± 1.45 | 658.5 | <0.001 |
| NRS score at 12 h postoperatively | 2.56 ± 0.79 | 3.98 ± 1.44 | 473 | <0.001 |
| NRS score at 24 h postoperatively | 2.38 ± 0.53 | 3.24 ± 1.08 | 550 | <0.001 |
| 24 h mean NRS score | 2.72 ± 0.61 | 3.87 ± 1.17 | 449 | <0.001 |
| First PACU NRS score | 2.38 ± 1.07 | 3.04 ± 1.30 | 800.5 | 0.005 |
Table 3: Postoperative NRS scores within 24 h after surgery. NRS, numeric rating scale; PACU, post-anesthesia care unit. Data are presented as mean ± SD.
| Variable | β | SE | Wald χ² | P value | OR | 95% CI |
| BMI, per 1 kg/m² | 0.317 | 0.07 | 21.204 | <0.001 | 1.37 | 1.200–1.572 |
| Age, per year | 0.029 | 0.03 | 1.081 | 0.298 | 1.03 | 0.975–1.087 |
| Sex, female vs male | 0.813 | 0.6 | 1.84 | 0.175 | 2.25 | 0.697–7.294 |
| ASA physical status | -0.85 | 0.6 | 1.997 | 0.158 | 0.43 | 0.133–1.387 |
| Intraoperative opioid consumption, OME | -0.01 | 0.01 | 0.379 | 0.538 | 0.99 | 0.975–1.013 |
Table 4: Multivariable logistic regression analysis for moderate-to-severe postoperative pain. The dependent variable was moderate-to-severe postoperative pain, defined as a 24 h mean NRS score ≥4. BMI was entered as a continuous variable. OR, odds ratio; CI, confidence interval; SE, standard error; ASA, American Society of Anesthesiologists; OME, oral morphine equivalents.
Supplementary Figure 1: Flow diagram of patient screening and selection. The diagram summarizes the number of patients initially screened, excluded according to the predefined eligibility criteria or because of incomplete key data, and finally included in the analytic cohort. BMI, body mass index; ASA, American Society of Anesthesiologists.Please click here to download this file.
Supplementary Table 1: Consistency of perioperative anesthesia and analgesia-related measures between groups. NRS, numeric rating scale; PACU, post-anesthesia care unit; NSAID, non-steroidal anti-inflammatory drug; SpO₂, pulse oxygen saturation.Please click here to download this file.
Supplementary Table 2: Opioid conversion factors used to calculate oral morphine equivalents. OME, oral morphine equivalents; IV, intravenous. OME was calculated as follows: OME (mg) = administered dose × conversion factor. Morphine, oxycodone, and tramadol doses were expressed in milligrams, whereas fentanyl and sufentanil doses were expressed in micrograms. Please click here to download this file.
Supplementary Table 3: Incidence of moderate-to-severe postoperative pain by BMI group. Moderate-to-severe postoperative pain was defined as a 24 h mean NRS score ≥4. The absolute risk increase was 61.2 percentage points, corresponding to an NNH of approximately 2. BMI, body mass index; NRS, numeric rating scale; NNH, number needed to harm.Please click here to download this file.
Supplementary Table 4: Model performance, calibration, multicollinearity, and sex × BMI interaction analysis. AUC, area under the receiver operating characteristic curve; VIF, variance inflation factor; BMI, body mass index; CI, confidence interval; OR, odds ratio.Please click here to download this file.
Supplementary Table 5: Age-stratified incidence of moderate-to-severe postoperative pain by BMI group. Moderate-to-severe postoperative pain was defined as a 24 h mean NRS score ≥4. BMI, body mass index; NRS, numeric rating scale.Please click here to download this file.
Supplementary Table 6: BMI-stratified incidence of moderate-to-severe postoperative pain among obese patients. Obesity was defined as BMI ≥28.0 kg/m2 according to the Chinese adult body weight classification standard. Moderate-to-severe postoperative pain was defined as a 24 h mean NRS score ≥4. BMI, body mass index; NRS, numeric rating scale.Please click here to download this file.
Supplementary File 1: STROBE checklist.Please click here to download this file.
Supplementary File 2: The de-identified raw data supporting the findings of this study.Please click here to download this file.
Discussion
Loading...
$$\rightleftharpoonup{xx}$$
$$\longleftharp{xx}$$,
$$\longrightharp{xx}$$,
This retrospective observational study found that BMI was independently associated with acute postoperative pain severity after laparoscopic cholecystectomy. Compared with non-obese patients, obese patients had higher resting NRS scores at 6 h, 12 h, and 24 h after surgery, a higher 24 h mean NRS score, and greater postoperative opioid consumption expressed as OME.
In the adjusted logistic regression model, each 1 kg/m2 increase in BMI was associated with higher odds of moderate-to-severe postoperative pain (OR = 1.374, 95% CI: 1.200-1.572), defined as a 24 h mean NRS score ≥4.
From a methodological perspective, this study was strengthened by using a structured retrospective design, standardized pain assessment time points, OME-based opioid comparison, and multivariable adjustment for selected perioperative covariates. The reporting framework was aligned with the STROBE guideline for observational studies10. The use of serial NRS scores is consistent with routine clinical pain assessment practice, and NRS has been widely used because of its feasibility, patient comprehension, and responsiveness in pain-intensity measurement11,12. In addition, converting opioid exposure to OME allowed comparison across different opioid agents and routes, which is preferable to reporting unstandardized opioid doses13. These methodological elements improve reproducibility compared with approaches that report only a single pain time point, do not distinguish resting pain from movement-related pain, or compare opioid exposure without morphine-equivalent standardization.
The observed difference in the 24 h mean NRS score between groups was 1.15 points. This difference was statistically significant and may be clinically relevant when interpreted in relation to published thresholds for meaningful changes in acute pain scores14,15. Although MCID estimates vary according to pain scale, baseline pain intensity, surgical procedure, and analytic method, a difference of approximately 1 point on a 0–10 pain scale is generally considered potentially meaningful in acute pain assessment14,15. Together with the NNH estimate reported in the Results, these findings suggest that the association between obesity and postoperative pain may have practical relevance for perioperative analgesic planning rather than being only a statistically significant observation.
Several mechanisms may explain the association between higher BMI and greater postoperative pain after laparoscopic cholecystectomy. Obesity is associated with chronic low-grade inflammation, adipose tissue immune activation, and altered concentrations of inflammatory mediators, which may contribute to peripheral and central pain sensitization3,4. In laparoscopic cholecystectomy, increased abdominal wall thickness may also increase trocar-related tissue trauma and fascial strain, whereas visceral traction and pneumoperitoneum-related diaphragmatic irritation may contribute to early postoperative visceral or referred pain1,5. Altered opioid pharmacokinetics and increased vulnerability to opioid-related respiratory events in obese patients may further complicate analgesic titration and require more cautious postoperative opioid use8,9. Therefore, the higher pain scores and higher postoperative OME observed in obese patients are biologically plausible, although mechanistic confirmation requires prospective studies with inflammatory, pharmacokinetic, and patient-reported outcome measures.
The protocol-related findings also have practical implications. The most critical steps for successful implementation are accurate timing of NRS assessment, confirmation that pain scores represent resting pain, consistent NRS-triggered rescue analgesia criteria, complete extraction of opioid administration records, verification of OME conversion, and transparent handling of incomplete data. Because BMI, NRS scores, anesthesia records, medication orders, and nursing administration records are routinely available in perioperative care, this approach can be implemented without additional invasive testing or specialized equipment. For clinical practice, BMI-informed assessment may support more proactive pain evaluation, earlier multimodal analgesic planning, and closer respiratory monitoring when opioids are administered. However, BMI should not be used as the sole determinant of analgesic dosing; instead, it should be integrated with sex, age, comorbidities, surgical factors, respiratory risk, and patient-reported pain.
Several methodological modifications and troubleshooting considerations are important when applying this protocol. First, if the exact scheduled NRS time point is unavailable in a retrospective record, the pain score recorded closest to the scheduled time point should be used and documented. Second, if opioid agents differ among patients, all doses should be standardized using a prespecified OME conversion table, and the source of conversion factors should be reported13. Third, incomplete or ambiguous records should not be imputed without justification; instead, the number and reasons for exclusion should be reported in a flow diagram, consistent with transparent observational-study reporting10. Fourth, if multiple nurses perform pain assessments, standardized NRS training should be documented, and inter-rater reliability should be evaluated when duplicate assessments are available12. Finally, postoperative opioid administration in obese patients should be accompanied by monitoring of respiratory rate, oxygen saturation, level of consciousness, and clinical signs of respiratory depression9.
The regression model should also be interpreted with caution. There were 32 moderate-to-severe pain events and five variables in the multivariable logistic regression model, corresponding to approximately 6.4 events per predictor variable. This value is below the traditional rule of 10 events per variable, which may increase the risk of model overfitting16. However, later simulation work has suggested that the 10-events-per-variable rule should be interpreted as a pragmatic guide rather than an absolute threshold17. Therefore, the additional regression diagnostics requested in the revision, including multicollinearity assessment, C-statistic or area under the curve, Hosmer-Lemeshow calibration testing, and the sex × BMI interaction term, are important for evaluating model stability and interpretability18. Even with these additional analyses, the model should be viewed as exploratory and hypothesis-generating rather than externally validated.
The PONV findings require cautious interpretation. Although postoperative opioid consumption was higher in the obese group, the incidence of PONV was numerically lower in the obese group than in the non-obese group. This apparent discrepancy may reflect the limited sample size, differences in individual susceptibility, antiemetic prophylaxis or treatment, sex distribution, anesthetic exposure, documentation practices, or other PONV-specific risk factors19,20. Because the present study was not powered to detect differences in PONV and did not fully model PONV-specific predictors, this result should be regarded as exploratory. Future studies should evaluate PONV using standardized risk assessment, predefined antiemetic protocols, and more complete perioperative medication data.
This study has several limitations. First, this was a single-center retrospective observational study; therefore, selection bias, information bias, and residual confounding cannot be excluded. Causal conclusions should not be drawn from these data. Second, the sample size was limited. Although the post-hoc power analysis for the primary continuous pain outcome suggested sufficient statistical power for detecting the observed between-group difference in the 24 h mean NRS score, the multivariable logistic regression model included 32 moderate-to-severe postoperative pain events and five covariates, corresponding to approximately 6.4 events per predictor variable. Therefore, model overfitting remains possible, and the regression findings require validation in larger multicenter cohorts16,17,18. Third, although the model adjusted for age, sex, ASA physical status, and intraoperative opioid consumption, several potentially important confounders were not available, including preoperative anxiety, depression, sleep quality, chronic inflammatory conditions, baseline pain sensitivity, preoperative pain, pain catastrophizing, surgical difficulty, and detailed antiemetic prophylaxis21,22,23,24,25. Fourth, because pain scores were obtained from routine clinical records, assessor blinding and inter-rater reliability could not be fully controlled. Fifth, the study focused on acute pain within 24 h after surgery and did not evaluate movement-evoked pain, longer-term pain outcomes, functional recovery beyond early ambulation, or patient satisfaction.
In conclusion, higher BMI was independently associated with greater acute postoperative pain severity and higher opioid requirements after laparoscopic cholecystectomy. These findings support the use of BMI as one component of postoperative pain risk assessment and individualized analgesic planning. Future multicenter prospective studies with larger sample sizes, standardized analgesic and antiemetic protocols, formal model validation, inflammatory biomarkers, and longer follow-up are needed to confirm these findings and clarify the mechanisms linking obesity with postoperative pain.
Disclosures
Loading...
$$\rightleftharpoonup{xx}$$
$$\longleftharp{xx}$$,
$$\longrightharp{xx}$$,
The authors declare no potential conflicts of interest.
Acknowledgements
Loading...
$$\rightleftharpoonup{xx}$$
$$\longleftharp{xx}$$,
$$\longrightharp{xx}$$,
This project was supported by Jiangsu Provincial Key Laboratory of Experimental Diagnostics (ZDXKB2016005).
Materials
| Name | Company | Catalog Number | Comments |
|---|---|---|---|
| Anesthesia information system | Anji County Hospital of Traditional Chinese Medicine | Institutional anesthesia information system | Used to extract anesthesia duration, operative duration, intraoperative opioid administration, intraoperative monitoring records, and anesthesia-related timestamps. |
| Anesthesia workstation | Dräger | Fabius plus XL | Representative anesthesia workstation used for delivery and maintenance of general anesthesia with tracheal intubation. |
| Bispectral index monitor | Medtronic | BIS Vista Monitor 186-1046; BIS Quatro sensor 186-0106 | Used when available for depth-of-anesthesia monitoring and adjustment of anesthetic depth according to institutional practice. |
| Cisatracurium besylate injection | Jiangsu Hengrui Pharmaceuticals Co., Ltd. | China NMPA approval No. H20060869 | Nondepolarizing neuromuscular blocking agent used to facilitate tracheal intubation when selected by the attending anesthesiologist. |
| Electronic medical record (EMR) system | Anji County Hospital of Traditional Chinese Medicine | Institutional EMR/HIS system | Used to extract demographic data, height, body weight, BMI, ASA physical status, admission/discharge records, length of hospital stay, medication orders, and other clinical variables. |
| Endotracheal tube | Medtronic / Shiley | Shiley cuffed oral/nasal tracheal tube, adult sizes | Representative airway device used for tracheal intubation during general anesthesia. |
| Fentanyl citrate injection | Jiangsu Nhwa Pharmaceutical Co., Ltd. | China NMPA approval No. H20113508; 2 mL:0.1 mg | Opioid analgesic used for perioperative analgesia and included in OME conversion when administered. |
| Flurbiprofen axetil injection | Beijing Tide Pharmaceutical Co., Ltd. | China NMPA approval No. H20041508; 5 mL:50 mg | Non-steroidal anti-inflammatory drug used as adjunctive postoperative analgesia when clinically indicated and not contraindicated. |
| Laryngoscope or video laryngoscope | Verathon | GlideScope video laryngoscope system | Representative device used to facilitate tracheal intubation after induction of general anesthesia. |
| Microsoft Excel | Microsoft Corp. | Microsoft Excel 2021 / Microsoft 365 | Used for data organization, supplementary table preparation, and calculation verification before statistical analysis. |
| Multiparameter patient monitor | Mindray | BeneVision N15 | Representative monitor used for ECG, noninvasive blood pressure, pulse oxygen saturation, end-tidal CO2, and body temperature monitoring. |
| Numerical Rating Scale (NRS) | Clinical assessment standard tool | 11-point NRS, 0-10 | Pain intensity scale used for resting postoperative pain assessment in PACU and at 6 h, 12 h, and 24 h after surgery. |
| Nursing documentation system | Anji County Hospital of Traditional Chinese Medicine | Institutional nursing documentation system | Used to extract postoperative NRS scores, PACU and ward nursing records, PONV documentation, time to first ambulation, and medication administration records. |
| Ondansetron hydrochloride injection | Qilu Pharmaceutical Co., Ltd. | Ondansetron hydrochloride injection; 2 mL:4 mg or 4 mL:8 mg | Antiemetic medication used for prevention or treatment of postoperative nausea and vomiting when clinically indicated. |
| Patient-controlled analgesia/infusion pump | ICU Medical / Smiths Medical | CADD-Solis VIP 2120 | Representative infusion system used when patient-controlled or programmed opioid analgesia was clinically indicated. |
| Propofol injection | Fresenius Kabi | Propofol 1% MCT/LCT; China NMPA approval No. HJ20150657 | Intravenous anesthetic used for induction and/or maintenance of general anesthesia. |
| Remifentanil hydrochloride for injection | Yichang Humanwell Pharmaceutical Co., Ltd. | China NMPA approval No. H20030199; 2 mg/vial | Short-acting opioid used for intraoperative analgesia or anesthesia maintenance according to institutional practice. |
| Rocuronium bromide injection | Guangdong Jiabo Pharmaceutical Co., Ltd. | China NMPA approval No. H20183109; 5 mL:50 mg | Nondepolarizing neuromuscular blocking agent used to facilitate tracheal intubation when selected by the attending anesthesiologist. |
| SPSS Statistics | IBM Corp. | Version 26.0 | Software used for statistical analyses, including normality testing, homogeneity of variance testing, group comparisons, multivariable logistic regression, and model diagnostics. |
| Sufentanil citrate injection | Yichang Humanwell Pharmaceutical Co., Ltd. | China NMPA-approved sufentanil citrate injection; 1 mL:50 μg | Opioid analgesic used for perioperative analgesia and included in OME conversion when administered. |
Reprints and Permissions
Request permission to reuse the text or figures of this JoVE article
Request Permission