This study examines how vitamin C modulates the kinetic behavior of a Fenton reaction under in vitro conditions. Chemical-dye probe and bacterial assays show that controlled vitamin C dosing alters the reaction's oxidative behavior and is associated with increased antibacterial activity against Helicobacter pylori in a simplified model system.
Method Article
Vitamin C-Assisted Fenton Oxidation Improves Oxidative Killing of Helicobacter pylori In Vitro
Opens in a new tab
In This Article
Summary
Loading...
$$\rightleftharpoonup{xx}$$
$$\longleftharp{xx}$$,
$$\longrightharp{xx}$$,
Abstract
Loading...
$$\rightleftharpoonup{xx}$$
$$\longleftharp{xx}$$,
$$\longrightharp{xx}$$,
Helicobacter pylori infection remains a major global health burden, and the increasing prevalence of antibiotic resistance underscores the need for alternative antibacterial strategies. This study examined whether vitamin C dosing could modulate Fenton oxidation and enhance oxidative antibacterial activity against H. pylori under defined acidic in vitro conditions. Oxidative activity was assessed using Acid Orange 7 decolorization as an indirect chemical readout and a terephthalic acid fluorescence assay as a relative indicator of hydroxyl radical-associated product formation in iron–peroxide reactions supplemented with vitamin C. Antibacterial efficacy was evaluated by exposing standardized H. pylori suspensions in urea-containing saline at pH 3 to hydrogen peroxide and ferrous iron with or without stepwise vitamin C supplementation, followed by colony-forming unit enumeration. Vitamin C supplementation altered oxidative readouts and was associated with greater reductions in viable bacteria compared with conventional Fenton chemistry. Rescue experiments using deferoxamine and thiourea attenuated antibacterial activity, supporting the hypothesis that antibacterial activity is associated with iron-mediated and radical-related oxidative processes. Live/dead fluorescence staining and scanning electron microscopy provided qualitative visual observations consistent with the colony-forming unit (CFU) enumeration results. Collectively, these findings indicate that controlled vitamin C dosing can modulate Fenton-based oxidative reactions and enhance antibacterial activity against H. pylori in a simplified, acidic in vitro model.
Introduction
Loading...
$$\rightleftharpoonup{xx}$$
$$\longleftharp{xx}$$,
$$\longrightharp{xx}$$,
H. pylori, a Gram-negative bacterium with a spiral shape that belongs to the genus Helicobacter, has been shown through population health studies to have a high prevalence of infection across geographical areas, sex, and age, with a global prevalence rate of approximately 50%1. The International Agency for Research on Cancer (IARC) has classified H. pylori as a Group 1 carcinogen, underscoring its strong connection with gastric cancer and mucosa-associated lymphoid tissue (MALT) lymphoma. At present, the clinical management of H. pylori infection primarily relies on pharmacological regimens. The most extensively studied agents include proton pump inhibitors (PPIs), which suppress gastric acid secretion; bismuth compounds, which enhance antibiotic efficacy; and antibiotics such as amoxicillin, clarithromycin, and metronidazole. However, monotherapy has been shown to be insufficient for complete eradication, leading to the widespread use of combination regimens, commonly referred to as triple therapy. This approach typically consists of a PPI, clarithromycin, and either amoxicillin or metronidazole, administered for approximately two weeks3. With the increasing prevalence of antibiotic-resistant H. pylori strains, the efficacy of triple therapy has declined markedly, prompting the adoption of quadruple therapy combining a PPI, bismuth, and two antibiotics3. Nevertheless, these regimens still fundamentally depend on antibiotics, and antibiotic resistance remains a major challenge in clinical management4,5. Consequently, the exploration of alternative, antibiotic-independent antibacterial strategies has attracted growing interest.
Beyond its direct pathological effects, H. pylori infection has also been associated with alterations in gastric micronutrient homeostasis. Clinical and epidemiological studies have reported reduced concentrations of vitamin C in the gastric juice and serum of infected individuals6, which may be related to mucosal inflammation, impaired secretion, or increased oxidative consumption7,8,9. In parallel, H. pylori infection has been linked to iron deficiency through multiple mechanisms, including reduced gastric acidity, impaired dietary iron absorption, and bacterial competition for available iron10. These observations highlight the complex biochemical environment accompanying H. pylori infection and underscore the relevance of redox- and iron-related processes in acidic gastric conditions.
Reactive oxygen species (ROS) have gained considerable interest in antimicrobial research because of the oxidative properties of these species. ROS refer to a class of chemically reactive molecules formed during the partial reduction of oxygen, such as superoxide anion (O₂•⁻), hydrogen peroxide (H₂O₂), singlet oxygen (1O₂), and hydroxyl radicals (•OH), among others. In biological systems, ROS are extensively involved in normal physiological metabolism and are essential for diverse cellular regulatory activities11. Notably, numerous studies have demonstrated that excessive ROS can disrupt bacterial cell membranes through lipid peroxidation, leading to alterations in membrane structure and function, ultimately resulting in bacterial inactivation12. Accordingly, ROS-based antimicrobial approaches have attracted interest as a potential avenue for investigating non-antibiotic antibacterial effects against H. pylori13,14,15,16. Among various ROS-generation methods, the Fenton reaction has garnered significant attention for its highly efficient radical production. The Fenton reaction is an advanced oxidation process17 in which ferrous ions (Fe2⁺) react with H₂O₂ under acidic conditions to produce hydroxyl radicals (•OH), which possess strong oxidative potential and can oxidize intracellular biomolecules.
Fe2⁺ +H→Fe3⁺+•OH+OH-
Fe3⁺+ H→Fe2⁺+•OOH+ H⁺
H₂O→OH+•OOH+H2O
Specifically, at a pH of approximately 2.8–4.5, H₂O₂ undergoes catalytic decomposition by Fe2⁺, generating •OH while Fe2⁺ is oxidized to Fe3⁺. Fe3⁺ then reacts with H₂O₂ to regenerate Fe2⁺, establishing a Fe2⁺/Fe3⁺ redox cycle that sustains continuous ROS production18. However, the reduction of Fe3⁺ to Fe2⁺ is relatively slow, constituting the rate-limiting step and consequently lowering the overall efficiency of the Fenton reaction. Studies indicate that introducing a suitable reducing agent into the Fenton reaction system can accelerate Fe2⁺ reduction to Fe2⁺, thereby enhancing ROS generation. Vitamin C has a context-dependent redox role. In iron-containing systems, it can promote Fe2⁺ reduction to Fe2⁺ and thereby support Fenton cycling, whereas at higher concentrations or under different reaction conditions, it may also function as an antioxidant or radical scavenger19.
Based on this background, the present study investigates a vitamin C–assisted Fenton reaction system as a chemically tunable approach for modulating oxidative activity under defined acidic in vitro conditions20,21. Vitamin C was used as a reducing agent to facilitate Fe2⁺ regeneration and thereby alter the effective oxidative behavior of the Fenton reaction. The experimental system used here was a simplified acidic saline-urea model and was not intended to fully reproduce the physiological gastric microenvironment, which contains mucus, buffering components, host cells, immune factors, and diverse organic substrates. Within this controlled model, oxidative activity was characterized using chemical readouts and evaluated in parallel with bacterial phenotypic responses, providing an experimental basis for probing ROS-associated antibacterial effects against H. pylori in vitro.
Protocol
Loading...
$$\rightleftharpoonup{xx}$$
$$\longleftharp{xx}$$,
$$\longrightharp{xx}$$,
Ethics statement
This study was an in vitro bacterial study and did not involve human participants, animal subjects, or patient-derived materials. Therefore, institutional review board approval and animal ethics approval were not required.
Evaluation of AO7 degradation in the vitamin C–assisted Fenton system
To assess the effect of vitamin C on the observable oxidative behavior of the Fenton reaction, Acid Orange 7 (AO7) degradation was used as an indirect chemical readout of oxidative activity. This assay does not specifically quantify individual reactive oxygen species. Prepared 100 mL of AO7 solution at 5 mg/L and adjusted the solution to pH 3. Added H₂O₂ and FeSO₄ to final concentrations of 2.2 mM and 0.055 mM, respectively. Added vitamin C either as a single bolus at reaction initiation or in a three-step dosing scheme. For the dose-response experiment, Vc: Fe2⁺ molar ratios of 0, 0.12, 0.24, 0.48, 2, 4, 6, and 8 were used, corresponding to final vitamin C concentrations of 0, 0.0066, 0.0132, 0.0264, 0.110, 0.220, 0.330, and 0.440 mM, respectively, when FeSO₄ is used at 0.055 mM. For the three-step addition condition, divided the same total vitamin C amount into three equal aliquots and added one aliquot at 3, 5, and 7 min after reaction initiation. For example, at a Vc:Fe2⁺ ratio of 0.48, added vitamin C at 0.0088 mM per aliquot, giving a final total concentration of 0.0264 mM.
Stirred the reaction solution continuously in the dark for 10 min while maintaining the temperature below 30 °C. Collected 2 mL samples before and after the reaction. Measured absorbance at 483 nm using a UV-Vis spectrophotometer, and calculated the AO7 degradation rate using Equation 1:
Degradation rate (%) = [(A₀ − A₁) / A₀] × 100% (1)
Here, A₀ represents the absorbance of the sample before the reaction, while A₁ represents the absorbance of the sample after the reaction.
Assessment of •OH-associated fluorescence signal using a TA probe
To assess hydroxyl radical-associated fluorescence signals under the same acidic in vitro conditions used in the antibacterial experiments, a cell-free chemical system was established using disodium terephthalate (TA, 1 mM) as a fluorescence probe. This assay was used as a relative indicator of •OH-associated product formation and was not interpreted as an absolute quantification of hydroxyl radical generation. Seven groups were included: (1) blank (1 mM TA in reaction buffer only), (2) H₂O₂ alone, (3) Fe2⁺ alone, (4) Vc alone (stepwise addition), (5) conventional Fenton (Fe2⁺ + H₂O₂), (6) vitamin C–assisted Fenton with bolus Vc addition (Fe2⁺ + H₂O₂ + Vc, bolus), and (7) Vc–assisted Fenton with stepwise Vc addition (Fe2⁺ + H₂O₂ + Vc, stepwise). In the stepwise-addition condition, Vc was introduced at 3, 5, and 7 min after reaction initiation in equal aliquots, whereas the bolus condition received the same total amount of Vc as a single addition.
Aliquots were collected over a 10-min reaction period, immediately alkalinized with NaOH to quench further radical reactions and stabilize fluorescence, and stored at 4 °C prior to measurement. Fluorescence intensity of the TA-derived product was measured using a microplate reader (Ex/Em: 315/425 nm). Radical generation was expressed as fluorescence intensity after blank subtraction and used as a relative indicator of radical generation. At least three independent experiments were performed, and data were presented as time-course profiles and endpoint comparisons at 10 min.
Evaluation of antibacterial performance by colony counting
H. pylori strains were stored at −80 °C in brain heart infusion (BHI) broth containing 25% glycerol. The primary strain used for the main colony-counting assay, rescue assay, matrix-interference assay, live/dead fluorescence staining, and scanning electron microscopy analysis was H. pylori G27. Before each experiment, bacteria were streaked onto Columbia blood agar plates and incubated for 3 days at 37 °C under microaerophilic conditions consisting of 5% O₂, 10% CO₂, and 85% N₂22.
Colony counting assay in the primary strain
Used colony-forming unit (CFU) enumeration to evaluate antibacterial activity under different treatment conditions. Included the following groups: untreated control, H₂O₂ alone, vitamin C alone, conventional Fenton reaction, and vitamin C–assisted Fenton reaction. If an Fe2⁺-alone group was not included in the original experiment, avoid interpreting the primary assay as fully separating iron-only effects from Fenton reaction-mediated oxidative effects. Harvested cultured H. pylori and resuspend the bacteria in physiological saline. Adjusted the optical density at 600 nm (OD₆₀₀) to 0.5, and transferred the suspension into physiological saline containing 3 mM urea adjusted to pH 3. Added H₂O₂, FeSO₄, and vitamin C according to the assigned treatment group. Used final concentrations of 2.2 mM H₂O₂ and 0.055 mM FeSO₄. For vitamin C–assisted Fenton treatment, added vitamin C in three equal aliquots at 3, 5, and 7 min, with a final total concentration of 0.0264 mM.
After 10 min of treatment, each sample was immediately diluted 100-fold in phosphate-buffered saline (PBS, pH 7.4) to neutralize the acidic suspension and reduce carryover of residual oxidants and iron into the plating step. Plated the diluted bacterial suspension onto Columbia blood agar plates and incubated at 37 °C for 3 days under microaerophilic conditions of 5% O₂, 10% CO₂, and 85% N₂. Counted CFUs and calculated antibacterial activity as log₁₀ CFU reduction relative to the untreated control using Equation 2:
log10 CFU reduction = log10(CFUcontrol) − log10(CFUtreated) (2)
Rescue assay
To examine whether the antibacterial activity of the vitamin C–assisted Fenton system was associated with iron availability and radical-related processes, rescue experiments were performed using deferoxamine (DFO) as an iron chelator and thiourea as a hydroxyl radical scavenger. DFO or thiourea was added to the bacterial suspension 5 min before the addition of FeSO₄ and H₂O₂. DFO and thiourea were used at final concentrations of 100 µM and 5 mM, respectively.
Six experimental groups were included: untreated control, vitamin C–assisted Fenton, vitamin C–assisted Fenton with DFO, vitamin C–assisted Fenton with thiourea, DFO alone, and thiourea alone. All other experimental parameters, including pH, saline/urea background, H₂O₂ concentration, FeSO₄ concentration, vitamin C dosing schedule, treatment duration, dilution/neutralization before plating, and incubation conditions, were identical to those used in the primary colony-counting assay. Antibacterial activity was quantified by CFU enumeration and expressed as log₁₀ CFU reduction relative to the untreated control.
Multistrain validation
To provide limited cross-strain support for the antibacterial effect observed in the primary strain, the colony-counting assay was further applied to two additional H. pylori reference strains, ATCC 43504 and ATCC 26695. For each strain, three experimental groups were included: untreated control, conventional Fenton reaction, and vitamin C–assisted Fenton reaction with stepwise vitamin C addition. Experimental conditions and procedures were identical to those used in the primary colony-counting assay. Antibacterial activity was expressed as log₁₀ CFU reduction relative to the untreated control for each strain. Each experiment was performed with n = 3 independent biological replicates, and data were presented as individual data points with mean ± standard deviation.
Matrix interference assay
To evaluate whether organic matrix components could attenuate the antibacterial activity of the vitamin C–assisted Fenton system, a protein interference model was established using bovine serum albumin (BSA). BSA was included at final concentrations of 0, 1, and 3 g·L⁻1. At each BSA concentration, three experimental groups were included: (1) untreated control, (2) conventional Fenton (Fe2⁺ + H₂O₂), and (3) vitamin C–assisted Fenton with stepwise vitamin C addition. The assay was conducted using the primary strain under the same protocol described in the primary colony counting assay, with identical pH conditions, saline/urea background, reagent concentrations, treatment duration (10 min), and plating procedures. Antibacterial activity was expressed as log₁₀ CFU reduction relative to the untreated control at each BSA concentration. Each experiment was performed at least three times independently. The primary comparison focused on whether the enhanced Fenton condition remained superior to, or at least not weaker than, the conventional Fenton condition under protein-containing conditions.
Bacterial live/dead fluorescence staining
After treatment, the bacterial suspension was diluted 100-fold in PBS as described above to reduce residual acidic and oxidative carryover. Centrifuged the suspension at 1,800 × g for 10 min at room temperature and discarded the supernatant. Resuspended the bacterial pellet in 200 µL of physiological saline. Added SYTO9 and propidium iodide (PI) to final concentrations of 6 µM and 30 µM, respectively. Incubated the suspension in the dark for 20 min at room temperature. Placed 5–10 µL of the stained bacterial suspension onto a clean glass slide and covered it with a coverslip. Acquired fluorescence images using a fluorescence microscope with green and red fluorescence channels under identical exposure settings for all treatment groups. Captured at least three randomly selected fields for each group. Used the images as qualitative visual evidence of live/dead staining patterns rather than as a quantitative measurement of bacterial viability.
Bacterial morphology analysis by scanning electron microscopy
After treatment, the bacterial samples were collected and fixed in 2.5% glutaraldehyde prepared in 0.1 M phosphate buffer (pH 7.4) at 4 °C for 12 h. After fixation, the samples were washed with phosphate buffer to remove residual fixative. The samples were then sequentially dehydrated in graded ethanol solutions of 50%, 70%, 90%, and 100%. After dehydration, critical point drying was performed. The dried samples were mounted onto SEM stubs and sputter-coated with a thin gold layer of approximately 10 nm. Bacterial morphology was examined using scanning electron microscopy at an accelerating voltage of 5 kV. Representative images were acquired at low and high magnification for each treatment group. SEM images were used as qualitative morphological observations rather than as quantitative evidence of a defined damage mechanism.
Statistical analysis
Statistical analyses were performed using GraphPad Prism version 10.0. All quantitative experiments were performed with n = 3 independent biological replicates, and data are presented as mean ± standard deviation (SD). For TA fluorescence assays, statistical comparisons among multiple treatment groups were performed using one-way analysis of variance (ANOVA) followed by Tukey’s multiple-comparisons test. For colony-counting assays in the primary strain involving multiple treatment conditions, statistical comparisons were performed using one-way ANOVA followed by Tukey’s multiple-comparisons test. For rescue assays, between-group comparisons were performed using one-way ANOVA followed by Dunnett’s multiple-comparisons test, with the vitamin C–assisted Fenton group set as the reference. For limited cross-strain validation experiments, log₁₀ CFU reductions were compared between the conventional Fenton and vitamin C–assisted Fenton groups within each strain using an unpaired two-tailed t-test. For matrix-interference assays, two-way ANOVA was performed with treatment and BSA concentration as factors, including the interaction term. Pairwise comparisons between treatments at each BSA concentration were conducted using Šídák’s multiple-comparisons test. Statistical significance was defined as P < 0.05. Significance levels are indicated as *p < 0.05, ** P < 0.01, ***P < 0.001, and ****p < 0.0001.
Results
Loading...
$$\rightleftharpoonup{xx}$$
$$\longleftharp{xx}$$,
$$\longrightharp{xx}$$,
Evaluation of AO7 degradation in the vitamin C–assisted Fenton system
AO7 degradation was used as a chemical probe to examine how vitamin C influences the observable oxidative behavior of the Fenton reaction under acidic conditions. In the absence of vitamin C, the conventional Fenton system resulted in partial AO7 degradation over the 10 min reaction period. When vitamin C was introduced, the extent of dye degradation increased, with the effect depending on the molar ratio between vitamin C and Fe2⁺. At relatively low vitamin C : Fe2⁺ ratios, AO7 degradation increased compared with the vitamin C–free condition. A maximal degradation efficiency of approximately 73.5% was observed at a Vc: Fe2⁺ ratio of 0.24, whereas the degradation rate without vitamin C was approximately 51.7%. Further increases in vitamin C concentration did not lead to additional improvement and were instead associated with a gradual reduction in degradation efficiency.
A stepwise vitamin C dosing strategy was subsequently evaluated while maintaining the same total amount of vitamin C. Compared with single-dose supplementation, stepwise addition resulted in a higher AO7 degradation rate under otherwise identical conditions. When the vitamin C : Fe2⁺ molar ratio exceeded approximately 0.48, further increases in vitamin C produced only marginal changes in degradation efficiency. These observations indicate that both the amount and dosing mode of vitamin C influence AO7 degradation behavior in the Fenton system and are consistent with the notion that both the amount and dosing mode of vitamin C influence the observable oxidative behavior of the Fenton system under acidic conditions (Figure 1).
Assessment of •OH-associated fluorescence signal using a TA probe
To evaluate hydroxyl radical–associated fluorescence signals under acidic conditions, a cell-free TA fluorescence assay was performed with reaction parameters identical to those used in the antibacterial experiments. As shown in the time-course profiles, the conventional Fenton system induced a gradual increase in TA fluorescence over the 10-min reaction period, consistent with accumulation of the TA-derived fluorescent product. In contrast, the vitamin C–assisted Fenton system produced higher fluorescence signals throughout the reaction. Notably, under stepwise vitamin C supplementation, fluorescence intensity increased rapidly at early time points and then rose more gradually. A distinct secondary surge was observed at approximately 5–6 min, coinciding with the second vitamin C addition, which further elevated the fluorescence signal and enabled the stepwise condition to surpass the bolus (one-step) addition mode.
Endpoint analysis at 10 min further showed that vitamin C increased the TA fluorescence signal under Fenton conditions. Both vitamin C–assisted Fenton conditions exhibited significantly higher fluorescence intensities compared with the conventional Fenton reaction (P < 0.05), while stepwise vitamin C addition generated a significantly stronger signal than bolus addition (P < 0.001). After blank subtraction, H₂O₂ alone, Fe2⁺ alone, and vitamin C alone exhibited low residual fluorescence signals, whereas Fenton-based conditions resulted in substantially higher fluorescence intensities. These results indicate that vitamin C increases the relative TA fluorescence signal in an addition mode–dependent manner. Although all Fenton-based systems exhibited a time-dependent increase in TA fluorescence, stepwise vitamin C supplementation induced a more pronounced acceleration in fluorescence accumulation, leading to a higher overall TA fluorescence signal compared with both conventional Fenton and bolus vitamin C addition (Figure 2A–B).
Evaluation of antibacterial performance by colony counting
The antibacterial performance of the vitamin C–assisted Fenton system was first evaluated in the primary H. pylori strain G27 by colony-forming unit (CFU) enumeration and expressed as log₁₀ CFU reduction relative to the untreated control. One-way ANOVA revealed a significant overall treatment effect (P < 0.0001). Post hoc Tukey multiple-comparison analysis showed that the conventional Fenton reaction produced a greater log₁₀ CFU reduction than either H₂O₂ alone or vitamin C alone. No significant difference was observed between the H₂O₂-alone and vitamin C-alone groups. Incorporation of vitamin C into the Fenton system using a stepwise supplementation strategy further increased log₁₀ CFU reduction compared with the conventional Fenton reaction, yielding the strongest antibacterial effect among the tested conditions under the present experimental setup. The key pairwise comparisons supporting this conclusion are shown in Figure 3A–B. Because an Fe2⁺-alone grouP was not included in the primary colony-counting assay, the primary assay was not designed to isolate the effect of ferrous iron alone from the Fenton reaction-based treatment. Therefore, the antibacterial comparison is interpreted primarily as a comparison among the tested treatment conditions rather than as definitive evidence excluding all iron-only effects.
Rescue assay
To examine whether the antibacterial activity of the vitamin C–assisted Fenton system is associated with iron availability and radical-related processes, mechanistic rescue experiments were conducted using the iron chelator deferoxamine (DFO) and the •OH scavenger thiourea. Colony-counting analysis revealed that the vitamin C–assisted Fenton treatment induced a pronounced reduction in bacterial viability compared with the untreated control, as evidenced by a substantial log₁₀ CFU reduction, indicating a pronounced antibacterial effect under the experimental conditions. Pre-treatment with DFO was associated with a marked attenuation of the antibacterial effect of the vitamin C–assisted Fenton system, resulting in significantly increased CFU counts relative to the corresponding treatment without rescue agents and partially restoring bacterial survival toward control levels. Likewise, the presence of thiourea was associated with a reduction in the observed antibacterial activity, leading to a pronounced decrease in log₁₀ CFU reduction. In contrast, DFO or thiourea alone did not exert significant antibacterial effects, indicating that these agents did not exert intrinsic bactericidal activity under the tested conditions (Figure 4A).
Multistrain validation
To provide limited cross-strain support beyond the primary H. pylori G27 strain, colony-counting assays were further performed using two additional reference strains, ATCC 43504 and ATCC 26695. In both reference strains, vitamin C–assisted Fenton treatment was associated with greater log₁₀ CFU reduction than conventional Fenton treatment under the tested conditions. Although the absolute magnitude of bacterial reduction varied between strains, the direction of the effect was consistent across these two additional strains. These findings support a similar trend in a limited cross-strain validation setting, rather than establishing broad strain-independent generalizability (Figure 4B).
Matrix interference assay
To evaluate the impact of organic matrix interference on the antibacterial efficacy of the vitamin C–assisted Fenton system, bovine serum albumin (BSA) was introduced as a protein interference model, and antibacterial activities were compared across different BSA concentrations. The results showed that, in the presence of protein matrix, all treatment groups exhibited varying degrees of attenuation in bactericidal activity, suggesting that organic protein components may interfere with Fenton reaction–mediated antibacterial processes. Despite an overall trend toward reduced antibacterial efficacy at higher BSA concentrations, the vitamin C–assisted Fenton treatment consistently maintained a relative advantage over the conventional Fenton reaction across all BSA levels, with a similar pattern observed under different matrix conditions, indicating that the relative advantage of the vitamin C–assisted Fenton condition was maintained under this simplified protein-interference model, although overall activity decreased (Figure 4C).
Bacterial live/dead fluorescence staining
Live/dead fluorescence staining was performed to qualitatively visualize bacterial staining patterns after different treatments. In the untreated control group, most bacteria showed green fluorescence. H₂O₂ alone and vitamin C alone showed limited red fluorescence under the tested conditions. In contrast, the conventional Fenton and vitamin C–assisted Fenton groups showed visibly increased red fluorescence signals, with the vitamin C–assisted Fenton group displaying a greater apparent red-signal pattern than the conventional Fenton group. These observations are consistent with the CFU-counting results and provide qualitative visual support for treatment-associated changes in bacterial viability staining. Because this assay was not quantified, the images were not used to calculate bacterial viability or to define a specific antibacterial mechanism (Figure 5).
Bacterial morphology analysis by scanning electron microscopy
SEM was used to qualitatively examine bacterial morphology after different treatments. Untreated bacteria showed typical curved or spiral rod-shaped morphology with relatively smooth surfaces. Bacteria exposed to the conventional Fenton reaction showed visible surface irregularities and deformation. The vitamin C–assisted Fenton group showed more apparent morphological perturbations under the imaging conditions used. These SEM observations are consistent with the direction of the CFU-counting and live/dead staining results, but these observations should be interpreted as qualitative morphological observations rather than as quantitative evidence of a defined structural damage mechanism (Figure 6).
Overall observations
Taken together, the results from AO7 degradation analysis, colony counting, fluorescence viability staining, and electron microscopy suggest that the inclusion of vitamin C alters the behavior of the Fenton reaction under acidic in vitro conditions, potentially enhancing antibacterial effects compared with the conventional Fenton system alone. In vitro, across all assays employed in this study, treatments combining Fe2⁺, H₂O₂, and stepwise vitamin C supplementation consistently produced more pronounced effects than individual components or the Fenton reaction without vitamin C. These findings support the working hypothesis that vitamin C dosing can be used as a practical variable to modulate the behavior of a Fenton-based oxidative system and its associated antibacterial outcomes in a simplified experimental model.
DATA AVAILABILITY:
All raw data supporting the findings reported in this study have been provided in the supplementary files.
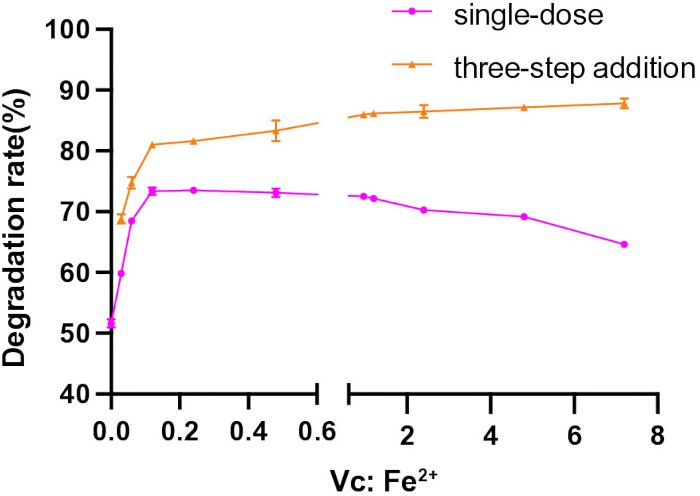
Figure 1: Dye degradation efficiency under various proportions of vitamin C (VC) and Fe2⁺ and different dosing strategies in the Fenton reaction. The degradation rate (%) is plotted against the VC: Fe2⁺ ratio. (n = 3, data are presented as mean ± SD). Please click here to view a larger version of this figure.
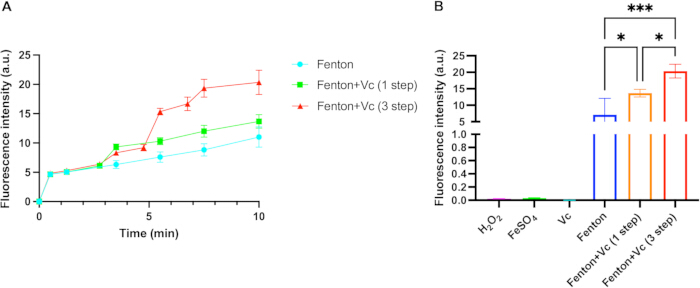
Figure 2: TA fluorescence analysis of Fenton and vitamin C–assisted Fenton systems. (A) Time-course profiles of TA fluorescence intensity (Ex/Em = 315/425 nm) under conventional Fenton conditions and vitamin C–assisted Fenton systems with bolus or stepwise supplementation. (B) Endpoint fluorescence intensity at 10 min after blank subtraction. TA fluorescence was used as a relative indicator of •OH-associated product formation and was not interpreted as an absolute quantification of hydroxyl radical generation. Statistical analysis was performed using one-way ANOVA followed by Tukey’s multiple-comparisons test. (n = 3, data are presented as mean ± SD, *P < 0.05, ***P < 0.001). Please click here to view a larger version of this figure.
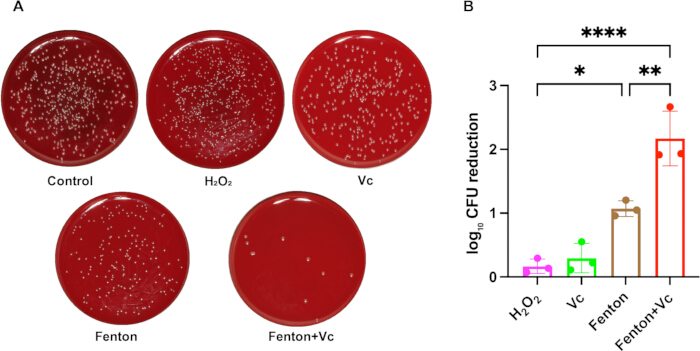
Figure 3: Antibacterial activity of the vitamin C–assisted Fenton system in the primary H. pylori G27 strain. (A) Representative Columbia blood agar plates after different treatments. (B) Quantification of antibacterial activity expressed as log₁₀ CFU reduction relative to the untreated control. The tested groups included untreated control, H₂O₂ alone, vitamin C alone, conventional Fenton reaction, and vitamin C–assisted Fenton reaction. Data are shown as individual biological replicates with mean ± SD; n = 3 independent biological replicates. Statistical comparisons were performed using one-way ANOVA followed by Tukey’s multiple-comparisons test. Only the key comparisons supporting the primary conclusion are shown. Please click here to view a larger version of this figure.
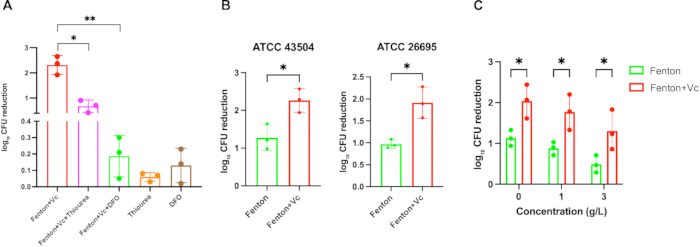
Figure 4: Rescue analysis, limited cross-strain validation, and protein-interference assessment of the vitamin C–assisted Fenton system. (A) Rescue analysis using deferoxamine (DFO) and thiourea in the primary H. pylori G27 strain. Antibacterial activity was expressed as log₁₀ CFU reduction relative to the untreated control. DFO was used as an iron chelator, and thiourea was used as a hydroxyl radical scavenger. The rescue-agent groups were compared with the vitamin C–assisted Fenton group to evaluate whether the antibacterial effect was attenuated by iron chelation or radical scavenging. (B) Limited cross-strain validation in two additional H. pylori reference strains, ATCC 43504 and ATCC 26695. The vitamin C–assisted Fenton group was compared with the conventional Fenton group within each strain. (C) Protein-interference assessment using bovine serum albumin (BSA) at 0, 1, and 3 g/L. At each BSA concentration, the vitamin C–assisted Fenton group was compared with the conventional Fenton group to evaluate whether the enhanced antibacterial effect was maintained in this simplified protein-containing model. Data are shown as individual biological replicates with mean ± SD; n = 3 independent biological replicates. For panel A, statistical comparisons were performed using one-way ANOVA followed by Dunnett’s multiple-comparisons test, with the vitamin C–assisted Fenton group as the reference. For panel B, comparisons were performed using unpaired two-tailed t tests within each strain. For panel C, data were analyzed by two-way ANOVA with treatment and BSA concentration as factors, followed by Šídák’s multiple-comparisons test for pairwise comparisons at each BSA concentration. *P < 0.05, **P < 0.01. Please click here to view a larger version of this figure.
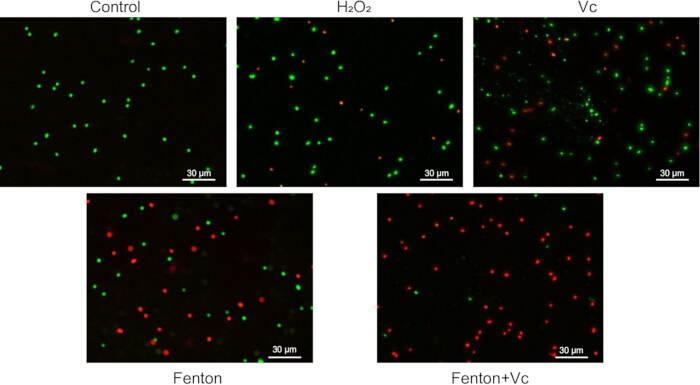
Figure 5: Qualitative live/dead fluorescence staining of H. pylori after different treatments. Representative fluorescence images of H. pylori after treatment with untreated control, H₂O₂ alone, vitamin C alone, conventional Fenton reaction, and vitamin C–assisted Fenton reaction. Bacteria were stained with SYTO9 and propidium iodide (PI), with green fluorescence indicating SYTO9-stained bacteria and red fluorescence indicating PI-stained bacteria. Images were acquired using identical imaging settings across treatment groups. Scale bars, 30 µm. These images provide qualitative visual support for treatment-associated changes in live/dead staining patterns and were not used as a quantitative measurement of bacterial viability. Please click here to view a larger version of this figure.
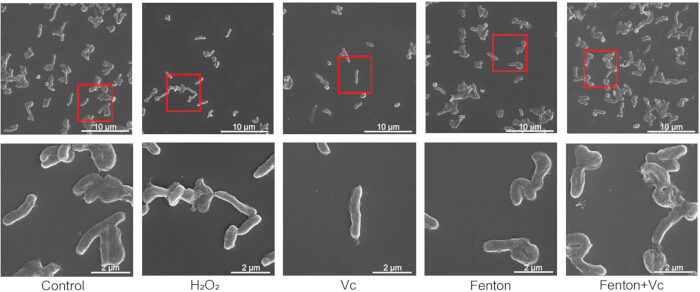
Figure 6: Qualitative scanning electron microscopy analysis of H. pylori morphology after different treatments. Representative SEM images of H. pylori after treatment with untreated control, H₂O₂ alone, vitamin C alone, conventional Fenton reaction, and vitamin C–assisted Fenton reaction. The upper row shows lower-magnification views, and the lower row shows higher-magnification views of selected regions. Scale bars, 10 µm in the upper row and 2 µm in the lower row. The images illustrate qualitative morphology patterns after treatment and were not used to quantify bacterial damage or define a specific antibacterial mechanism. Please click here to view a larger version of this figure.
Discussion
Loading...
$$\rightleftharpoonup{xx}$$
$$\longleftharp{xx}$$,
$$\longrightharp{xx}$$,
The present study examined whether vitamin C dosing could modulate the oxidative behavior and antibacterial readouts of a Fenton-based system under defined acidic in vitro conditions. Across the chemical and microbiological assays, stepwise vitamin C supplementation altered the observable reaction behavior and was associated with greater antibacterial activity against H. pylori than the conventional Fenton reaction under the tested conditions. Importantly, this system should be interpreted as a simplified acidic-saline-urea model rather than a full physiological gastric microenvironment. The model was designed to provide a controlled chemical and microbiological setting for testing Fenton-based oxidative activity, not to reproduce gastric mucus, host cells, immune factors, buffering capacity, or the heterogeneous composition of gastric contents.
AO7 degradation was used as an indirect chemical readout of oxidative activity rather than as a specific measurement of individual reactive oxygen species. In this system, the addition of vitamin C enhanced AO7 degradation at selected Vc: Fe2⁺ ratios, whereas higher vitamin C concentrations reduced the degradation efficiency. This concentration-dependent pattern is consistent with vitamin C's dual biochemical role. Under appropriate redox conditions, vitamin C can act as a reducing agent, promoting Fe3⁺ reduction to Fe2⁺ and supporting Fenton cycling; however, when present in excess or under different reaction conditions, it may also act as an antioxidant or radical scavenger, thereby reducing the availability of highly reactive oxidative species. Thus, the effect of vitamin C in this reaction system is not simply pro-oxidant or antioxidant, but depends on concentration, timing, iron availability, and reaction context23,24.
The TA fluorescence assay provided an additional relative indicator of hydroxyl radical-associated product formation. The stronger fluorescence signals observed in the vitamin C-assisted Fenton groups, particularly under stepwise vitamin C addition, were consistent with the AO7 degradation results. However, TA fluorescence should not be interpreted as an absolute quantification of hydroxyl radicals or total ROS. Probe-based assays can be influenced by reaction kinetics, probe availability, competing substrates, pH, and quenching conditions. Therefore, the AO7 and TA assays together support altered oxidative behavior of the reaction system, but these assays do not independently define the complete ROS profile generated during the reaction.
In the antibacterial assays, the vitamin C-assisted Fenton system produced greater log₁₀ CFU reduction than the conventional Fenton reaction in the primary H. pylori G27 strain under the tested experimental conditions. Because an Fe2⁺-alone group was not included in the primary colony-counting assay, these data should be interpreted as comparisons among the tested treatment groups rather than as definitive evidence excluding all ferrous iron-only effects. The attenuation of antibacterial activity by deferoxamine and thiourea further supports consistency with iron-associated and radical-related oxidative processes, but these rescue experiments do not establish a definitive antibacterial mechanism. Deferoxamine may influence iron availability more broadly, and thiourea is commonly used as a hydroxyl radical scavenger, but, by itself, does not fully define the identity or relative contribution of each ROS species.
The use of pH 3 physiological saline containing 3 mM urea was intended to create a controlled acidic, urea-containing in vitro challenge condition relevant to the acid-adaptation biology of H. pylori, rather than to fully simulate the stomach. This distinction is important because H. pylori is urease-positive and can hydrolyze urea to ammonia and carbon dioxide, thereby contributing to acid neutralization and local pH buffering around the bacterium25,26. Therefore, the acidic condition in the present model should not be assumed to remain chemically identical throughout the entire treatment period. The short reaction duration and simplified saline background allowed controlled comparison among treatment groups, but local pH changes caused by urease activity were not dynamically monitored. Future studies should include time-resolved pH measurements, urease-modulated controls, and more complex gastric-mimicking matrices to better define how urease activity affects the performance of this oxidative system.
Catalase activity represents another important biological factor that may influence Fenton-based antibacterial effects against H. pylori. H. pylori expresses catalase, which can decompose H₂O₂ and protect bacteria from oxidative stress27. Because H₂O₂ is a substrate for the Fenton reaction, catalase activity may reduce available H₂O₂ and thereby compete with Fenton-mediated oxidative chemistry. The observed CFU reduction indicates that antibacterial activity still occurred under the present treatment conditions, but the current study did not directly quantify H₂O₂ consumption, catalase activity, or the balance between enzymatic peroxide decomposition and Fenton reaction kinetics. These factors should be addressed in future studies by measuring residual H₂O₂, testing catalase-deficient or catalase-modulated conditions, and assessing whether bacterial antioxidant defenses alter treatment responsiveness.
The live/dead fluorescence staining and SEM experiments provided qualitative visual observations that were consistent with the direction of the CFU-counting results. The vitamin C-assisted Fenton group showed more apparent red fluorescence in live/dead staining and more visible morphological perturbation by SEM than the conventional Fenton group. However, these assays were not quantified and should not be used as standalone evidence of enhanced membrane damage or a defined structural mechanism. Similarly, the additional reference-strain experiments and BSA protein-interference assay provide limited supporting evidence under selected conditions, but these experiments do not establish broad strain-independent generalizability or performance in a complex gastric matrix.
Several limitations should be acknowledged. First, all experiments were performed in simplified in vitro systems that lacked host cells, gastric mucus, physiological buffering, immune components, dietary substrates, and the spatial heterogeneity of the gastric niche. Second, host-cell toxicity was not tested. Because ROS-generating systems may damage mammalian cells if delivered in vivo, especially through nanoparticle-based or localized delivery strategies, future studies must evaluate gastric epithelial cytotoxicity, mucosal compatibility, and tissue-level safety before any translational interpretation is made28. Third, only the primary G27 strain and two additional reference strains were examined; broader strain diversity and clinical isolates were not included. Fourth, the study relied on indirect chemical probes and rescue assays rather than direct quantitative profiling of individual ROS species. Fifth, although samples were diluted in PBS before plating to reduce acidic and oxidative carryover, complete chemical quenching of residual oxidants was not independently verified. These limitations mean that the present results should be interpreted as proof-of-concept evidence that vitamin C dosing can modulate a Fenton-based oxidative system under controlled in vitro conditions, rather than as evidence of clinical efficacy or a fully established in vivo antibacterial mechanism.
Disclosures
Loading...
$$\rightleftharpoonup{xx}$$
$$\longleftharp{xx}$$,
$$\longrightharp{xx}$$,
The authors have no disclosures.
Acknowledgements
Loading...
$$\rightleftharpoonup{xx}$$
$$\longleftharp{xx}$$,
$$\longrightharp{xx}$$,
This work was supported by Natural Science Foundation of Sichuan Province (No. 2023NSFSC0570) and the project of National Key R&D Program of China (No. 2022YFB3804500)
Materials
| Name | Company | Catalog Number | Comments |
|---|---|---|---|
| Acid Orange 7 (AO7) | Aladdin Reagent (Shanghai) Co., Ltd. | O113230 | Used as a model dye for the AO7 degradation assay. |
| Bovine serum albumin (BSA) | Shanghai Macklin Biochemical Technology Co., Ltd. | B885114 | Used for the matrix-interference assay. |
| Brain Heart Infusion (BHI) broth powder | Sichuan Hapyear Bio-engineering Co., Ltd. | N/A | Used for bacterial culture and cryostorage. |
| Columbia blood agar plates (5% sheep blood) | Changde Bkmam Biotechnology Co., Ltd. | 110701028.0 | Used for bacterial culture and CFU enumeration. |
| Critical point dryer (EM CPD300) | Leica Microsystems | EM CPD300 | Used for SEM sample preparation after graded ethanol dehydration. |
| Deferoxamine (DFO) | Shanghai Macklin Biochemical Technology Co., Ltd. | D873692 | Used as an iron chelator in the rescue assay. |
| Disodium terephthalate | Shanghai Macklin Biochemical Technology Co., Ltd. | D835937 | Used as the TA fluorescence probe for •OH-associated signal detection. |
| Ethanol, absolute | Sigma-Aldrich | E7023 | Used to prepare the graded ethanol series for SEM sample dehydration. |
| Fluorescence microscope (DMi8) | Leica Microsystems | DMi8 | Used for live/dead fluorescence imaging. |
| Glutaraldehyde solution | Sigma-Aldrich | G5882 | Used for fixation of bacterial samples before SEM. |
| Glycerol | Sigma-Aldrich | G5516 | Used for bacterial cryostorage in BHI broth. |
| GraphPad Prism 10 | GraphPad Software, LLC | Prism 10 | Used for statistical analysis and graphing. |
| Helicobacter pylori strain ATCC 26695 | American Type Culture Collection (ATCC) | 700392 | Additional reference strain used for limited cross-strain validation. |
| Helicobacter pylori strain ATCC 43504 | American Type Culture Collection (ATCC) | 43504 | Additional reference strain used for limited cross-strain validation. |
| Helicobacter pylori strain G27 | Center of Infectious Diseases, West China Hospital, Sichuan University | N/A | Primary strain used for colony counting, rescue assay, matrix-interference assay, live/dead staining, and SEM. |
| Hydrogen peroxide solution | Sigma-Aldrich | H1009 | Used as the peroxide substrate in Fenton reaction assays. |
| Iron(II) sulfate monohydrate (FeSO4·H2O) | Shanghai Macklin Biochemical Technology Co., Ltd. | F904376 | Used as the ferrous ion source in the Fenton reaction. |
| Microplate reader (Synergy H1) | Agilent BioTek | Synergy H1 | Used to measure TA-derived fluorescence (Ex/Em = 315/425 nm). |
| Phosphate-buffered saline (PBS), pH 7.4 | Sigma-Aldrich | P4417 | Used for post-treatment dilution/neutralization before plating and sample washing. |
| Physiological saline (0.9% sodium chloride solution) | Millipore | 567442 | Used for bacterial suspension and preparation of the acidic saline-urea model. |
| Scanning electron microscope (INSPECT F) | FEI Company | INSPECT F | Used for bacterial morphology analysis. |
| Sodium hydroxide | Sigma-Aldrich | S5881 | Used to alkalinize TA assay aliquots and stabilize fluorescence. |
| Sputter coater (EM ACE200) | Leica Microsystems | EM ACE200 | Used to apply the thin gold coating before SEM imaging. |
| SYTO 9/PI Live/Dead Bacterial Double Stain Kit | Shanghai Maokang Biotechnology Co., Ltd. | MX4234 | Used for fluorescence-based live/dead bacterial staining. |
| Thiourea | Shanghai Macklin Biochemical Technology Co., Ltd. | T81602 | Used as a radical scavenger in the rescue assay. |
| Urea | Shanghai Macklin Biochemical Technology Co., Ltd. | U820349 | Used to prepare the acidic saline-urea model. |
| UV-Vis spectrophotometer (UV-2600i Plus) | Shimadzu Corporation | UV-2600i Plus | Used to measure AO7 absorbance at 483 nm. |
| Vitamin C (L-ascorbic acid) | Shanghai Macklin Biochemical Technology Co., Ltd. | A800295 | Used as the reductant in the vitamin C-assisted Fenton system. |
Reprints and Permissions
Request permission to reuse the text or figures of this JoVE article
Request Permission