This protocol describes a simulation-based method for optimizing power allocation in integrated sensing and communication systems using a multi-objective optimization model and an enhanced Butterfly Optimization Algorithm to balance communication capacity and target detection performance under different operating conditions.
Research Article
Simulation-Based Power Allocation for Integrated Sensing and Communication Systems Balancing Communication Capacity and Target Detection
62 views
⸱
September 11th, 2026
In This Article
Summary
Abstract
Integrated Sensing and Communication (ISAC) systems require efficient power allocation to balance communication quality and sensing performance while operating under limited spectrum and power resources. Conventional equal power allocation methods often fail to achieve an effective trade-off between communication channel capacity and target detection probability (PDP) because they do not adequately account for the different objectives of communication and sensing. This study proposes a simulation-based power allocation strategy for an Orthogonal Frequency Division Multiplexing (OFDM)-based ISAC system using a normalized multi-objective optimization framework. An improved Butterfly Optimization Algorithm (BOA), incorporating Dynamic Switching Probability and Dynamic Variance Gaussian Mutation strategies, is employed to enhance global search capability, convergence speed, and solution diversity. Numerical simulations were performed under different communication weighting factors, antenna configurations, subcarrier numbers, and signal-to-noise ratios to evaluate the proposed approach. The optimized strategy achieved improved convergence behavior while providing a balanced compromise between communication channel capacity and PDP across multiple simulation scenarios. These findings demonstrate that the proposed optimization framework can effectively support simulation-based resource allocation for OFDM-based ISAC systems while providing a reproducible methodology for evaluating communication-sensing trade-offs under different operating conditions.
Introduction
With the rapid expansion of wireless communication services and the increasing demand for high-performance radar sensing, the conflict between limited spectrum resources and growing service requirements has become increasingly prominent. Meanwhile, the miniaturization and integration of electronic devices have further advanced Integrated Sensing and Communication (ISAC) systems. Consequently, ISAC has emerged as a major research direction in electronic information systems1,2,3. By sharing spectrum and hardware resources, ISAC enables the simultaneous transmission of wireless communication data and radar sensing signals, thereby overcoming the spectrum-efficiency limitations of conventional standalone systems and improving resource utilization in complex scenarios4. Orthogonal Frequency Division Multiplexing (OFDM) is a widely adopted multicarrier modulation technique that improves spectrum utilization and provides strong robustness against multipath interference. Owing to these advantages, OFDM has become the preferred waveform for ISAC systems. The resulting OFDM-ISAC architecture provides a reliable waveform foundation for the coordinated implementation of communication and sensing functions5,6. Accordingly, considerable research has focused on this topic.
To improve communication efficiency and sensing performance, Wen et al.7 proposed a power allocation method (PAM) for free-space optical OFDM-based ISAC systems. Their results demonstrated the effectiveness of the method and highlighted the trade-off between communication and sensing performance. Wang et al.8 developed a deep learning-based power allocation optimization method for OFDM-ISAC systems to minimize communication symbol error rate and the Cramér–Rao lower bound for joint delay and Doppler estimation, demonstrating improved communication performance. To balance communication and sensing performance, AlKhansa et al.9 designed a dynamic PAM for time-of-arrival estimation in OFDM-ISAC systems, and numerical results confirmed the importance of incorporating multiple sensing constraints. He et al.10 formulated a max–min optimization problem for multicarrier OFDM-ISAC systems and developed an iterative optimization algorithm based on successive convex approximation to solve the resulting nonconvex problem, thereby improving communication performance. Liao et al.11 proposed a computationally efficient ISAC transmit beamformer based on a weighted combination of a linear precoder and a predefined array beamformer, demonstrating favorable computational efficiency and overall performance.
Despite these advances, most OFDM-ISAC systems still rely on equal power allocation, which limits overall system performance when communication and sensing functions operate simultaneously. A power allocation strategy that maximizes communication channel capacity may reduce target detection performance, whereas a strategy optimized solely for target detection probability (PDP) may allocate excessive power to sensing at the expense of communication quality. Furthermore, because communication channel capacity and PDP have different physical dimensions, conventional weighted-sum optimization methods cannot adequately balance their relative contributions, limiting the overall performance of OFDM-ISAC systems. This study investigates transmit power allocation in OFDM-ISAC systems to jointly optimize communication channel capacity and PDP despite these dimensional differences. The proposed OFDM-ISAC-P model normalizes both objective functions and applies tunable weighting factors to improve optimization comparability. To overcome the limitations of the conventional Butterfly Optimization Algorithm (BOA), including fixed parameters, slow convergence, and susceptibility to local optima, Dynamic Switching Probability (DSP) and Dynamic Variance Gaussian Mutation (DVGM) strategies are incorporated to improve search adaptability. The study hypothesizes that combining normalized multi-objective optimization with the improved BOA produces a more stable Pareto-equilibrium power allocation than conventional equal power allocation and the standard BOA. The principal contributions of this study include the development of a normalized multi-objective power allocation model, an enhanced BOA-based optimization framework, and simulation-based validation using multi-antenna, multicarrier, and intelligent transportation scenarios.
Protocol
This study involved only mathematical modeling, algorithm development, and numerical simulations for an OFDM-ISAC system. No human participants, animals, biological specimens, or personally identifiable data were involved. Therefore, institutional ethics approval, including Institutional Review Board (IRB) or Institutional Animal Care and Use Committee (IACUC) approval, was not required.
Design of power allocation model for the Orthogonal Frequency Division Multiplexing-Based Integrated Sensing and Communication System
In ISAC systems, traditional equal PAMs often distribute transmission power evenly across each channel and antenna during simultaneous communication and sensing without considering their different performance requirements. This may allocate excessive power to inefficient transmission links and fail to satisfy the heterogeneous requirements of communication and sensing services, thereby reducing overall power utilization efficiency12,13,14. Therefore, this study considers the dual functional objectives of the system by jointly optimizing communication channel capacity and PDP. A multi-objective optimization framework is constructed to develop a power allocation strategy for the OFDM-based ISAC system, referred to as the OFDM-ISAC-P model. OFDM is an efficient multicarrier modulation technique consisting of a transmitting end and a receiving end. The OFDM process is illustrated in Figure 1.
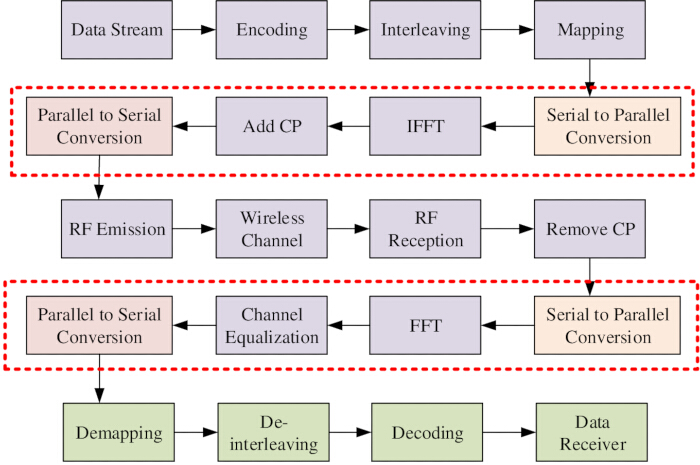
Figure 1. Signal-processing workflow of the Orthogonal Frequency Division Multiplexing (OFDM) waveform used in the Integrated Sensing and Communication (ISAC) system. The workflow includes data encoding, interleaving, symbol mapping, serial-to-parallel conversion, inverse fast Fourier transform (IFFT), cyclic-prefix (CP) insertion, radio-frequency (RF) transmission, wireless channel propagation, RF reception, CP removal, fast Fourier transform (FFT), channel equalization, demapping, deinterleaving, decoding, and data recovery. Please click here to view a larger version of this figure.
In Figure 1, OFDM signals serve as the shared waveform for communication and sensing because of their high spectrum utilization and strong resistance to multipath interference, thereby enabling unified waveform transmission for both functions15,16,17. Neglecting the spectral shaping effect of the window function, the transmitted OFDM waveform is constructed using the carrier frequency, number of subcarriers, subcarrier complex weights for power allocation, communication signal encoding, and subcarrier spacing. The system bandwidth is determined by the subcarrier spacing and the number of subcarriers18. The communication signal generation process is specified as follows. Binary information bits are first encoded using a low-density parity-check (LDPC) coding scheme to improve transmission reliability and are subsequently mapped to complex-valued symbols using quadrature phase shift keying (QPSK) modulation. The modulated symbols are allocated to OFDM subcarriers according to the optimized power allocation strategy. Following inverse fast Fourier transform (IFFT) processing and cyclic prefix (CP) insertion, the time-domain OFDM communication waveform is generated and transmitted together with the sensing signal. The same modulation and coding configuration is maintained throughout all simulations. The ISAC system configuration used in this study is shown in Figure 2.
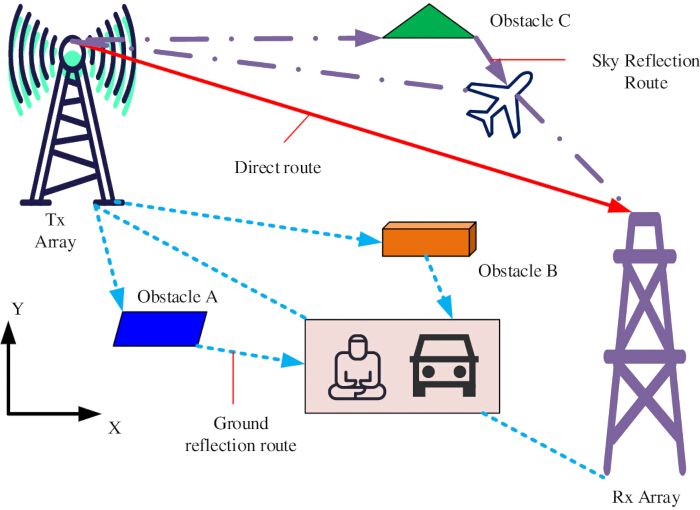
Figure 2. System configuration of the Orthogonal Frequency Division Multiplexing (OFDM)-based Integrated Sensing and Communication (ISAC) system. The diagram illustrates the transmitting (Tx) array, receiving (Rx) array, direct line-of-sight (LoS) communication path, target-echo sensing path, ground-reflection path, sky-reflection path, and representative obstacles within the simulated propagation environment. Please click here to view a larger version of this figure.
The system consists of a transmitting antenna array and a receiving antenna array. Signal transmission occurs through two main paths. The first is the Line-of-Sight (LoS) path, in which the signal is transmitted directly from the transmitting array to the receiving array. The second is the reflection path, in which a portion of the signal is reflected from the ground and reaches the receiving array, whereas another portion propagates through a sky-reflection path before reaching the receiving array19,20,21. The system is a LoS-dominant multi-antenna OFDM-ISAC system in which the communication and sensing receivers may adopt different antenna configurations. Although Figure 2 illustrates possible propagation components, including the direct LoS path and reflection-related paths, the mathematical model and simulations consider only the dominant LoS communication link and target echo sensing link. Ground and sky reflections are treated as background propagation effects rather than independently optimized non-LoS (NLoS) channels. The channel response matrix is defined under the LoS-dominant assumption, with multipath effects represented through fading, Doppler shift, and noise terms. Based on this channel response matrix, together with the transmitted signal and channel noise model, the received communication signal is expressed in Equation 1.

Here, nc,m represents Gaussian white noise, Sm denotes the transmitted signal, and Hc,m represents the communication channel response matrix.
In the sensing function of the ISAC system, the signal transmission path consists of two stages. The first stage is transmission from the transmitter to the target, and the second is the echo path, in which the reflected signal propagates from the target back to the receiver through the sensing channel22,23,24. For the m-th subcarrier, the sensing channel response matrix characterizes signal propagation and is expressed as Equation 2:

Here, bs represents the sensing echo-path fading coefficient, fs,m denotes the reflected Doppler frequency shift, and τs represents the propagation delay of the reflection path. Based on the sensing channel response matrix, the received sensing signal is expressed as Equation 3:

Here, ns,m represents Gaussian white noise in the sensing channel.
In wireless communication systems, efficient spectrum planning and resource allocation are essential for improving overall system performance25. Accordingly, this study uses communication channel capacity as the primary design criterion. An optimization model is established to maximize channel capacity by allocating the total transmission power across the OFDM subcarriers according to the proposed resource allocation strategy, as expressed in Equation 4.
The communication optimization problem is formulated as follows (Equation 4):

subject to

Here, σc2 represents the noise variance of the communication Gaussian channel, P denotes the total communication transmission power, Pc represents the optimal communication power allocation vector, am denotes the weight assigned to the m-th subcarrier, and Nc represents the number of subcarriers.
The optimal solution obtained using the WA is expressed as Equation 5:
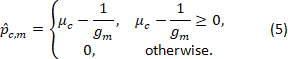
Here,  denotes the optimal power allocated to the m-th communication subchannel, gm represents the channel-to-noise gain ratio of the m-th communication subchannel, and μc denotes the water level of the WA.
According to the WA illustrated in Figure 3, subchannels with higher channel gains, corresponding to smaller inverse channel gains, receive greater transmission power under the selected water level. This enables the system to exploit favorable channel conditions while satisfying the total power constraint and improving overall communication capacity. Consequently, subchannels with better channel conditions receive more power, whereas those with poorer channel conditions receive less. Through this adaptive power allocation strategy, the WA efficiently utilizes channel resources to improve communication performance.
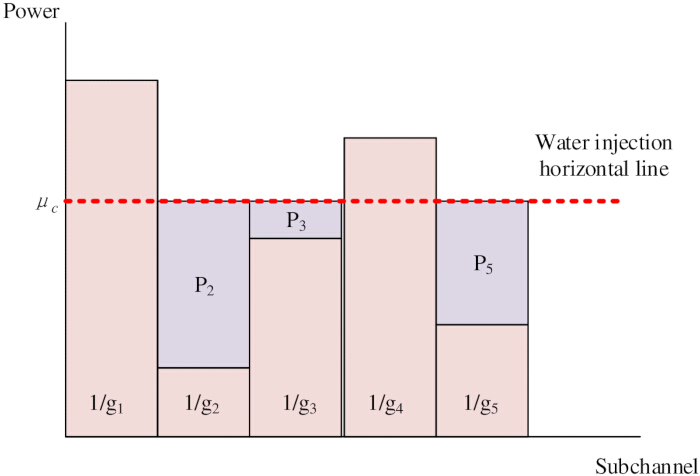
Figure 3. Principle of the Water-Filling Algorithm (WA) used for communication power allocation. The horizontal axis represents the OFDM subchannels, and the vertical axis represents the inverse channel gain and allocated transmission power. The water level determines the transmit power assigned to each subchannel under the total transmission-power constraint. Please click here to view a larger version of this figure.
For the sensing objective, an appropriate power allocation strategy is essential when the false alarm probability is fixed. An optimized power allocation strategy enhances sensing performance by improving target detection accuracy. The sensing process requires hypothesis testing under the target-present hypothesis (H1) and the target-absent hypothesis (H0). Under these hypotheses, the received signal for each subcarrier during the k-th pulse is expressed as Equation 6:

Here, y denotes the sensing observation vector, A represents the diagonal matrix diag(a0, a1, …, aNc−1), D(v) denotes the diagonal matrix containing the target Doppler frequency shift, β represents the target reflection coefficient vector, and ns denotes Gaussian white noise in the sensing channel.
The probability density functions under H0 and H1 are then evaluated. For a specified false alarm probability, the PDP is calculated based on these two hypotheses. According to likelihood ratio detection theory, a generalized maximum likelihood ratio detector is subsequently derived to maximize the PDP.
The generalized maximum likelihood ratio detector is expressed as Equation 7:

Here, lG and LG denote the generalized likelihood ratio detection statistic and likelihood ratio function, respectively, yH represents the Hermitian transpose of y, and γ0 denotes the detection threshold. During the detection process, the threshold is used to determine whether the target-present hypothesis (H1) or the target-absent hypothesis (H0) is accepted. The relationship between the sensing detection threshold and the target detection probability is illustrated in Figure 4.
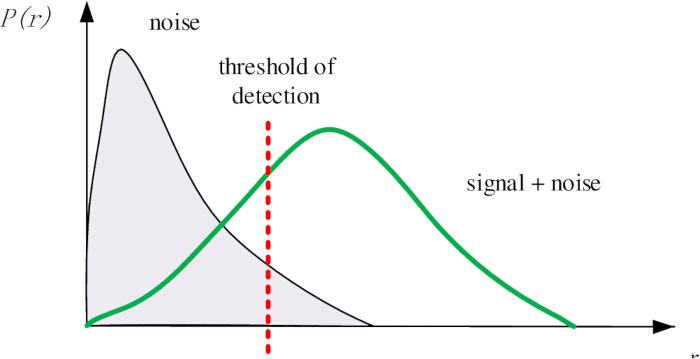
Figure 4. Relationship between the sensing detection threshold and target detection probability. The probability density functions under the target-absent hypothesis and target-present hypothesis are shown together with the detection threshold used for hypothesis testing. The shaded regions correspond to the decision regions associated with the false alarm probability and target detection probability. Please click here to view a larger version of this figure.
As shown in Figure 4, the PDP is directly related to the non-central complex chi-square distribution. Under a fixed false alarm probability (i.e., the maximum allowable false detection probability), the non-centrality parameter is positively correlated with the PDP. Consequently, increasing the non-centrality parameter improves the probability of correctly detecting the target signal. Based on this relationship, the total sensing transmission power is treated as the power constraint, whereas maximizing the non-centrality parameter is selected as the optimization objective. The resulting constrained optimization problem is used to derive the optimal sensing power allocation strategy and is expressed as Equation 8:

where α denotes the optimal sensing transmit weight vector obtained under the power constraint and also represents the sensing subcarrier transmit weight vector, B(v, β) denotes the sensing-information vector, and P represents the total sensing transmission power.
The optimization indicates that the optimal sensing power allocation strategy does not distribute power across multiple subchannels. Instead, all available sensing transmission power is allocated to the subchannel identified through channel evaluation as providing the highest sensing performance, thereby maximizing single-channel target detection performance.
In the OFDM-ISAC system, power allocation is the core optimization task, and the optimal strategy must satisfy the design requirements of both communication and sensing. Specifically, the optimization simultaneously considers communication performance metrics, including bit error rate and channel capacity, together with sensing performance metrics, including PDP and parameter estimation accuracy. Overall system performance is improved through coordinated resource allocation. However, directly combining the optimal communication and sensing power allocation strategies using conventional weighted-sum optimization has important limitations. Because the different physical dimensions and relative contributions of the two performance metrics are not adequately considered, the resulting optimization may not accurately reflect the requirements of integrated communication-sensing systems26,27.
Therefore, this study proposes an integrated design framework based on normalized weighting. First, the communication and sensing performance metrics are normalized to eliminate the effects of dimensional inconsistency. The weighting coefficients are then adjusted according to the application scenario to achieve a more balanced power allocation. The mathematical formulation of the normalized OFDM-ISAC-P model is given in Equation 9:
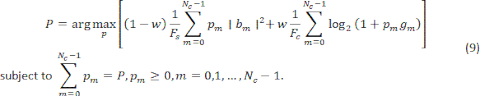
Here, w denotes the communication weighting factor, Fc represents the optimal objective value obtained from the communication optimization problem, pm denotes the power allocated to the m-th OFDM subcarrier, gm represents the equivalent channel-to-noise gain of the m-th communication subcarrier, P denotes the total transmission power, Fs represents the optimal objective value obtained from the sensing optimization problem, and bm denotes the m-th element of the sensing vector B(v, β).
The communication weighting factor w, together with its complementary sensing weighting factor (1 − w), serves as a tunable design parameter that reflects the relative importance of communication channel capacity and PDP under different application scenarios28,29. In this study, w is treated as a scenario-level configuration parameter rather than a time-varying control variable. Accordingly, w is fixed for each simulation scenario (e.g., w = 0.5 for balanced communication and sensing performance and w = 0.8 for communication-priority operation). The improved BOA is then used to optimize the corresponding power allocation. Therefore, the term “dynamic weighting factor” refers to selecting different weighting factors for different operating scenarios rather than implementing real-time automatic adaptation during algorithm execution.
Solution of the Power Optimization Model for the Orthogonal Frequency Division Multiplexing-Based Integrated Sensing and Communication System Using the Improved Butterfly Optimization Algorithm
After constructing the OFDM-ISAC-P model, the improved BOA is used to solve the optimization problem. The BOA has a simple structure, is easy to implement, and possesses strong global search capability. It mimics butterfly foraging behavior and employs a Lévy flight mechanism to efficiently explore the search space. The algorithm requires relatively few parameter settings, making it suitable for a wide range of optimization problems. However, the conventional BOA may converge prematurely to local optima, is sensitive to parameter settings, and often requires many iterations when solving high-dimensional optimization problems30. Therefore, the mutation strategy and optimization procedure are enhanced in this study.
To improve global exploration during the early optimization stage, a DSP strategy is introduced. During the initial iterations, a relatively small switching probability enhances exploration of the search space. As the number of iterations increases, the switching probability is gradually adjusted to strengthen local exploitation and improve convergence. The DSP is defined in Equation 10:

where α denotes the initial value of the DSP, t represents the current iteration number, and β is the control coefficient. This adaptive strategy increases population diversity during the early optimization stage, broadens the search space, and reduces the likelihood of premature convergence to local optima. As the optimization progresses, the search gradually shifts from global exploration to local exploitation.
To further improve optimization performance, DVGM is incorporated into the algorithm. A relatively large mutation variance is applied during the early iterations to expand the search range and improve global exploration. As the optimization proceeds, the mutation variance is gradually reduced to enhance local search accuracy and facilitate convergence. The maximum variance σmax and minimum variance σmin are defined in Equation 11:

The enhanced global and local search strategies are summarized in Equation 12:

Here, normrnd(0, σ(t)) denotes a Gaussian random number with a mean of 0 and variance σ(t), and fi represents the fragrance parameter that controls the butterfly search behavior. After incorporating the DSP and DVGM strategies, the improved BOA is obtained, as illustrated in Figure 5.
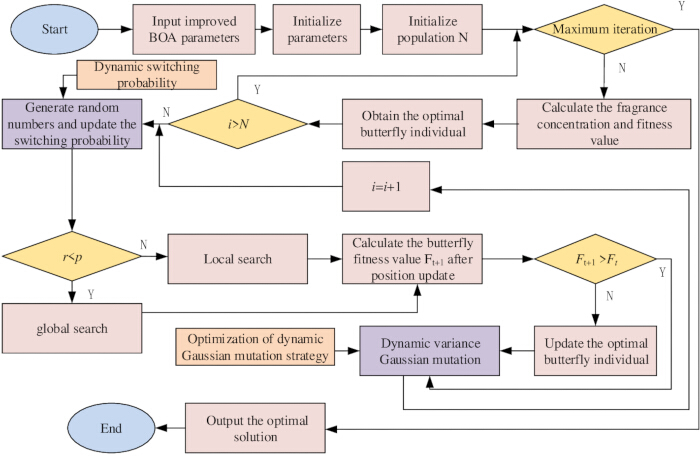
Figure 5. Workflow of the improved Butterfly Optimization Algorithm (BOA). The optimization procedure includes initialization, population generation, fitness evaluation, Dynamic Switching Probability (DSP), global and local searches, Dynamic Variance Gaussian Mutation (DVGM), solution updating, convergence assessment, and optimal solution output. Please click here to view a larger version of this figure.
Figure 5 illustrates the two improvement strategies incorporated into the BOA: DSP and DVGM. The DSP strategy adaptively adjusts the switching frequency between global and local search. During the early optimization stage, the algorithm emphasizes global exploration to increase population diversity and improve the probability of identifying promising solution regions. As the optimization progresses, the search gradually shifts toward local exploitation to accelerate convergence. The DVGM strategy perturbs the current best individual, thereby enhancing local search capability, increasing solution diversity, and reducing the likelihood of premature convergence to local optima.
When the improved BOA is applied to solve the OFDM-ISAC-P model, the optimization variables are first encoded, an initial population is generated, and candidate power allocation strategies are assigned to each individual. The overall optimization workflow is illustrated in Figure 6.
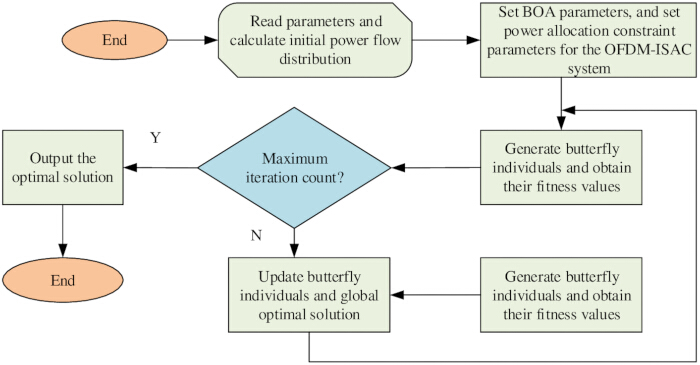
Figure 6. Workflow of the improved Butterfly Optimization Algorithm (BOA) for solving the Orthogonal Frequency Division Multiplexing-based Integrated Sensing and Communication (OFDM-ISAC) power allocation model. The procedure includes parameter initialization, encoding of candidate power-allocation vectors, population generation, fitness evaluation, iterative solution updating, convergence assessment, and output of the optimal power-allocation strategy. Please click here to view a larger version of this figure.
As shown in Figure 6, the optimization begins by applying the DSP strategy to perform iterative optimization. During the early iterations, global exploration is emphasized to investigate diverse power allocation combinations for the OFDM-ISAC system. In the later iterations, the search gradually shifts toward local exploitation to refine high-quality candidate solutions while satisfying the total transmission power constraint. The DVGM strategy is subsequently applied to the current best solution to escape local optima and maintain solution diversity. Throughout the optimization process, the communication and sensing objective functions are used to evaluate the fitness of each candidate solution, and higher-quality individuals are retained for the next iteration. The optimization continues until the predefined termination criterion is satisfied. The final optimal solution represents the power allocation strategy that provides the best balance between communication performance and target detection performance.
Reproducibility settings
To improve reproducibility, the simulation parameters, initialization settings, constraints, and termination criteria are specified in detail. All experiments were implemented on Ubuntu 22.04 LTS using Python 3.10, PyTorch 2.1, NumPy 1.26, CVXPY 1.4, and MATLAB R2023b (refer to Table of Materials). The simulation parameters and computational environment used in this study are summarized in Table 1, whereas the detailed OFDM-ISAC simulation parameter configuration is provided in Supplementary Table 1. The simulations used a noise power spectral density of −174 dBm/Hz, 64 subcarriers, 16 OFDM symbols, a carrier frequency of 4 GHz, a subcarrier spacing of 15 kHz, eight transmit antennas, and a maximum of 10,000 iterations. The power allocation ratio was initialized within the range of 0–1 with a resolution of 0.01 and normalized to satisfy the total transmission power constraint. The communication weight, sensing weight, and multi-layer prior accuracy were set to 0.2, 0.3, and 0.5, respectively. The optimization constraints included non-negative user power allocation, limited total transmission power, limited bandwidth, and a false alarm probability on the order of 10⁻3. The optimization terminated when either the maximum number of iterations was reached or the relative change in the objective function between two consecutive iterations fell below 10⁻4. All random initialization and channel perturbation experiments used fixed random seeds and were independently repeated 30 times.
| Parameter | Value | Description |
| Carrier frequency | 4 GHz | OFDM carrier frequency. |
| Communication encoding/modulation scheme | Quadrature Phase Shift Keying (QPSK) modulation with Low-Density Parity-Check (LDPC) channel coding | Communication signal generation method used to reproduce the transmitted OFDM waveform. |
| Communication weight | 0.2 | Weight assigned to the communication objective. |
| False alarm probability | 10⁻³ | False alarm probability used as the sensing optimization constraint. |
| Hardware platform | Intel Core i7-13700 CPU, NVIDIA RTX 4070 GPU, 32 GB RAM | Computational platform used for the simulations. |
| ISAC simulation benchmark dataset | Not applicable. All benchmark data were generated through numerical simulations. | Benchmark dataset used for performance evaluation. |
| Maximum number of iterations | 10,000 | Maximum number of optimization iterations. |
| Multi-layer prior accuracy | 0.5 | Prior-information parameter used during optimization. |
| Noise power spectral density | −174 dBm/Hz | Communication channel noise spectral density. |
| Number of OFDM symbols | 16 | Number of OFDM symbols per frame. |
| Number of OFDM subcarriers | 64 | Number of OFDM subcarriers. |
| Operating system | Ubuntu 22.04 LTS | Computational environment. |
| Optimization software | CVXPY 1.4 | Convex optimization package. |
| Power allocation resolution | 0.01 | Resolution of the initialized power allocation ratios. |
| Programming language | Python 3.10 | Programming language used for simulation implementation. |
| Random seed | Fixed | Fixed random seed used for all simulations. |
| Repeated runs | 30 | Number of independent simulation runs performed for statistical analysis. |
| Scientific computing library | NumPy 1.26 | Numerical computing library used for numerical computations. |
| Sensing weight | 0.3 | Weight assigned to the sensing objective. |
| Simulation platform | MATLAB R2023b | Platform used for numerical simulation and visualization. |
| Stopping criterion | Maximum iterations or relative objective change < 10⁻⁴ | Optimization termination criterion. |
| Subcarrier spacing | 15 kHz | OFDM subcarrier spacing. |
| Tensor computation library | PyTorch 2.1 | Tensor computation framework used for matrix and tensor computations. |
| Total transmit antennas | 8 | Number of transmitting antennas. |
Table 1: Simulation parameters and computational environment used for the Orthogonal Frequency Division Multiplexing (OFDM)-based Integrated Sensing and Communication (ISAC) simulations. The table summarizes the waveform parameters, optimization parameters, simulation settings, computational environment, software, datasets, and other simulation conditions used throughout the study.
Unless otherwise specified, percentage improvements reported as “increased by X%” are calculated as relative percentage gains using Equation 13:

For probability- or rate-based performance metrics, such as the PDP, absolute changes are explicitly reported as percentage-point (pp) increases. For example, an increase from 46% to 63% is reported as +17 pp, whereas +37.0% denotes the corresponding relative percentage increase calculated using 46% as the baseline.
Results
Performance testing of the improved Butterfly Optimization Algorithm
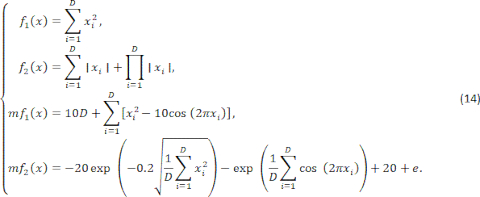
Before evaluating the effectiveness of the OFDM-ISAC PAM, the improved BOA was evaluated. The conventional BOA, Whale Optimization Algorithm (WOA), and Particle Swarm Optimization (PSO) were selected as comparison algorithms. The benchmark evaluation used the mean value and standard deviation as performance metrics, with two unimodal benchmark functions ( and ) and two multimodal benchmark functions ( and ). The benchmark settings used for the optimization algorithms are described below. The problem dimension was fixed at , the maximum number of iterations was 500, and the population size was 30. Each algorithm was independently executed 30 times to calculate the mean value and standard deviation. Here, denotes the -th decision variable, and the theoretical global optimum of all benchmark functions is zero. Four standard benchmark functions were selected to evaluate the optimization performance of the improved BOA. Specifically, and correspond to the Sphere and Schwefel 2.22 functions, respectively, which are widely used to evaluate the global convergence capability of optimization algorithms. The multimodal benchmark functions and correspond to the Rastrigin and Ackley functions, respectively, which are commonly used to evaluate global exploration capability and the ability to avoid local optima. The mathematical definitions of these benchmark functions are given in Equation 14, and the corresponding benchmark references are provided.
To evaluate the performance-balancing capability of the normalized weighting strategy under different communication weighting factors, the communication weighting factor was varied from 0.2 to 0.8 while maintaining a fixed signal-to-noise ratio (SNR) of 15 dB and a 4 × 4 transmit/receive antenna configuration. The optimization performance of the improved BOA was compared with that of the conventional BOA. The communication and sensing performance obtained under different communication weighting factors is summarized in Table 2.
| Communication weight factor | Communication channel capacity (bps/Hz) | Target detection probability (%) | IBOA convergence iterations | BOA convergence iterations | Total power utilization (%) | Pareto-front distance |
| 0.2 | 12.4 | 93.7 | 110 | 243 | 98.6 | 0.033 |
| 0.4 | 15.7 | 88.5 | 103 | 229 | 99 | 0.027 |
| 0.5 | 17.3 | 82.1 | 97 | 216 | 99.4 | 0.02 |
| 0.6 | 18.8 | 75.4 | 90 | 202 | 99.7 | 0.016 |
| 0.7 | 20 | 68.6 | 82 | 194 | 99.9 | 0.011 |
| 0.8 | 21.6 | 61.5 | 76 | 183 | 100 | 0.009 |
Table 2: Communication and sensing performance obtained under different communication weighting factors. The table summarizes the communication weighting factor, communication channel capacity (bps/Hz), target detection probability (%), convergence iterations of the Improved Butterfly Optimization Algorithm (IBOA) and conventional Butterfly Optimization Algorithm (BOA), total power utilization (%), and Pareto-frontier distance.
As shown in Table 2, increasing the communication weighting factor from 0.2 to 0.8 increased the communication channel capacity by 74.2% while decreasing the PDP by 34.4%, demonstrating the ability of the weighting strategy to adjust the trade-off between communication and sensing performance. The improved BOA converged more rapidly than the conventional BOA, with an average of 93 convergence iterations, representing a 56.0% reduction in the average number of iterations required for convergence compared with the conventional BOA. In addition, the Pareto-frontier distance decreased as the communication weighting factor increased. For example, the Pareto-frontier distance decreased from 0.020 at a communication weighting factor of 0.5 to 0.009 at 0.8, indicating that the optimized solutions approached the corresponding Pareto-optimal operating points as the communication weighting factor increased. A smaller Pareto-frontier distance at a higher communication weighting factor (e.g., 0.8) represents a solution that places greater emphasis on communication capacity, whereas ω = 0.5 represents a more balanced trade-off between the normalized communication capacity and PDP. Accordingly, ω = 0.5 is treated as a representative balanced operating point rather than the unique global minimum of the Pareto-frontier distance. The convergence performance under the unimodal benchmark functions is presented in Figure 7.
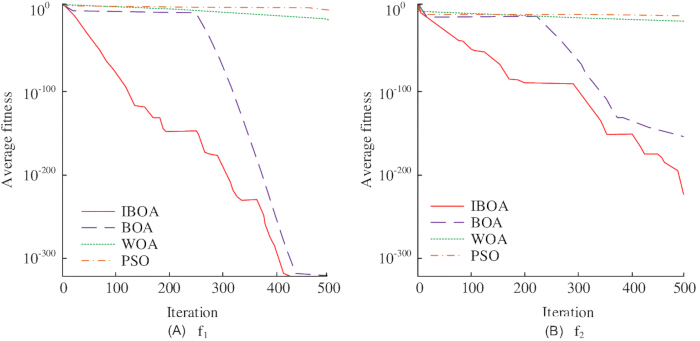
Figure 7. Convergence performance of the optimization algorithms on unimodal benchmark functions. (A) Function f1. (B) Function f2. The horizontal axis represents the iteration number, and the vertical axis represents the average fitness value. Curves compare the improved Butterfly Optimization Algorithm (IBOA), conventional Butterfly Optimization Algorithm (BOA), Whale Optimization Algorithm (WOA), and Particle Swarm Optimization (PSO). Please click here to view a larger version of this figure.
Figure 7A presents the results for the unimodal function f1, whereas Figure 7B presents the results for the unimodal function f2. The average fitness convergence, represented by the reduction in the standard deviation, was used to evaluate optimization performance. The improved BOA, conventional BOA, WOA, and PSO were evaluated under identical benchmark conditions. Based on 30 independent runs, one-way analysis of variance followed by Tukey’s post hoc test with Holm-Bonferroni correction demonstrated significantly lower final convergence variance for the improved BOA than for the conventional BOA, WOA, and PSO, with statistically significant differences observed after Holm-Bonferroni correction (adjusted p < 0.05). Under the unimodal benchmark functions, the convergence variance of the WOA and PSO algorithms decreased more slowly than that of the BOA-based methods. For function f1, both the improved BOA and the conventional BOA achieved very low final fitness values; however, the improved BOA reached this level earlier in the optimization process. For function f2, all algorithms converged more slowly, although the improved BOA achieved the lowest final fitness value after 500 iterations. The convergence results for the multimodal benchmark functions are presented in Figure 8.
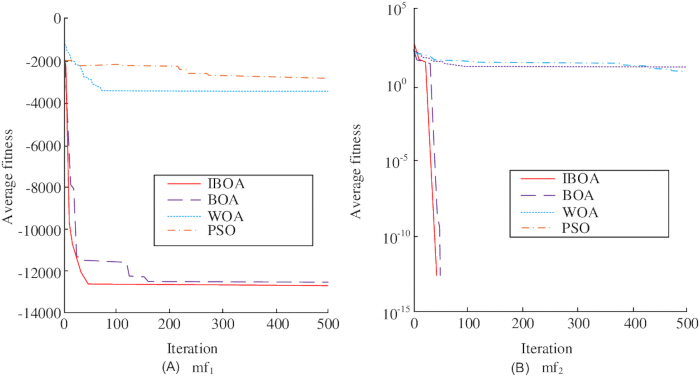
Figure 8. Convergence performance of the optimization algorithms on multimodal benchmark functions. (A) Function mf1. (B) Function mf2. The horizontal axis represents the iteration number, and the vertical axis represents the average fitness value. Curves compare the improved Butterfly Optimization Algorithm (IBOA), conventional Butterfly Optimization Algorithm (BOA), Whale Optimization Algorithm (WOA), and Particle Swarm Optimization (PSO). Please click here to view a larger version of this figure.
Figure 8A presents the results for the multimodal function mf1, whereas Figure 8B presents the results for the multimodal function mf2. Under the multimodal benchmark functions, the improved BOA maintained better convergence stability than the comparison algorithms. Based on 30 independent runs, statistically significant differences were observed between the improved BOA and the comparison algorithms after Holm-Bonferroni correction (adjusted p < 0.05). The proposed DSP and DVGM strategies improved the global search capability of the BOA. The conventional BOA exhibited performance closer to that of the improved BOA under the multimodal benchmark functions than under the unimodal benchmark functions, indicating improved suitability for multimodal optimization problems. Overall, the improved BOA outperformed the comparison algorithms across the evaluated benchmark functions and was subsequently applied to solve the OFDM-ISAC power optimization model.
All optimization algorithms were independently executed 30 times for each benchmark function. Final convergence values are reported as the mean ± standard deviation. One-way analysis of variance was used to compare the four optimization algorithms, followed by Tukey’s post hoc test for pairwise comparisons with Holm-Bonferroni correction for multiple testing. Adjusted p values are reported, and p < 0.05 was considered statistically significant.
Simulation analysis of power allocation in the Orthogonal Frequency Division Multiplexing-Based Integrated Sensing and Communication System
After evaluating the optimization algorithm, the effectiveness of the OFDM-ISAC power allocation strategy was further analyzed using numerical simulations. In the simulation experiments, the transmitting antenna, communication antenna, and sensing receiving antenna of the system were all set to four, denoted by B, T, and R, respectively. The variations in communication channel capacity and PDP under different antenna configurations are shown in Figure 9. Unless otherwise specified, all simulations in this section used the same LoS-dominant OFDM-ISAC channel model described in the Methods section. The antenna configurations were varied only to evaluate scalability and comparative performance. Specifically, the single-input single-output (SISO) configuration was used as the reference benchmark, the 2-transmit 2-receive (2T2R) configuration was used for subcarrier sensitivity verification, and the 4-transmit 4-receive (4T4R) configuration was used as the primary multi-antenna configuration for communication-sensing performance evaluation.
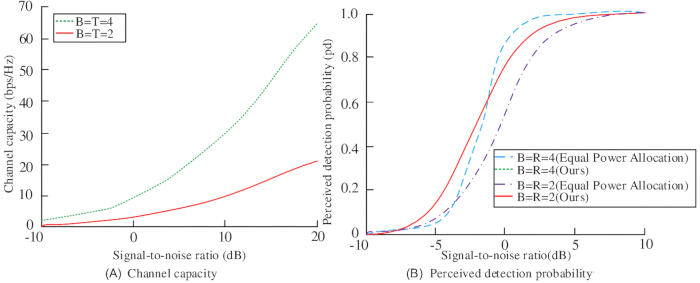
Figure 9. Effects of antenna configuration on communication and sensing performance under different signal-to-noise ratios (SNRs). (A) Communication channel capacity (bps/Hz) as a function of SNR. (B) Target detection probability as a function of SNR. Curves compare the proposed power-allocation method and equal power allocation using different transmit and receive antenna configurations. Please click here to view a larger version of this figure.
As shown in Figure 9A, the communication channel capacity increased with the number of antennas. When the number of transmitting and receiving antennas increased from two to four, the communication channel capacity increased from approximately 20 bps/Hz to nearly 60 bps/Hz at an SNR of 20 dB, reflecting the spatial multiplexing gain provided by the multi-antenna configuration. Figure 9B shows that, under different transmitting and receiving antenna configurations, the PDP obtained using the proposed optimal PAM was consistently higher than that obtained using equal power allocation. When the SNR was 10 dB and the transmitting antenna number was four, the PDP of the proposed method approached the theoretical optimum of 1, whereas the equal PAM remained substantially lower. The improved BOA maximizes the likelihood ratio function through iterative optimization, dynamically adjusts the power allocation ratio among transmitting antennas, and allocates more transmission power to antennas with stronger responses while reducing power assigned to weaker responses, thereby improving target detection performance.
When both the communication and sensing transmitting and receiving antennas were configured as 4T4R, the OFDM-ISAC system power optimization model was evaluated. The communication channel capacity and PDP obtained under different communication weighting factors are presented in Figure 10.
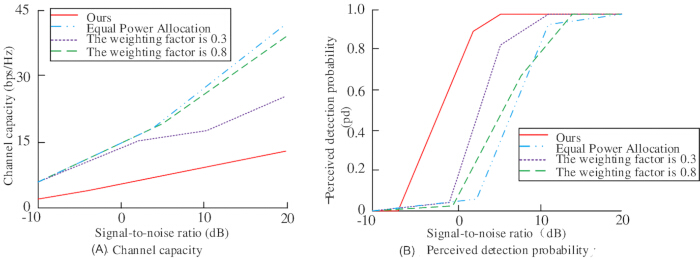
Figure 10. Effects of communication weighting factor on communication and sensing performance. (A) Communication channel capacity as a function of signal-to-noise ratio (SNR). (B) Target detection probability as a function of SNR. Curves compare the proposed method, equal power allocation, and communication weighting factors of 0.3 and 0.8. Please click here to view a larger version of this figure.
Figure 10A shows that the communication channel capacity varied under different PAMs when both the communication and sensing antenna configurations were 4T4R. The communication channel capacity increased with increasing SNR for all evaluated PAMs. At an SNR of 20 dB, the channel capacities were approximately 13 bps/Hz for the proposed method, 40 bps/Hz for equal power allocation, 42 bps/Hz at a communication weighting factor of 0.3, and 38 bps/Hz at a communication weighting factor of 0.8. Figure 10B shows that the PDP increased with increasing SNR for all evaluated PAMs and approached 1 at an SNR of 20 dB. These results demonstrate that the communication weighting factor affects the trade-off between communication channel capacity and sensing performance.
Subsequently, comparative simulations were performed to further evaluate the effectiveness of the proposed method. The conventional OFDM PAM under the SISO architecture was selected as the reference benchmark (hereafter referred to as the comparative method) and was compared with the power allocation strategy obtained using the proposed OFDM-ISAC-P model. When the communication weighting factor was 0.8, the communication channel capacity and PDP obtained under different antenna configurations as a function of SNR are shown in Figure 11.
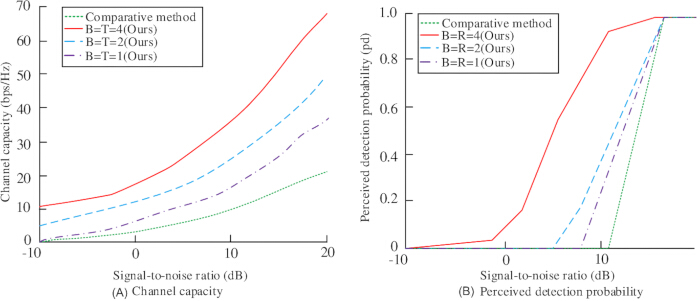
Figure 11. Communication and sensing performance obtained using different antenna configurations. (A) Communication channel capacity as a function of signal-to-noise ratio (SNR). (B) Target detection probability as a function of SNR. Curves compare the proposed method using one, two, and four transmit/receive antenna configurations together with the comparison method. Please click here to view a larger version of this figure.
Figure 11A shows that, when the transmitting antenna number was four and the communication weighting factor was 0.8, the communication channel capacity reached approximately 67 bps/Hz at an SNR of 20 dB. Under the 2T2R configuration, the communication channel capacity was approximately 48 bps/Hz, whereas the SISO configuration achieved approximately 37 bps/Hz. Increasing the number of antennas therefore increased the communication channel capacity. Figure 11B shows that, at an SNR of 20 dB, the PDP was close to 1.00 under the 4T4R configuration, approximately 0.98 under the 2T2R configuration, and approximately 0.98 under the SISO configuration. These results demonstrate improved communication and sensing performance under multi-antenna configurations compared with the SISO reference benchmark. The SISO configuration in Figure 11 was included only as the reference benchmark. The proposed OFDM-ISAC-P model was formulated for multi-antenna systems, whereas the 2T2R and 4T4R configurations were used to evaluate the performance gains obtained through antenna scaling under the same LoS-dominant channel assumption.
Finally, the effectiveness of the OFDM-ISAC-P model was evaluated under different system parameter configurations by varying the number of subcarriers (64, 128, and 256). The total bandwidth was fixed at 20 MHz, while the subcarrier spacing was adjusted inversely according to the number of subcarriers. The antenna configuration was 2T2R, and the LoS channel model was adopted. Communication channel capacity and PDP obtained under different SNRs (0, 10, and 20 dB) were compared between the proposed method and equal power allocation. The corresponding results are summarized in Table 3.
| Method | Number of subcarriers | Channel capacity (bps/Hz) | Detection probability | ||||
| SNR = 0 dB | SNR = 10 dB | SNR = 20 dB | SNR = 0 dB | SNR = 10 dB | SNR = 20 dB | ||
| Equal power allocation | 64 | 0.98 | 2.35 | 4.71 | 0.37 | 0.72 | 0.89 |
| 128 | 1.32 | 3.11 | 6.28 | 0.42 | 0.76 | 0.92 | |
| 256 | 1.75 | 4.02 | 8.15 | 0.46 | 0.8 | 0.94 | |
| Proposed OFDM-ISAC-P strategy | 64 | 1.53 | 3.89 | 7.62 | 0.52 | 0.88 | 0.98 |
| 128 | 2.15 | 5.23 | 10.15 | 0.58 | 0.91 | 0.99 | |
| 256 | 2.87 | 6.71 | 13.28 | 0.63 | 0.94 | 0.99 | |
Table 3: Comparison of communication channel capacity and target detection probability for equal power allocation and the proposed power allocation strategy under different signal-to-noise ratios (SNRs) and numbers of OFDM subcarriers. Communication channel capacity is reported in bps/Hz, and target detection probability is reported as a probability (0–1).
As shown in Table 3, increasing the number of subcarriers had a substantial effect on system performance. Under the 256-subcarrier configuration, the proposed method achieved a communication channel capacity of 13.28 bps/Hz at an SNR of 20 dB, representing a 74.3% increase compared with the 64-subcarrier configuration, whereas the PDP remained comparable, indicating that increasing the number of subcarriers improved communication performance without substantially reducing sensing performance. Under the same number of subcarriers, the proposed method consistently outperformed equal power allocation. For example, at 128 subcarriers and an SNR of 10 dB, the communication channel capacity increased by 68.2% and the PDP increased by 19.7% compared with equal power allocation, demonstrating the effectiveness of the proposed power allocation strategy under different system parameter configurations. Even under the low-SNR condition of 0 dB with 64 subcarriers, the communication channel capacity remained 56.1% higher than that achieved using equal power allocation, indicating that the proposed model effectively improves system performance under different subcarrier configurations while supporting a range of spectrum allocation requirements.
Practical analysis of the intelligent transportation vehicle-road collaboration scenario
In highway vehicle-road collaboration, the Roadside Unit (RSU) simultaneously performs two primary tasks. The first is transmitting vehicle-to-everything (V2X) data to vehicles traveling at high speeds (100–120 km/h), including real-time road conditions, temporary speed limits, and emergency braking warnings. The second is detecting malfunctioning vehicles, road debris, and other obstacles within a range of 1–2 km using radar sensing. Under these conditions, high vehicle speeds introduce substantial Doppler frequency shifts in the communication channel. Consequently, communication channel capacity and PDP must be balanced under the available transmission power. The simulation adopts a 4T4R antenna configuration, 256 subcarriers, a bandwidth of 20 MHz, and a LoS-dominant channel model, consistent with the assumptions described in the Methods section. This scenario evaluates the anti-interference capability and long-range sensing performance of the proposed method under high-speed vehicle movement. Communication channel capacity and PDP were evaluated at SNRs of 0 dB and 20 dB. The corresponding results are presented in Figure 12.
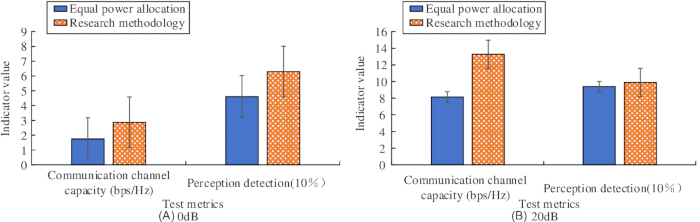
Figure 12. Comparison of communication and sensing performance between equal power allocation and the proposed method under different signal-to-noise ratios (SNRs). (A) Results obtained at 0 dB. (B) Results obtained at 20 dB. Bars represent communication channel capacity and target detection probability for the two power-allocation methods. Error bars represent the standard deviation (SD) calculated from repeated independent simulations. Please click here to view a larger version of this figure.
As shown in Figure 12A, under the low-SNR condition of 0 dB (representing adverse propagation conditions such as rain or dense fog), the proposed method achieved a communication channel capacity of 2.90 bps/Hz, representing a 61.1% increase compared with equal power allocation (1.80 bps/Hz). The PDP increased from 46% to 63%, corresponding to an absolute improvement of 17 percentage points and a relative improvement of 37.0% using 46% as the denominator. Figure 12B shows that, at an SNR of 20 dB, the proposed method achieved a communication channel capacity of 13.30 bps/Hz, representing a 60.2% increase compared with equal power allocation (8.30 bps/Hz). The PDP increased from 94% to 98%, corresponding to an absolute improvement of 4 percentage points and a relative improvement of 4.3%. These simulation results demonstrate improved communication and sensing performance under the evaluated highway scenario. The proposed power allocation strategy maintained stable communication channel capacity and target detection probability under the evaluated multi-antenna simulation conditions, indicating its potential applicability to OFDM-based integrated sensing and communication systems.
Different from the highway scenario shown in Figure 12, Table 4 presents results for an urban intersection vehicle-road-human collaboration scenario. This scenario considers building obstruction, frequent vehicle stopping and starting, pedestrian crossings, and mixed traffic involving electric vehicles. Accordingly, the SNR values were set to 5, 15, and 25 dB rather than 0 and 20 dB. The corresponding simulation results are summarized in Table 4.
| Signal-to-noise ratio (dB) | Method | Channel capacity (bps/Hz) | Detection probability (%) | Communication delay (ms) |
| 5 | Equal power allocation | 1.32 | 42 | 3.8 |
| Proposed OFDM-ISAC-P strategy | 2.15 | 58 | 2.5 | |
| 15 | Equal power allocation | 3.11 | 76 | 2.5 |
| Proposed OFDM-ISAC-P strategy | 5.23 | 91 | 1.8 | |
| 25 | Equal power allocation | 6.28 | 92 | 1.9 |
| Proposed OFDM-ISAC-P strategy | 10.15 | 99 | 1.2 |
Table 4: Comparison of communication and sensing performance between equal power allocation and the proposed power allocation strategy under different signal-to-noise ratios (SNRs). The evaluated performance metrics include communication channel capacity (bps/Hz), target detection probability (%), and communication delay (ms).
As shown in Table 4, the proposed method achieved improved communication and sensing performance under the simulated urban intersection scenario. At an SNR of 15 dB, the communication channel capacity reached 5.23 bps/Hz, representing a 68.2% increase compared with equal power allocation (3.11 bps/Hz). The corresponding communication delay was 1.8 ms, representing a 28.0% reduction compared with equal power allocation (2.5 ms). The target detection probability (PDP) reached 91%, representing a 19.7% relative improvement compared with equal power allocation (76%). At an SNR of 25 dB, the proposed method achieved a communication channel capacity of 10.15 bps/Hz, representing a 61.6% increase compared with equal power allocation (6.28 bps/Hz). The communication delay decreased to 1.2 ms, and the PDP reached 99%. Even under the lower SNR condition of 5 dB, the communication channel capacity remained 2.15 bps/Hz, representing a 62.9% increase compared with equal power allocation, while the communication delay remained 2.5 ms. These simulation results demonstrate that the proposed power allocation strategy provides efficient communication-sensing resource allocation and improved target detection performance under the evaluated urban intersection scenario, supporting its potential application in vehicle-road-pedestrian collaborative perception systems.
To evaluate the computational overhead of the proposed method, the average optimization time of different power allocation schemes was compared under the same simulation environment. Equal power allocation exhibited the lowest computational cost because it did not require iterative optimization. The WA achieved rapid optimization for the communication-oriented objective but did not directly optimize the PDP. The conventional BOA required more iterations and longer optimization time. In the computational-overhead comparison summarized in Table 5, incorporating the DSP and DVGM strategies reduced the average convergence iterations of the improved BOA to 98, thereby decreasing the optimization time while maintaining improved communication-sensing performance. The corresponding results are presented in Table 5.
| Power allocation scheme | Main optimization objective | Computational complexity | Average convergence iterations | Average optimization time | Real-time applicability |
| Equal power allocation | None | O(N) | Not applicable | 0.03 ms | High, but poor performance balance. |
| WA | Communication capacity | O(N log N) | Not applicable | 0.18 ms | High, but sensing performance is not jointly optimized. |
| Traditional BOA | Joint communication-sensing objective | O(PID) | 235 | 12.6 ms | Moderate. |
| Improved BOA | Normalized joint communication-sensing objective | O(PID) | 98 | 5.4 ms | Suitable for slow-timescale or frame-level power updates. |
Table 5: Comparison of computational characteristics of different power allocation schemes. The table compares equal power allocation, Water-Filling Allocation (WA), the traditional Butterfly Optimization Algorithm (BOA), and the Improved Butterfly Optimization Algorithm (IBOA) with respect to optimization objective, computational complexity, average convergence iterations, average optimization time, and real-time applicability. Here, N denotes the number of OFDM subcarriers. The computational complexity of the BOA-based methods is expressed as O(PID), where P represents the population size, I denotes the maximum number of iterations, and D represents the optimization problem dimension.
As shown in Table 5, equal power allocation and the WA exhibited the lowest computational cost but optimized only limited performance objectives. Equal power allocation did not account for channel variations, whereas the WA primarily optimized communication channel capacity without jointly optimizing PDP. The improved BOA required greater computational effort because it iteratively optimized the power allocation vector. However, compared with the conventional BOA, the average convergence iterations decreased from 235 to 98, and the average optimization time decreased from 12.6 ms to 5.4 ms. These results indicate that the proposed improvements reduced the computational burden of the BOA while maintaining improved optimization performance. For real-time sixth-generation (6G) communication applications, the proposed method is more suitable for frame-level, slot-group-level, or scenario-level power allocation than for symbol-level instantaneous adaptation. Warm-start initialization or lookup-table-assisted implementation may further reduce decision latency during future implementation.
Data Availability:
The data supporting the findings of this study are provided with the manuscript as supplementary materials. The OFDM-ISAC simulation parameter configuration is provided in Supplementary Table 1, and the numerical source data underlying Figures 7–12 are provided in Supplementary Data File 1.
Supplementary Table 1. OFDM-based Integrated Sensing and Communication (OFDM-ISAC) simulation parameter configuration. This table summarizes the simulation parameters used to configure the OFDM-ISAC system, including waveform parameters, channel characteristics, user and target settings, antenna configuration, and optimization parameters used throughout the numerical simulations.Please click here to download this file.
Supplementary Data File 1. Numerical source data underlying Figures 7–12. The workbook contains separate worksheets providing the numerical data corresponding to Figures 7–12, including convergence and final fitness values for the optimization algorithms in Figures 7 and 8, communication channel capacity and target detection probability data for Figures 9–12, and the corresponding signal-to-noise ratio, antenna-configuration, and communication-weighting conditions used to generate the final figures.Please click here to download this file.
Discussion
The proposed OFDM-ISAC-P model addresses the need to balance communication channel capacity and PDP under a shared transmission-power constraint. Existing OFDM-based ISAC studies have examined joint subcarrier and power allocation, shared-waveform design, dynamic power allocation, and communication-sensing trade-offs1,2,7,8,9,10,11,28,29,30. In the present study, the communication and sensing objectives are normalized to reduce the influence of their dimensional differences, and tunable weighting factors are used to represent different communication-sensing priorities. The improved BOA, incorporating DSP and DVGM, is then applied to solve the resulting nonconvex power allocation problem. The present evaluation assesses the combined improved BOA incorporating both DSP and DVGM; the individual contributions of these two mechanisms were not separately evaluated through an ablation analysis and should be investigated in future work. The simulation results indicate that this framework provides a more balanced communication-sensing operating point than equal power allocation and communication-oriented WA allocation under the evaluated conditions.
This approach may advance OFDM-based ISAC research by providing a unified simulation framework for evaluating communication capacity, PDP, antenna scaling, subcarrier configuration, weighting-factor selection, and computational overhead. Related research has shown the importance of adaptive resource allocation, waveform optimization, and power allocation in ISAC systems3,4,5,6,7,8,9,10,11,28,29,30. The present results extend this direction by combining normalized multi-objective optimization with an improved population-based solver. The evaluated weighting factors approximately describe a Pareto trade-off in which increasing the communication weight improves communication capacity while reducing PDP, and decreasing the communication weight produces the opposite effect. This framework therefore provides a methodological basis for studying communication-sensing trade-offs under different system priorities, including intelligent transportation and vehicular-network scenarios16,17,26,28.
Several limitations remain. First, the validation is based entirely on mathematical modeling and numerical simulations with predefined channel parameters, antenna configurations, Doppler shifts, signal-to-noise ratios, and noise levels. Therefore, the reported gains should be interpreted as simulation-level improvements rather than direct evidence of field-deployment performance. Second, the LoS-dominant channel assumption is suitable for the evaluated highway vehicle-road collaboration scenario but may be idealized for dense urban intersections, where NLoS propagation, multipath reflection, blockage, and rapid channel variation are more prominent19,20,21,26. These propagation effects may cause stronger fluctuations in communication channel gain and sensing echo strength, thereby reducing the stability of the optimized power allocation. Future studies should therefore extend the framework to hybrid LoS/NLoS channels incorporating multipath clusters, random blockage, time-varying channel-state information, and imperfect channel estimation.
The current model also does not explicitly account for multi-user interference, inter-vehicle interference, joint scheduling among multiple receivers, or simultaneous sensing of multiple targets. In practical sixth-generation ISAC networks, the optimization objective may need to be extended from single-link communication capacity and single-PDP to multi-user and multi-target formulations that include fairness, interference, beamforming, and scheduling constraints11,20,22,23,24,30. For sensing, concentrating transmission power on the best subchannel may be appropriate for detecting a single point target, but it may be insufficient for radar imaging, electromagnetic-property sensing, or multi-target tracking, where power may need to be distributed across target-sensitive subcarriers, beams, or spatial directions22,23,24,25. Alternative formulations could therefore optimize weighted detection probability, minimum PDP, estimation accuracy, or joint detection-and-tracking performance. Convex approximation, beamforming optimization, cooperative-network methods, and learning-based resource allocation represent other possible approaches for investigating the same hypothesis2,8,11,16,17,23,24,30.
The study does not include hardware prototyping, measured vehicle-mounted channel data, field experiments, or real-time embedded implementation. Although the improved BOA reduced the average convergence iterations and optimization time compared with the traditional BOA, it remained more computationally demanding than equal power allocation and WA. The proposed method is therefore more suitable for scenario-level, frame-level, or slot-group-level power allocation than for symbol-level instantaneous adjustment under the present implementation. Future work should evaluate warm-start initialization, lookup-table assistance, parallel computing, and lightweight learning-based approximation to reduce decision latency. Hardware-in-the-loop testing, measured LoS/NLoS vehicle-road channels, and real-time implementation would also be required to determine whether the observed simulation-level improvements remain stable under practical channel uncertainty and computational constraints. Accordingly, the intelligent transportation examples should be interpreted as simulation-based feasibility analyses rather than verified engineering deployments.
In conclusion, the increasing demand for wireless communication and radar sensing has intensified the conflict between limited spectrum resources and expanding service requirements, making ISAC an important approach to improving resource utilization12,13,14,15,19,26. This study constructed the OFDM-ISAC-P model, obtained communication- and sensing-oriented reference solutions through WA and generalized maximum likelihood ratio detection, and introduced normalized weighting to reduce dimensional inconsistencies between the two objectives. The improved BOA was then used to solve the resulting power allocation model and balance communication and sensing performance. In the computational-overhead comparison summarized in Table 5, the average convergence iterations of the improved BOA were reduced by 58.3% compared with the traditional BOA. Under the evaluated 4T4R configuration at 20 dB, the OFDM-ISAC-P model achieved a communication channel capacity of approximately 60 bps/Hz and a PDP close to 1. Under the evaluated LoS-dominant multi-antenna scenarios, the proposed method effectively improved communication channel capacity and target detection probability, thereby achieving a balanced trade-off between communication and sensing performance. However, the study remains limited to LoS-dominant simulation scenarios and does not incorporate multi-user interference, NLoS channel modeling, or real-time power adjustment under rapidly varying channels. Future research should extend the model to multi-user OFDM-ISAC systems, introduce NLoS and measured-channel models, process multi-target sensing echoes, and investigate adaptive power allocation using deep learning and other low-complexity methods to improve responsiveness in dynamic environments and support further practical evaluation of ISAC technology16,17,21,26,28.
Disclosures
Conflict of Interest:
The authors declare no conflicts of interest.
Acknowledgements
The authors gratefully acknowledge financial support from the Natural Science Research Project of the Liaoning Provincial Department of Education, China (Grant No. JYTMS20230009), the Dalian Technology Research and Development Project, China (Grant No. 2024JB11GX001), and the Disciplinary Team Cultivation Project of Dalian University of Science and Technology (Grant No. KYXK2025001).
Materials
| Name | Company | Catalog Number | Comments |
|---|---|---|---|
| CVXPY | CVXPY Developers | Version 1.4 | Convex optimization package used to support verification of the power allocation model. |
| Improved BOA optimization program | Authors | Not applicable | Custom implementation of the Improved Butterfly Optimization Algorithm (IBOA) used to solve the OFDM-ISAC-P power allocation model using dynamic switching probability and dynamic variance Gaussian mutation. |
| ISAC simulation benchmark dataset | Authors | Not applicable | Simulation benchmark generated by the authors and used to evaluate the proposed power allocation method under different signal-to-noise ratios, antenna configurations, and numbers of subcarriers. |
| MATLAB | The MathWorks, Inc. | R2023b | Platform used for numerical simulation and result visualization. |
| NumPy | NumPy Developers | Version 1.26 | Numerical computing library used for array operations, random initialization, and statistical analysis. |
| OFDM-ISAC simulation program | Authors | Not applicable | Custom simulation code used to construct the OFDM-ISAC channel model, calculate communication channel capacity, and evaluate target detection probability. |
| PyTorch | PyTorch Foundation | Version 2.1 | Tensor computation framework used for numerical modeling and matrix operations. |
| Python programming environment | Python Software Foundation | Python 3.10 | Programming language used for algorithm implementation and numerical computation. |
| Ubuntu operating system | Canonical Ltd. | Ubuntu 22.04 LTS | Operating system used to implement the OFDM-ISAC power allocation simulations. |
References
- Li Y, Wei Z, Feng Z. Joint subcarrier and power allocation for uplink integrated sensing and communication system. IEEE Sens J. 2023;23(24):31072-31081. doi:10.1109/JSEN.2023.3330936.
- Cao X, Tang L, Shen F. Robust OFDM shared waveform design and resource allocation for the integrated sensing and communication system. In: 2023 IEEE Wireless Communications and Networking Conference (WCNC). IEEE; 2023:13-24. doi:10.1109/WCNC55385.2023.10118730.
- Wen Y, Yang F, Song J. Adaptive resource allocation in ADO-OFDM for optical wireless integrated sensing and communication. In: GLOBECOM 2024 IEEE Global Communications Conference. IEEE; 2024:28-39. doi:10.1109/GLOBECOM52923.2024.10901628.
- Sümer AS, Memişoğlu E, Arslan H. A novel pilot allocation technique for uplink OFDMA in ISAC systems. IEEE Wirel Commun Lett. 2025;14(8):2561-2565. doi:10.1109/LWC.2025.3575711.
- Hawkins H, Xu C, Yang LL. IM-OFDM ISAC outperforms OFDM ISAC by combining multiple sensing observations. IEEE Open J Veh Technol. 2024;5(1):312-329. doi:10.1109/OJVT.2024.3366772.
- Zhu W, Han Y, Wang L. Pilot optimization for OFDM-based ISAC signal in emergency IoT networks. IEEE Internet Things J. 2023;11(18):29600-29614. doi:10.1109/JIOT.2023.3314057.
- Wen Y, Yang F, Song J. Power allocation for OFDM-based free space optical integrated sensing and communication. In: ICC 2024 IEEE International Conference on Communications. IEEE; 2024:2408-2413. doi:10.1109/ICC51166.2024.10622583.
- Wang X, Han S. Optimization of power allocation for OFDM-based ISAC systems. In: GLOBECOM 2024 IEEE Global Communications Conference. IEEE; 2024:5387-5392. doi:10.1109/GLOBECOM52923.2024.10901655.
- Al Khansa A, Madhusudan G, Larue G. Dynamic power allocation in OFDM ISAC for time of arrival estimation. In: 2024 IEEE Conference on Standards for Communications and Networking (CSCN). IEEE; 2024:249-254. doi:10.1109/CSCN63874.2024.10849719.
- He X. Power allocation scheme for OFDM-ISAC system. In: 2025 5th International Conference on Sensors and Information Technology. IEEE; 2025:136-140. doi:10.1109/ICSI64877.2025.11009420.
- Liao B, Ngo HQ, Matthaiou M. Power allocation for massive MIMO-ISAC systems. IEEE Trans Wirel Commun. 2024;23(10):14232-14248. doi:10.1109/TWC.2024.3410385.
- Chen Y, et al. Integrated sensing, communication, and powering: Toward multi-functional 6G wireless networks. IEEE Commun Mag. 2025;63(8):146-153. doi:10.1109/MCOM.006.2400013.
- Singh S, Samal U. Integrated sensing and communication in next-generation wireless networks: Insights and trends. Int J Commun Syst. 2025;38(5):70014-70018. doi:10.1002/dac.70014.
- Liu J, et al. OFDM-structure based waveform designs for integrated sensing and communication. Sci China Inf Sci. 2025;68(5):150306-150309. doi:10.1007/s11432-024-4373-7.
- Ni Y, et al. An integrated sensing and communications system based on affine frequency division multiplexing. IEEE Trans Wirel Commun. 2025;24(5):3763-3779. doi:10.1109/TWC.2025.3532993.
- Li C, et al. Improved TD3-based resource allocation optimization for latency-sensitive tasks in ISAC-aided VEC. ACM Trans Sens Netw. 2025;21(6):1-27. doi:10.1145/3767332.
- Li C, Long K, Yang M. D3QN-TD3-based user association and resource allocation in ISAC-aided vehicular edge computing. ACM Trans Sens Netw. 2025;21(4):1-31. doi:10.1145/3744711.
- Ahmed MF, Rahman A. OFDM-based optical integrated sensing and communication framework using embedded pilot subcarriers. Opt Contin. 2026;5(6):1706-1720. doi:10.1364/OPTCON.595843.
- Luo HL, et al. Integrated sensing and communications framework for 6G networks. IEEE Wirel Commun. 2025;32(6):102-109. doi:10.1109/MWC.2025.3599658.
- Nabil Y, ElSawy H, Hassanein HS. System-level analysis of dual-mode networked sensing: ISAC integration and coordination gains. IEEE Trans Wirel Commun. 2025;25(4):7970-7987. doi:10.1109/TWC.2025.3634682.
- Feng XX, Wu W, Ling M, Zheng H. Off-grid parameter estimation for OFDM-based ISAC systems with incomplete data and demodulation errors. China Commun. 2026;23(3):199-216. doi:10.23919/JCC.fa.2025-0172.202603.
- Jiang YH, Gao F, Shi J, Tie JC. Electromagnetic property sensing in ISAC with multiple base stations: Algorithm, pilot design, and performance analysis. IEEE Trans Wirel Commun. 2025;24(4):3400-3416. doi:10.1109/TWC.2025.3530946.
- Zhang Y, et al. Backscatter device-aided integrated sensing and communication: A Pareto optimization framework. IEEE Trans Wirel Commun. 2026;25(2):17958-17974. doi:10.1109/TWC.2026.3698666.
- Zhang X, Huang B, Alouini MS. Design of 3-D beamforming and deployment strategies for ISAC-based HAPS systems. IEEE Trans Wirel Commun. 2026;25(2):13228-13242. doi:10.1109/TWC.2026.3670213.
- Uluocak S, Kartal M. A low-complexity target Swerling type estimation method for next-generation OFDM-based ISAC systems. IEEE Access. 2025;13(5):192542-192554. doi:10.1109/ACCESS.2025.3630105.
- Du Z, et al. Toward ISAC-empowered vehicular networks: Framework, advances, and opportunities. IEEE Wirel Commun. 2025;32(2):222-229. doi:10.1109/MWC.002.2300496.
- Hasanvand M, Nooshyar M, Moharamkhani E, Selyari A. Machine learning methodology for identifying vehicles using image processing. AIA. 2023;1(3):170-178. doi:10.47852/bonviewAIA3202833.
- Yang H, Wang L, Feng Z. Dynamic power allocation for integrated sensing and communication-enabled vehicular networks. IEEE Trans Wirel Commun. 2024;23(9):12313-12330. doi:10.1109/TWC.2024.3391354.
- Wen Y, Yang F, Song J. Free space optical integrated sensing and communication based on DCO-OFDM: Performance metrics and resource allocation. IEEE Internet Things J. 2024;12(2):2158-2173. doi:10.1109/JIOT.2024.3469279.
- Liu M, Yang M, Li H. Performance analysis and power allocation for cooperative ISAC networks. IEEE Internet Things J. 2022;10(7):6336-6351. doi:10.1109/JIOT.2022.3225281.