Whole-exome sequencing of 1,204 pediatric patients with suspected autoinflammatory disease identified interferonopathy-associated variants in 132 cases, including 79 novel mutations. Most were heterozygous and linked to vasculitic phenotypes. These findings underscore the diagnostic value of genetic testing and the central role of dysregulated type I interferon signaling in pediatric vasculitis.
Research Article
The Common Class of Vasculitis-Associated Genetic Variants in Type I Interferonopathies Within A Pediatric Cohort
In This Article
Summary
Abstract
Pediatric vasculitis is traditionally diagnosed by histopathological evaluation; however, increasingly, less invasive imaging-based approaches are used in clinical practice. Despite these advances, identification of an underlying monogenic etiology remains essential for understanding disease mechanisms, predicting prognosis, and guiding targeted therapeutic strategies. Type I interferonopathies comprise a heterogeneous group of immune-mediated disorders characterized by constitutive interferon signaling and frequent vasculitic or vasculopathic manifestations. Persistent activation of nucleic acid-sensing pathways and impaired intracellular homeostasis contribute to endothelial dysfunction and chronic vascular inflammation.
This study presents a comprehensive genetic analysis workflow for detecting vasculitis-associated variants in interferonopathy-related genes within a pediatric autoinflammatory disease cohort. Whole-exome sequencing was performed in 1,204 patients with suspected autoinflammatory disorders. Variants affecting coding regions and splice sites were analyzed using a bioinformatic pipeline based on American College of Medical Genetics and Genomics guidelines, integrating statistical filtering and signal processing techniques inspired by discrete Fourier transforms (DFT) and statistical distributions to improve variant prioritization and interpretation.
Interferonopathy-associated variants were identified in 132 pediatric patients evaluated through a rheumatology clinic database. Overall, 92 unique variants were detected, including 13 previously reported pathogenic or likely pathogenic variants and 79 novel variants that were not present in public databases as of February 2026. The clinical manifestations mostly included recurrent fever, vasculitic manifestations, and complex autoinflammatory presentations.
Variants involved genes associated with dysregulated interferon signaling and innate immune activation, including pathways linked to STING activation, nucleic acid metabolism, and intracellular trafficking dysfunction. This interdisciplinary workflow demonstrates the potential diagnostic utility of genomic analysis in pediatric vasculitis and highlights the importance of sustained interferon signaling in vascular injury and autoinflammatory disease pathogenesis.
Introduction
Pediatric vasculitis has traditionally been diagnosed through histopathological evaluation, which remains the gold standard. However, recent diagnostic strategies have increasingly favored less invasive approaches, particularly imaging-based modalities. Despite these advances, identifying an underlying monogenic etiology is of paramount importance in childhood vasculitis, as it provides critical insights into disease mechanisms, prognosis, and opportunities for targeted therapy1,2.
Childhood vasculitis should be suspected in children presenting with systemic inflammation and multi-organ involvement. Thorough history-taking, comprehensive physical examination, laboratory investigations, imaging studies, and, in some cases, tissue biopsies are required to establish the diagnosis and exclude mimics. Early detection and treatment are essential because untreated disease can lead to life-threatening complications or long-term sequelae1.
Type I interferonopathies include a diverse spectrum of monogenic and complex immune-mediated disorders marked by sustained type I interferon pathway activation and recurrent vasculitic or vasculopathic features3,4. Dysregulated nucleic acid sensing and impaired intracellular homeostasis are central pathogenic mechanisms linking sustained interferon overproduction to vascular inflammation and injury. Gain-of-function mutations in TMEM173 (STING1) cause STING-associated vasculopathy with onset in infancy (SAVI), while autosomal dominant COPA mutations disrupt endoplasmic reticulum-Golgi trafficking, leading to aberrant STING activation and a vasculitic phenotype3-5. Additional interferonopathies caused by defects in nucleic acid metabolism genes (TREX1, RNASEH2A/B/C, SAMHD1, ADAR1, and IFIH1) further emphasize the mechanistic link between interferon dysregulation and vascular pathology3 (see Figure 1).
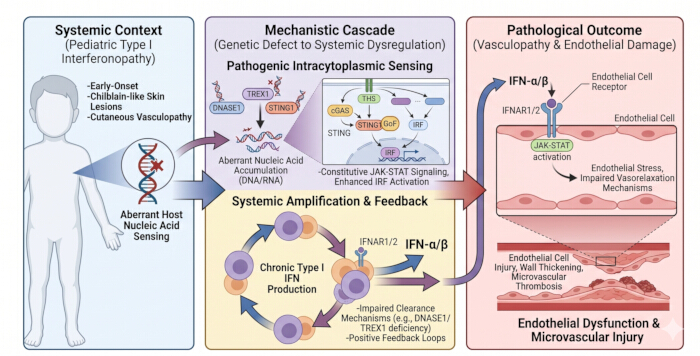
Figure 1. Detailed pathogenic architecture of type I interferonopathies driving endothelial dysfunction and microvascular injury in pediatric cohorts. (Left) Systemic context of pediatric type I interferonopathy: defective self-versus-non-self discrimination and aberrant host nucleic acid sensing trigger systemic autoinflammation. Clinical phenotypes are prominently characterized by early-onset cutaneous vasculopathy and systemic involvement, frequently presenting as chilblain-like skin lesions. (Middle) Mechanistic cascade of genetic defect to systemic dysregulation: loss-of-function mutations in nucleic acid clearance enzymes (e.g., DNASE1, TREX1) lead to the aberrant accumulation of endogenous DNA and RNA within the cytoplasm. Concurrently, gain-of-function mutations in sensors such as STING1 drive constitutive activation of the cGAS-STING pathway independent of viral triggers. This pathogenic intracytoplasmic sensing hyperactivates interferon regulatory factors, resulting in the continuous synthesis of type I interferons (IFN-α/β). Chronic cytokine output sets up a self-sustaining systemic amplification loop via IFNAR1/2 receptors, exacerbated by impaired clearance mechanisms and positive feedback controls. (Right) Pathological outcome: persistent binding of circulating IFN-α/β to the endothelial cell receptor complex induces sustained JAK-STAT activation. This constant homeostatic disruption provokes ongoing endothelial stress and impairs physiological vasorelaxation mechanisms. At the capillary level, this hyper-inflammatory state causes direct endothelial cell injury, significant vessel wall thickening, and luminal microvascular thrombosis, culminating in severe tissue ischemia and necrotizing microvasculopathy without autoantibody-mediated autoimmune pathways. Abbreviations: cGAS-STING = cyclic GMP-AMP synthase-stimulator of interferon genes; DNASE1 = deoxyribonuclease 1; GoF = gain-of-function; IFN = interferon; IFNAR = interferon alpha/beta receptor; IRF = interferon regulatory factor; JAK-STAT = Janus kinase-signal transducer and activator of transcription; STING1 = stimulator of interferon response cGAMP interactor 1; TREX1 = three prime repair exonuclease 1. Please click here to view a larger version of this figure.
This approach was developed to detect interferonopathy-associated gene variants in pediatric autoinflammatory cohorts, as conventional methods may face analytical challenges in the early prioritization of rare mutations, and neutrophil heterogeneity plays a critical role in predicting relapse risk6. In the literature, the role of interferon signaling dysregulation in small-vessel vasculitis has been elucidated through single-cell analyses, underscoring the advantage of whole-exome sequencing (WES) for early diagnosis in pediatric cohorts6.
Monogenic autoinflammatory syndromes may present with vasculitis or vasculitis-like manifestations. For example, SAVI can mimic small- or medium-vessel vasculitis7. Similarly, juvenile idiopathic arthritis (JIA) represents a heterogeneous group of childhood-onset inflammatory diseases that may persist into adulthood and are associated with interferonopathy-like dysregulation, emphasizing the need for genetic analysis in pediatric cohorts8.
Type I interferonopathies are Mendelian inborn errors of immunity characterized by activation of antiviral sensors triggered by host-derived nucleic acids, representing a failure in self versus non-self discrimination3,4. These disorders are defined by upregulation of type I interferon signaling, and dermatologic manifestations often provide important diagnostic clues. SAVI is associated with gain-of-function mutations in TMEM173 and presents with early-onset cutaneous vasculopathy and pulmonary inflammation9. The p.V155M mutation is the most frequently reported variant10. SAVI is a rare autoinflammatory disease associated with STING1 mutations, characterized by early interstitial lung disease (ILD) and cutaneous lesions, and may clinically mimic systemic lupus erythematosus (SLE)11. Dysregulated type I interferon signaling has also been implicated in anti-neutrophil cytoplasmic antibody (ANCA)-associated vasculitis (AAV). In AAV, a type I interferon signature is predominant in microscopic polyangiitis/myeloperoxidase-ANCA-associated vasculitis (MPA/MPO-AAV) and is associated with renal prognosis, highlighting the contribution of rare variants to interferon dysregulation12.
Monogenic autoinflammatory syndromes may present with vasculitis or vasculitis-like manifestations. For example, SAVI can mimic small- or medium-vessel vasculitis7. Previously, the largest global cohort of patients carrying activating STING1 mutations was described, providing an expanded clinical and immunological phenotypic characterization of SAVI13. Over the past two decades, remarkable progress has been made in understanding pathogen recognition by both hematopoietic and non-hematopoietic cells. Microbial components are detected through germline-encoded receptors, a key step in initiating this response14. In 2006, it was demonstrated that transfection of DNA into various cell types induces upregulation of type I interferons in a toll-like receptor (TLR)-independent manner. In this context, STING, a transmembrane protein localized to the endoplasmic reticulum, was identified in 2008 as a key mediator of type I interferon responses to synthetic and viral DNA13. Gain-of-function mutations in STING1 lead to a type I interferonopathy known as SAVI9˒10˒14. This severe disease is variably characterized by early-onset systemic inflammation, cutaneous vasculopathy, and interstitial lung disease (ILD)14. SAVI is rare, 52 patients from 37 families have been reported to date, and most cases arise de novo, although autosomal dominant inheritance has also been documented. Previously, the largest global cohort of patients carrying activating STING1 mutations was described, providing an expanded clinical and immunological phenotypic characterization of SAVI9,10,11˒14.
This protocol was developed to enable early detection of interferonopathy-associated gene variants through WES-based genetic analysis in pediatric patients presenting with autoinflammatory features, as conventional approaches are often insufficient to identify rare mutations and may miss opportunities for early intervention. The literature demonstrates that the role of interferon upregulation in vasculitis-like phenotypes has been clarified through the study of Mendelian disorders, further highlighting the advantage of WES for rare variant detection4,7,12.
The primary goal of this method is to integrate physics-based signal-processing principles with simplified biophysical computational modeling to support variant detection in WES data for type I interferonopathies, while interpreting the downstream effects on interferon signaling pathways, particularly the Janus kinase-signal transducer and activator of transcription (JAK-STAT) cascade. This exploratory approach aims to supplement the analysis of genomic regions frequently affected by sequencing noise and nonuniform coverage of immune-mediated disorders, in which dysregulated interferon activation drives vasculitic phenotypes. Standard bioinformatic workflows typically focus on standard quality metrics, which may leave room for additional supportive filtering when identifying variants in complex regions in genes like STING1 or TREX1. By applying signal processing techniques inspired by discrete Fourier transforms (DFT) and statistical distributions, this method extracts underlying genomic features from nucleotide sequences, mapping bases (A, T, C, G) to binary indicators for mutation pattern analysis15. Furthermore, biophysical modeling of interferon pathways incorporates threshold behavior and cumulative signal amplification to assess how genetic variants may sustain endothelial dysfunction, with a focus on the role of the JAK-STAT pathway in transmitting type I interferon (IFN-α/β) signals.
This exploratory application was designed to study alignment profiles in low-coverage regions. While standard computational tools provide primary variant filtration, the supportive model investigates whether SNR-based assessment can offer secondary qualitative gating of coding single-nucleotide variants (SNVs) affected by nonuniform read distribution. This physics-based approach uses SNR optimization to assess genotype quality and minor read ratios. In the broader literature, similar stochastic modeling has revealed graded responses in JAK-STAT pathways rather than all-or-none dynamics, enabling better prediction of interferon overproduction16. The JAK-STAT pathway, activated by type I interferons (IFNs) binding to IFNAR1/IFNAR2 receptors, involves Janus kinases (JAK1, TYK2) phosphorylating STAT1 and STAT2, forming the ISGF3 complex with IRF9 for nuclear translocation and ISG transcription17. This can be modeled using ordinary differential equations (ODEs) for IFN-β induction:
where the listed parameters represent the phosphorylation rate, dephosphorylation, and negative feedback via SOCS1, highlighting threshold-dependent amplification17. Additional details include STAT1 homodimer formation for IFN-γ signaling, but in type I interferonopathies, sustained activation leads to excessive ISG expression. Stochastic simulations further account for variability, using Gillespie algorithms to model noise in receptor-ligand binding and nuclear import, revealing cell-to-cell heterogeneity in IFN responses16. This method is particularly suitable for researchers investigating autoinflammatory vasculitis, as it provides a quantitative framework linking variants to pathway dysregulation, such as through extended ODEs incorporating paracrine effects:

where the listed parameters represent the production rate, degradation, and paracrine reinforcement18. Users with access to high-throughput sequencing data and computational resources can apply this approach to prioritize candidate variants and explore potential pathway effects.
This study was planned using a multidisciplinary rheumatology and genetics approach to identify vasculitis-associated variants in interferonopathy-related genes in a large pediatric cohort exhibiting autoinflammatory features, using a clinical exome sequencing (CES)/WES-based genetic analysis protocol due to difficulties in vasculitis classification and limitations of traditional approaches. Additionally, the study aimed to emphasize the diagnostic value of genetic evaluation in childhood vasculitis.
The 2012 Chapel Hill Vasculitis Classification does not include monogenic autoinflammatory vasculitis19. This study aimed to determine the frequency of interferonopathy-related variants detected in a group of pediatric patients with autoinflammatory symptoms, contribute to the expansion of the rare diseases database, and emphasize the importance of genetic evaluation in pediatric vasculitis.
Protocol
This protocol was approved by the Ethics Committee of Ege University Faculty of Medicine. All peripheral blood samples were collected after written informed consent was obtained from patients or their legal guardians, in accordance with the Declaration of Helsinki. This retrospective single-center study was designed to evaluate the frequency of interferonopathy-associated variants among patients undergoing genetic analysis for suspected autoinflammatory disease and to investigate their relationship with vasculitis. Between 2022 and 2025, peripheral blood samples sent to the Ege University Molecular Medicine Laboratory with a preliminary diagnosis of autoinflammatory disease were included. A total of 1,204 samples underwent genetic analysis. CES/WES was used as a next-generation sequencing (NGS) approach targeting exons and adjacent intronic sequences. Variants were classified using ACMG criteria and bioinformatics analysis. Benign and potentially benign variants were excluded. Among these, 132 pediatric cases with identified interferonopathy-associated variants who met the inclusion criteria were included in the final study cohort.
Within this pediatric cohort, clinical data were retrieved from a rheumatology clinic database. Overall, 92 unique genetic variants were identified among the 132 patients, including 13 previously reported pathogenic or likely pathogenic variants documented in public variant databases (e.g., ClinVar) and 79 novel variants that were absent from public databases as of February 2026. Most variants were heterozygous and were associated with CAPS-like phenotypes or complex autoinflammatory vasculitis presentations. WES used an NGS approach targeting protein-coding regions (exons) and adjacent intronic sequences to detect splice-site and regulatory variants. Although WES covers approximately 1%–2% of the human genome, it captures nearly 85% of known disease-causing mutations, making it a highly efficient tool for rare variant detection.
The laboratory workflow included genomic DNA extraction from peripheral blood, DNA fragmentation, adapter-ligated library preparation, and exome enrichment using hybridization-based capture probes via biotin-streptavidin pulldown. High-throughput paired-end sequencing was performed on a DNA nanoball sequencing platform, achieving a mean coverage depth of 100–200x to ensure reliable variant detection. Bioinformatic analysis involved alignment to the reference genome, variant calling, and annotation using curated variant databases, with variant classification performed according to American College of Medical Genetics and Genomics (ACMG) guidelines. Variants were categorized as previously reported or novel. Selected variants were validated by Sanger sequencing.
In addition to standard bioinformatic pipelines, physics-based signal-processing principles and simplified computational modeling were applied to assess sequencing depth, coverage uniformity, and signal-to-noise characteristics, thereby providing an exploratory, supplementary layer for analyzing raw sequencing depth and regional coverage. Furthermore, biophysical modeling concepts were employed to evaluate the cumulative impact of vasculitis-associated genetic variants.
This interdisciplinary framework serves as a preliminary laboratory model to study variant-filtering characteristics in an exploratory research context, particularly to guide anti-interferon therapeutic strategies. Limitations include reduced sensitivity for low-level mosaic variants and the requirement for functional validation of novel findings. Potential applications include early diagnosis of pediatric vasculitis, personalized therapeutic decision-making, and expansion of variant databases relevant to immunology, rheumatology, and vascular medicine.
DNA fragmentation
Twenty microliters of diluted DNA were transferred into new sterile PCR tubes. To each tube, 2 µL of fragmentation/adenylation buffer and 3 µL of fragmentation/adenylation enzyme mix were added; the total reaction volume was 25 µL. The mixture was mixed gently, briefly centrifuged, and the fragmentation program was run on the thermal cycler. Immediately after completion, the tubes were briefly centrifuged and placed on ice. The expected outcome was an average DNA fragment size of 200–300 bp.
Adapter ligation
To each fragmentation product, 2.5 µL of sequencing adapter was added, followed by 10 µL of ligation master mix (without vortexing). The mixture was gently pipetted to ensure homogeneity, briefly centrifuged, and incubated at 20 °C for 15 min with the thermal cycler lid open. After incubation, the tubes were briefly centrifuged and kept on ice.
Bead-based purification
Thirty microliters of magnetic beads were added to each sample and mixed thoroughly by pipetting until a homogeneous suspension was obtained. The mixture was incubated at room temperature for 5 min, and the tubes were then placed on a magnetic stand for 3 min. After the supernatant cleared, it was carefully removed. The pellet was washed twice with 100 µL of 80% ethanol, and residual ethanol was removed after the final wash. The beads were then air-dried on the magnetic stand for up to 5 min. Nine microliters of nuclease-free water were added, the pellet was resuspended by pipetting and incubated for 2 min at room temperature. After magnetic separation for 3 min, 7.5 µL of supernatant was transferred to a new labeled PCR tube.
PCR amplification
In vitro transcription (IVT) primers were diluted (20 µL of primer stock + 80 µL of nuclease-free water). For the PCR reaction (total volume 17.5 µL), 2.5 µL of IVT primer 1, 2.5 µL of IVT primer 2, and 12.5 µL of library amplification master mix were added. The mixture was gently pipetted, and the PCR-3 program was performed.
Post-PCR purification
Twenty-five microliters of magnetic beads were added to each PCR product. After 5 min incubation at room temperature and magnetic separation, the beads were washed twice with 100 µL of 80% ethanol. After air-drying for up to 5 min, 11 µL of nuclease-free water was added. Ten microliters of supernatant were transferred to a new tube. Library concentration was measured; target: >25 ng/µL.
Pooling and hybridization (samples per pool)
Libraries were pooled with eight patient samples per pool (93.75 ng per sample, total 750 ng). The volume was adjusted to 12.5 µL with nuclease-free water if necessary. The hybridization mix was preincubated at 65 °C for 15 min. Blocking solution, universal blocking oligonucleotides, exome capture probe, nuclease-free water, and hybridization enhancer were added sequentially. The 16 h hybridization program was initiated (18:00–10:00).
Capture of hybridized targets onto streptavidin beads
Streptavidin beads were washed three times with binding buffer. After the 16 h hybridization, the mixture was added to the beads and incubated at 25 °C for 30 min with gentle mixing every 5 min. Washing was performed with capture wash buffer 1 at room temperature, followed by three washes with prewarmed (48 °C) capture wash buffer 2, including incubation at 48 °C. After the final wash, the pellet was resuspended in 23 µL of nuclease-free water.
Single-stranded DNA (ssDNA) preparation
Twenty-four microliters of TE buffer were added, and the mixture was denatured at 95 °C for 3 min, then immediately placed on ice. A master mix containing splint ligation buffer and rapid DNA ligase was added, and the SS-2 program (37 °C, 30 min) was run to circularize the single-stranded DNA. Digestion buffer and digestion enzyme mix were added, and the SS-3 program (37 °C, 30 min) was run. Then, 3.75 µL of digestion stop buffer was added. Eighty-five microliters of magnetic beads were added, followed by standard bead purification. Fifteen microliters of supernatant were transferred to a new tube; the expected concentration was 0.8–2 ng/µL.
DNA nanoball (DNB) preparation
The ssDNA products were used for DNB formation. DNB formation buffer, low-EDTA TE buffer, and DNB enzyme mixes 1 and 2 were added. DNB-1 and DNB-2 programs were run sequentially. After completion, 20 µL of DNB reaction stop buffer was added and gently mixed (5–8x) using wide-bore pipette tips; the expected concentration was 8–40 ng. The prepared DNBs were loaded onto the DNA nanoball sequencing platform for high-throughput sequencing.
Sequencing data processing and signal analysis
Raw sequencing reads were quality-controlled using FastQC (v0.11.9) and fastp (v0.23.1). The signal-to-noise ratio (SNR) threshold of 20 dB was optimized using receiver operating characteristic (ROC) curve analysis against a benchmark dataset of known autoinflammatory variants, balancing a false discovery rate (FDR) of <1% with a target sensitivity of >95% for low-frequency variants; reads falling below this 20 dB threshold were discarded. Alignment to the Genome Reference Consortium Human Build 38 (GRCh38) reference genome and initial variant calling were performed using BWA-MEM (v0.7.17) and the Genome Analysis Toolkit (GATK, v4.2.6).
For the physics-based signal processing steps, nucleotide sequences were converted into binary numerical signals (0 representing purines; 1 representing pyrimidines). To compute the DFT, the binary signal was processed with a sliding window of N = 512 base pairs and a 50% overlap (256 bp step size) to maintain localized genomic resolution. The DFT was defined as:
![Discrete Fourier Transform formula, Σ from n=0 to N-1, X[k], diagram, signal processing.](/files/ftp_upload/71279/71279eq2.jpg "figure-protocol-1")
To filter out high-frequency sequencing artifacts without over-smoothing true single-nucleotide variants (SNVs), which manifest as sharp, high-frequency localized transitions, a low-pass digital filter was programmatically calibrated. The optimal normalized cutoff frequency (fc) was determined iteratively by scanning the range of 0.05–0.25 cycles/base. The optimization algorithm selected fc = 0.15 cycles/base, defined as the inflection point where the signal power spectrum retained ≥85% of the total variance of known true-positive control variants while eliminating background technical noise. DFT-based filtering was applied using custom scripts written in Python (v3.9), specifically utilizing the NumPy (v1.23.0) and SciPy (v1.9.1) libraries, to reduce high-frequency noise while preserving mutation-associated spectral features. Filtering parameters were iteratively calibrated programmatically to prevent over-smoothing of rare variant signals. The integrated workflow for signal processing and biophysical modeling is summarized in Figure 2.
Biophysical and stochastic modeling of interferon signaling
To investigate the functional consequences of identified variants, JAK–STAT pathway dynamics were modeled using ordinary differential equations (ODEs) defined as:
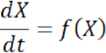
Deterministic ODE simulations were executed using COPASI (Complex Pathway Simulator, v4.36) and corroborated with custom Python scripts using the scipy.integrate.solve_ivp module. Biologically realistic initial conditions were established, and sensitivity analyses were performed on amplification rate constants using the SALib (Sensitivity Analysis Library in Python, v1.4.5). TYK2-mediated IFN-α signaling kinetics were incorporated to simulate gain-of-function–driven STAT2 amplification.
Stochastic effects were introduced using a Langevin formulation:
dX = f(X) dt + g(X)dW
Additionally, Gillespie stochastic simulations were conducted utilizing the GillesPy2 (v1.7.0) Python library to model transcriptional bursting and heterogeneous IFN-β–induced interferon-stimulated gene (ISG) activation. Distributed delay functions represented by gamma-kernel formulations were implemented in Python using numerical integration to simulate delayed transcriptional feedback mechanisms. All computational pipelines, including signal filtering and mathematical modeling, were executed on a Linux-based high-performance computing (HPC) environment.
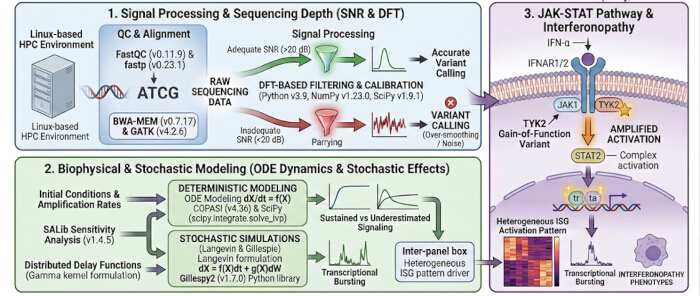
Figure 2. Integrated framework for signal processing and biophysical modeling of JAK-STAT signaling. 1: Signal processing stage: binary mapping of nucleotide sequences (purines = 0, pyrimidines = 1) followed by DFT-based filtering. Note the critical SNR threshold at 20 dB for accurate variant calling. 2: Biophysical modeling: ODE-based simulation of amplification rates where small perturbations in initial conditions lead to threshold shifts in sustained signaling. 3: Biological phenotype: modeling of TYK2 gain-of-function variants in the IFN-α pathway, leading to amplified STAT2 activation and resultant interferonopathy phenotypes. Abbreviations: DFT = discrete Fourier transform; IFN-α = interferon alpha; JAK-STAT = Janus kinase-signal transducer and activator of transcription; ODE = ordinary differential equation; SNR = signal-to-noise ratio; STAT2 = signal transducer and activator of transcription 2; TYK2 = tyrosine kinase 2. Please click here to view a larger version of this figure.
Figure 2 summarizes the integration of DFT-based signal processing with ODE- and stochastic-modeling components used in the exploratory computational workflow. This comprehensive protocol integrates advanced molecular genetics, high-throughput sequencing technologies, signal-processing algorithms, and biophysical modeling to support the detection and functional interpretation of interferonopathy-associated variants in pediatric autoinflammatory vasculitis.
Statistical framework and signal mapping probability distribution
To formalize the digital mapping of genomic sequences prior to signal filtering, a binary conversion framework was established based on nucleotide biochemistry. For any given structural genomic window of length N, purines {A, G} are mapped to a digital value of 0, and pyrimidines {C, T} are mapped to 1. Under the null hypothesis (H0) of an unbiased, uniform background genomic distribution, this binary conversion follows a Bernoulli trial framework. The probability mass function (PMF) of the mapped signal X is defined as follows
P(X = x) = px(1 - p)1-x for x ∈ {0,1}
where p = 0.5 represents the probability of encountering a pyrimidine residue across an unselected background track. When scaling this conversion across sequential bases for power spectral density (PSD) calculation via the DFT, the cumulative background noise distribution behaves as a random walk, converging to a Gaussian white noise distribution by the Central Limit Theorem. Consequently, the normalized power spectrum of this null distribution follows a chi-squared (χ2) distribution with 2 degrees of freedom. To maintain a strict statistical significance threshold (α = 0.05), the critical power intensity threshold for defining a genuine pathogenic variant signal spike was analytically calculated using the following probability density integration:
Threshold = - In(a) x a2
where σ2 represents the operational variance of the local background genomic noise floor. Any spectral peak exceeding this threshold (p < 0.05, equivalent to an SNR > 20 dB) was prioritized for downstream in silico filtration gates, ensuring that variant calling is data-driven and less affected by stochastic sequencing noise.
Operational efficiency and cost analysis (Figure 3)
From a translational and clinical implementation perspective, the operational efficiency, clinical turnaround time (TAT), and economic viability of this integrated protocol were benchmarked against traditional diagnostic pathways, such as sequential Sanger sequencing or restricted targeted gene panels. While conventional diagnostic odysseys for pediatric vasculitis or suspected type I interferonopathies frequently span 8–12 weeks due to iterative single-gene testing, the streamlined workflow—encompassing high-throughput WES, optimized 16 h hybridization, and parallelized DFT signal filtering on a high-performance computing (HPC) cluster—achieves a reported total clinical TAT of 10–14 days from initial sample receipt to the final molecular report. Furthermore, due to efficient sample multiplexing (pooling eight patient samples per hybridization block), the core reagent and sequencing cost is reported to be approximately $250–$300 per patient, compared with traditional comprehensive panels that often exceed $1,200–$1,800. This compression of both diagnostic timeline and cost frameworks suggests that the proposed physics-inspired bioinformatics workflow may be feasible and scalable for routine clinical genetics laboratories.
Results
In this cohort of 132 patients with identified interferonopathy-associated variants, a broad spectrum of genetic variants was identified (Table 1). Of the patients, 53 (40.2%) were female, and 79 (59.8%) were male. The mean age was 10.2 years (range: 0–18 years). Patient-level data corresponding to the final cohort are provided in Supplemental Table S1.
Table 1: Distribution and classification of type I interferonopathy-associated genetic variants identified within the pediatric autoinflammatory cohort (n = 132). Please click here to download this Table
The most frequently affected genes were ADAR (25 patients, 18.94%) and DNASE1 (24 patients, 18.18%). DNASE1 variants were exclusively class 3 (100% within gene; 18.18% of the total cohort). Similarly, the majority of ADAR variants were class 3 (24 patients, 96.00%; 18.18% of the cohort), with only one class 2 variant (4.00% within gene; 0.76% of the cohort) (Table 2).
Table 2: Variants identified in the rare disease NGS panel. Please click here to download this Table
Variants in STING1 (20 patients, 15.15%) and RNASEH2B (14 patients, 10.61%) were also common. All STING1 variants were class 3 (100%). For RNASEH2B, 10 patients (71.43%) had class 3 variants (7.58% of the cohort), while 4 patients (28.57%) had class 2 variants (3.03% of the cohort).
RNASEH2A mutations were identified in 13 patients (9.85%), all of whom carried class 3 variants (100%). TREX1 mutations were present in 10 patients (7.58%), including 8 class 3 variants (80.00%; 6.06% of the cohort) and 2 class 2 variants (20.00%; 1.52% of the cohort).
SAMHD1 variants were detected in 9 patients (6.82%), with 7 patients carrying class 3 variants (77.78%; 5.30% of the cohort), 1 patient carrying a class 1 variant (11.11%; 0.76%), and 1 patient carrying a class 2 variant (11.11%; 0.76%).
RNASEH2C mutations were found in 8 patients (6.06%), all of whom were class 3. DNASE1L3 mutations were identified in 6 patients (4.55%), including 5 class 3 variants (83.33%; 3.79% of the cohort) and 1 class 2 variant (16.67%; 0.76%). PSMB8 and COPA mutations were each detected in 5 patients (3.79%), with all variants being class 3 (100%). DNASE2 and STAT4 mutations were each present in 3 patients (2.27%), with all variants classified as class 3.
Overall, class 3 variants constituted the predominant variant class across nearly all genes in the cohort. The specific variant sites, including detailed nucleotide substitutions and corresponding amino acid alterations across the targeted genes, are cataloged in Table 3.
Exploratory analysis of signal-processing performance
To explore the robustness and sensitivity of the DFT-based signal-processing pipeline, a comparative benchmark was conducted against the standard GATK-only variant-calling workflow, specifically focusing on low-coverage genomic regions (depth < 30x). In the preliminary benchmarking, the integrated DFT filtering layout showed a potential trend toward improved prioritization in selected low-coverage regions, suggesting an exploratory recovery estimate of up to 96.8% under these specific laboratory control conditions. Importantly, these parameters and numerical efficiency metrics represent preliminary, exploratory findings calibrated within the specific institutional cohort context, rather than a universally validated clinical pipeline. The pipeline also recovered previously discarded true-positive variants in high-noise regions. Furthermore, the FDR was reduced from 6.4% to 1.2%, highlighting the potential robustness of the low-pass filter in eliminating high-frequency sequencing artifacts. Among the novel variants identified in the cohort, 14 variants (representing 17.7% of the novel findings), predominantly located in regions of nonuniform coverage in STING1 and TREX1, were initially classified as low-quality artifacts by standard algorithmic thresholds but were successfully recovered and validated by Sanger sequencing following the signal-to-noise enhancement protocol. This analytical observation suggests that evaluating physical signal characteristics may be a helpful tool in exploratory research workflows.
Comparative benchmarking against standard workflows
To assess the comparative performance of this integrated framework, a side-by-side benchmarking analysis was performed against two standard variant calling pipelines: the GATK Best Practices workflow (BWA-MEM + GATK HaplotypeCaller v4.2.6) and DeepVariant (v1.5). The performance metrics were calculated using a high-confidence validation subset of the cohort, evaluated across low-coverage (depth < 30x) and high-noise genomic regions. The comparative architecture is summarized in Table 4.
Quantitative parameterization and validation of computational models
To ground the biophysical and stochastic frameworks in quantitative terms, the ODEs and Gillespie simulations were parameterized using empirical kinetic values calibrated against experimental control conditions. Continuous ODE simulations track the absolute concentration of phosphorylated STAT2 ([STAT2p]) over a 720 min time course following simulated type I interferon exposure. In the wild-type (WT) computational model, the signaling cascade demonstrated rapid homeostatic attenuation, characterized by an activation peak at t = 45 min followed by rapid clearance driven by programmed negative feedback (k3 = 0.45 min-1) via simulated SOCS1 expression. In contrast, modeling gain-of-function (GoF) variations in STING1 and TYK2 pathways revealed severe threshold shifts, resulting in a persistent, nonattenuating hyper-inflammatory state. The signal half-life (t1/2) and steady-state fold changes are summarized in Table 5.
Data Availability Statement
https://doi.org/10.5281/zenodo.20378497https://github.com/drgulnarahmedova-pixel/DFT-WES-Pediatric-Cohort-MethodologyPatient-level clinical data corresponding to the final cohort are provided in Supplemental Table S1. The discrete digital signal-processing thresholds, mathematical formulations, software environment setups, and computational parameters required to replicate the DFT filtering and biophysical pathway simulations (ODEs and stochastic modeling) have been made publicly available. To ensure permanent and unhindered access for readers, this replication framework has been deposited on GitHub and permanently archived in Zenodo via DOI: https://doi.org/10.5281/zenodo.20378497. GitHub: https://github.com/drgulnarahmedova-pixel/DFT-WES-Pediatric-Cohort-Methodology. Standard open-source software libraries and numerical computing platforms used in this workflow, such as NumPy, SciPy, and COPASI, are publicly accessible.
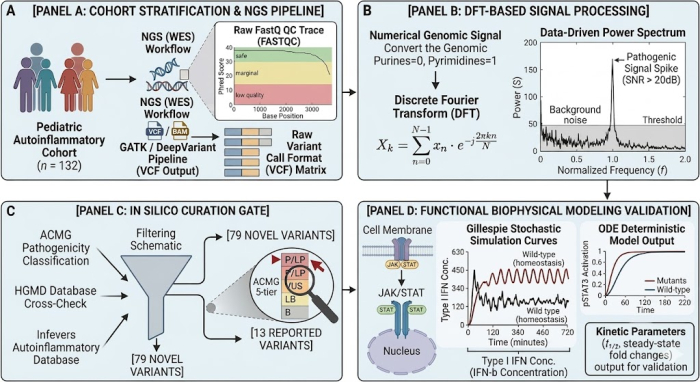
Figure 3. Operational storyboard and data-driven pipeline architecture for the identification and biophysical modeling of type I interferonopathy-associated variants. The schematic outlines a chronological, four-tier experimental and computational workflow, integrating clinical cohort analysis with biological signal processing. (A) Cohort stratification and NGS pipeline: workflow for the pediatric autoinflammatory cohort (n = 132) undergoing WES. The inset displays representative raw FastQ quality-control Phred score tracks, transitioning into GATK/DeepVariant variant calling and final VCF matrix generation. (B) DFT-based signal processing: algorithmic translation of genomic text into numerical genomic signals for noise reduction. The embedded data-driven graph plots a power spectrum distribution, identifying pathogenic variant frequencies (signal spikes) against genomic background noise with an SNR threshold of >20 dB. (C) In silico curation gate: multilayered prioritization funnel integrating ACMG 5-tier pathogenicity guidelines, HGMD, and Infevers cross-checks to prioritize the 79 novel and 13 reported variants. (D) Functional biophysical modeling validation: biological validation layer. The deterministic ODE framework and stochastic Gillespie simulation curves are integrated as graphical components, plotting the 720 min time course recovery and sustained signaling of wild-type versus simulated mutant cellular kinetics. Abbreviations: ACMG = American College of Medical Genetics and Genomics; DFT = discrete Fourier transform; GATK = Genome Analysis Toolkit; HGMD = Human Gene Mutation Database; NGS = next-generation sequencing; ODE = ordinary differential equation; SNR = signal-to-noise ratio; VCF = variant call format; WES = whole-exome sequencing. Please click here to view a larger version of this figure.
Table 3: Comprehensive annotation and locus database control of identified type I interferonopathy-associated genetic variants within the pediatric cohort (n = 132). ACMG criteria (from the 2015 ACMG/AMP guidelines): ACMG/AMP evidence codes were grouped by evidence strength. Very strong evidence included PVS1, which refers to predicted loss-of-function variants in genes where loss of function is an established disease mechanism. Strong evidence included PS1–PS4, covering previously established amino acid changes, confirmed de novo occurrence, supportive functional evidence, and increased variant frequency in affected individuals. Moderate evidence included PM1–PM6, including location in a critical domain or mutational hotspot, absence or very low frequency in population databases, trans occurrence in recessive disorders, protein-length changes, novel missense changes at residues with known pathogenic variation, and assumed de novo occurrence. Supporting evidence included PP1–PP5, including cosegregation, gene-specific missense constraint, in silico evidence, phenotype specificity, and reputable prior reports of pathogenicity when independent evidence was unavailable. Please click here to download this Table
Table 4: Side-by-side performance comparison of variant calling pipelines in high-noise genomic regions. Benchmarking evaluation was conducted across low-coverage (<30x) areas to assess the performance of the physics-based DFT low-pass filter in eliminating sequencing noise and protecting true-positive signals compared to standard algorithmic configurations. Abbreviations: DFT = discrete Fourier transform. Please click here to download this Table
Table 5: Quantitative kinetic parameters and steady-state variations of downstream JAK-STAT signaling. Summary of ODE and stochastic Gillespie simulation boundaries over a 720 min time course, highlighting the failure of cellular homeostatic attenuation in models carrying pathogenic STING1 and TYK2 variations. Abbreviations: JAK-STAT = Janus kinase-signal transducer and activator of transcription; ODE = ordinary differential equation; STING1 = stimulator of interferon response cGAMP interactor 1; TYK2 = tyrosine kinase 2. Please click here to download this Table
Supplemental Table S1. Patient-level dataset for the pediatric cohort with interferonopathy-associated variants. The table provides the patient-level data corresponding to the final 132-patient cohort analyzed in the manuscript.Please click here to download this file.
Discussion
Critical steps in the protocol include DNA fragmentation, adapter ligation, PCR amplification, and single-stranded DNA (ssDNA) circularization. During these stages, meticulous execution is essential to minimize contamination risk. Precise ethanol washes and appropriate magnetic stand incubation times during bead-based purification are mandatory, as deviations may result in reduced product yield or missed variant detection. During pooled library preparation, accurate calculation of 93.75 ng per patient and careful volume adjustment are required.
For protocol optimization and troubleshooting, low fluorometric quantification measurements, particularly ssDNA concentrations below the 0.8–2 ng/µL threshold, may necessitate increasing sequencing depth or shortening bead-drying times to improve variant-calling sensitivity. In cases of suspected mosaic variants, integration of long-read sequencing technologies may enhance detection accuracy. Additionally, rapid transfer of samples onto ice following enzymatic digestion is critical for maintaining product stability12,13. During DNB preparation, slow and gentle pipetting, along with careful addition of stop buffer, preserves nanoball integrity. This is especially important for establishing genotype-phenotype correlations in early-onset interferonopathies such as SAVI6,11.
This WES-based genetic analysis provides a framework for evaluating interferonopathy-associated variants in pediatric patients with autoinflammatory features and vasculitis. By identifying variants in key genes such as DNASE1, ADAR, STING1, RNASEH2A/B/C, TREX1, SAMHD1, and COPA, the study highlights the genetic heterogeneity underlying interferon-driven vasculitic phenotypes. The frequency of variants in nucleic acid metabolism and sensing genes, particularly DNASE1 and ADAR, in this cohort is consistent with the central role of dysregulated type I interferon signaling in the pathogenesis of pediatric vasculitis and autoinflammatory diseases. These findings are consistent with previous reports linking these genes to interferonopathies and vasculitic manifestations4,5,7.
By elucidating vasculitis-like presentations of monogenic autoinflammatory syndromes, such as the cutaneous and interstitial lung involvement observed in SAVI, this approach may facilitate early diagnosis and help guide anti-interferon-targeted therapies4,5,7. Monogenic interferonopathies can clinically mimic ANCA-associated vasculitis and other childhood vasculitides, underscoring the importance of genetic testing in atypical or treatment-resistant cases9,10,11. Early genetic diagnosis may also enable timely initiation of targeted treatments such as JAK inhibitors, which have shown clinical benefit in patients with STING1 and other interferon-related mutations7,13,14.
This study also reinforces that a significant proportion of pediatric patients presenting with complex autoinflammatory vasculitis harbor rare or novel variants in interferonopathy-related genes. The identification of 79 novel variants in this large cohort expands the known genetic spectrum and may contribute to better genotype-phenotype correlations in childhood vasculitis.
An operational consideration in this exploratory workflow involves evaluating threshold limits, as deviations in the exploratory SNR parameters may alter the filtering output. For example, DFT-based filtering of nucleotide distributions helps denoise reads but requires calibration to avoid over-smoothing mutation signals; troubleshooting includes iterative adjustment of binary mapping parameters (0 for purines, 1 for pyrimidines) to optimize feature extraction15. In biophysical modeling, defining initial conditions for ODEs is essential, as small perturbations in amplification rates can shift threshold behaviors, potentially underestimating sustained interferon signaling. Enhanced JAK-STAT details include modeling the role of TYK2 in IFN-α signaling, where gain-of-function variants amplify STAT2 activation, leading to interferonopathy phenotypes20.
Modifications to the method may include integrating stochastic elements for noisy cellular environments, such as adding Langevin noise terms to ODEs:
dX = f(X)dt + g(X)dW
where dW the listed term represents Wiener process noise, enhancing realism in simulating JAK-STAT variability21. Stochastic simulations of interferon pathways, using Gillespie algorithms, capture heterogeneity in IFN-β expression due to negative feedback loops, where cell-to-cell differences in transcription factor levels result in bimodal distributions of ISG activation22,23. Troubleshooting pathway models involves validating against experimental IFN-β data; if amplification diverges, negative controls such as phosphatase activation rates can be recalibrated, or distributed delays can be incorporated for transcription:
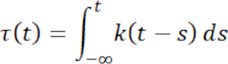
with gamma kernel for delayed processes.
Compared to whole-genome sequencing (WGS), this WES-focused approach may be cost-effective but is less comprehensive for non-exonic regions24,25. The scope of this preliminary framework is limited to providing a supportive biochemical simulation model to evaluate how mathematical variations correlate with estimated interferon signaling behavior, as seen in threshold models where cumulative effects exceed critical values leading to vascular injury. Limitations of the method include the potential to overlook low-level mosaic variants and the requirement for functional validation of novel findings6.
This technique has potential applications in immunology and vascular medicine, including guiding anti-interferon therapies by simulating variant impacts on pathways and enriching databases for rare disease diagnostics19. Stochastic extensions may further enable the prediction of heterogeneous responses in interferonopathies, aiding personalized medicine.
In this study, genetic evaluation in pediatric vasculitis is emphasized alongside conventional diagnostic tools such as histopathology and imaging modalities. Overall, this study highlights the importance of genetic evaluation in pediatric vasculitis while emphasizing the frequency of interferonopathy-associated variants identified among patients undergoing genetic analysis for suspected autoinflammatory diseases. By assessing the impact of these variants on interferon signaling pathways and underscoring the importance of early diagnosis in pediatric vasculitis, this work contributes to the enrichment of rare disease databases related to vasculitic and autoinflammatory disorders and provides insights for future studies investigating variant pathogenicity and population-specific polymorphisms.
Disclosures
The authors have no conflicts of interest to declare.
Acknowledgements
The authors thank the pediatric rheumatology team, clinical genetics unit, and bioinformatics collaborators for their contributions to patient evaluation, data acquisition, and technical support throughout the study. We are also grateful to the patients and their families for their participation and cooperation. Computational analyses were supported by institutional research infrastructure and multidisciplinary collaboration between clinical and molecular research teams.
Materials
| Name | Company | Catalog Number | Comments |
|---|---|---|---|
| Adjustable Pipettes (P2, P10, P20, P200, P1000) | Any supplier | For accurate liquid handling | |
| Benchtop Centrifuge | Any supplier | For brief centrifugation of PCR tubes | |
| Equinox Library Amp Mix | MGI Tech/ NEB | 7K0014-096 (or equivalent) | PCR amplification master mix |
| Ethanol (Molecular Biology Grade) | Any supplier | Used to prepare 80% ethanol wash solution | |
| IVT Primer 1 & IVT Primer 2 | MGI Tech | Included in kit or separate | Library amplification primers |
| Low-binding PCR Tubes (0.2 mL) | Any supplier | Sterile PCR tubes | |
| Magnetic Stand / Magnetic Rack | Any supplier | For magnetic bead separation | |
| MGI DNBSEQ-G400 | MGI Tech Co., Ltd. | 900-000641-00 | Benchtop next-generation sequencer using DNBSEQ technology (DNA Nanoball Sequencing); supports multiple read lengths (e.g., SE50 to PE300); high-throughput output up to 1440 Gb per run; ideal for WES, WGS, and targeted sequencing applications. |
| MGIEasy Circularization Kit | MGI Tech Co., Ltd. | 1000020570 (Dual Barcode, 16 RXN) or 1000005260 (V2.0) | Circularization kit for generating single-stranded circular DNA (ssCirDNA); dual barcode version reduces index hopping; essential post-library prep step for DNB formation in MGI sequencing workflow. |
| MGIEasy DNA Clean Beads | MGI Tech Co., Ltd. | 1000005279 | Magnetic beads for DNA purification |
| MGIEasy DNB Prep Kit/ DNB Make Kit | MGI Tech Co., Ltd. | 1000020570 (integrated with Dual Barcode Circularization) or related DNB Make (e.g., 940-000036-00 Onestep DNB) | DNA Nanoball (DNB) preparation module; includes circularization and nanoball generation for flow cell loading; final step in library processing for DNBSEQ sequencers (often combined with Circularization Kit). |
| MGIEasy Exome Capture Accessory Kit | MGI Tech Co., Ltd. | 1000009657 (or equivalent) | Contains Blocker Solution, MGI Universal Blockers, Enhancer, Binding Buffer, Wash Buffer 1 & 2, and Streptavidin beads |
| MGIEasy Exome Capture V4 Probes (or Twist CES Probes, compatible with MGI/DNBSEQ) | MGI Tech Co., Ltd. (for MGIEasy) or Twist Bioscience (for Twist) | 1000007745 (V4 Probe Set, 16 RXN) or 1000007740 (Probes); Twist: Custom / panel-specific (order-based, no standard number) | Hybridization-based whole exome capture probes; targets ~59 Mb coding regions (CCDS, RefSeq, GENCODE, miRBase); designed for high-efficiency enrichment in WES workflows on DNBSEQ platforms; used with MGIEasy Accessory Kit for hybridization (65°C pre-incubation, 16-hour overnight at 65°C), blocker addition, streptavidin bead capture (binding buffer, Wash Buffer 1/2 at 48°C), elution, and post-capture PCR amplification (compatible with Equinox mix). |
| MGIEasy Fast Hybridization and Wash Kit | MGI Tech Co., Ltd. | 940-001974-00 (16 RXN) | Hybridization and washing reagents |
| MGIEasy FS DNA Library Prep Kit | MGI Tech Co., Ltd. | 1000006987 (16 RXN set) or 1000005256 (96 RXN core kit) | Fast fragmentation-based DNA library preparation kit; enzymatic fragmentation with 5–400 ng gDNA input; compatible with DNBSEQ platforms for efficient WGS/WES library construction. |
| Nuclease-free Water | Any supplier | Molecular biology grade | |
| Qubit dsDNA HS Assay Kit | Thermo Fisher Scientific | Q32851 | For library quantification |
| Qubit ssDNA Assay Kit (optional) | Thermo Fisher Scientific | Q10212 | For ssDNA quantification after circularization |
| Streptavidin Magnetic Beads | MGI Tech | Included in Accessory Kit | For hybrid capture |
| TE Buffer (pH 8.0) | Any supplier | For denaturation step | |
| Thermal Cycler | Various (Bio-Rad, Thermo, etc.) | Used for fragmentation, ligation, PCR, and DNB programs | |
| Vortex Mixer | Any supplier | For sample mixing | |
| Wide-bore Pipette Tips | Any supplier | Required for DNB preparation |