Axillary osmidrosis (AO) impacts daily life and mental health. Microneedle radiofrequency (MNRF) offers good results with fewer side effects than traditional surgery. A new zone-directed needling pattern was tested against two common methods. After six months, the zone-directed approach worked better, improving quality of life with fewer side effects.
Research Article
Efficacy and Safety of Three Needling Patterns for Microneedle Radiofrequency in Axillary Osmidrosis: A Prospective Randomized Trial
* These authors contributed equally
In This Article
Summary
Abstract
Axillary osmidrosis (AO) is a common dermatological disorder characterized by malodorous axillary secretions, which severely impairs patients’ quality of life and psychological status. Microneedle radiofrequency (MNRF) has emerged as a minimally invasive alternative to traditional surgical treatment owing to its favorable efficacy and safety profile; however, clinical needling patterns currently lack standardized, evidence-based criteria and largely rely on individual experience, potentially leading to inconsistent therapeutic outcomes and variable risks of adverse events. This prospective randomized controlled trial enrolled 90 patients with moderate-to-severe axillary osmidrosis to comprehensively evaluate the efficacy and safety of a novel zone-directed needling pattern (ZD), with full transverse needling (FT) and full longitudinal needling (FL) set as conventional control techniques. All participants completed a 6-month clinical follow-up, and therapeutic outcomes, quality-of-life improvements reflected by the dermatology life quality index (DLQI), and early postoperative adverse events, including erythema, swelling, and pain, were systematically compared among the three groups. The ZD needling pattern achieved high clinical effectiveness (90.0%) comparable to FL (93.3%), with a safety profile closer to FT, while FT showed lower 6-month efficacy (53.3%) and a higher recurrence rate (40.7%). The FL group, despite high efficacy, exhibited a significantly higher incidence of short‑term adverse reactions. The present findings demonstrate that the optimized ZD needling strategy effectively balances therapeutic efficacy and procedural safety by integrating the advantages of conventional longitudinal and transverse needling modes, providing a standardized, evidence-based MNRF manipulation protocol for axillary osmidrosis treatment.
Introduction
Axillary osmidrosis (AO) is a distressing dermatological condition characterized by malodorous axillary secretions that significantly impair psychosocial well-being and quality of life. The odor arises from bacterial metabolism of apocrine gland secretions, with severity correlating with glandular density and activity1,2. Histologically, AO is marked by apocrine gland hyperplasia and an irregular three-dimensional distribution within the dermal-subcutaneous junction3, creating a therapeutic challenge for complete glandular destruction and contributing to treatment recurrence4.
Multiple treatment options ranging from topical agents, botulinum toxin injection, microwave thermolysis, to surgical excision have been applied for AO management, yet each modality carries inherent limitations, including unsatisfactory long-term efficacy, prolonged downtime, prominent scarring or high recurrence rates, highlighting the clinical demand for refined minimally invasive therapeutic schemes5. Microneedle radiofrequency (MNRF) represents an advanced minimally invasive modality that delivers controlled thermal energy via insulated needles to precisely target apocrine glands, with low recurrence and mild transient complications in clinical trials6. Operating by resonating with water molecules in glandular tissue to generate localized heat, MNRF achieves selective destruction7. Compared to surgical excision and other energy-based therapies, MNRF demonstrates satisfactory efficacy with reduced scarring, quicker recovery, and better cost-effectiveness. Despite consistent energy parameter settings during MNRF therapy, clinical observations indicate that the spatial arrangement of insertion trajectories, namely the needling pattern, exerts a substantial influence on the range of thermal injury and subsequent clinical outcomes. At present, there is no consensus regarding optimal needling strategies, and evidence-based, standardized protocols for pattern selection are lacking, resulting in clinical practice relying largely on individual operator preference8.
Given the anatomically heterogeneous distribution of axillary apocrine glands, this study hypothesizes that a regionally differentiated targeted puncture strategy could maximize gland destruction while limiting unnecessary thermal damage to normal periglandular tissue9. To address this, a prospective, randomized controlled trial comparing a novel zone-directed needling strategy (ZD) with full longitudinal (FL) and transverse (FT) patterning in patients with moderate-to-severe AO was conducted. The objective was to identify the needling approach that achieves optimal long-term therapeutic efficacy alongside the most favorable safety profile. The findings of this trial aim to provide standardized, evidence-based operational guidance for MNRF treatment of AO. The primary novelty of the present work lies in the proposal and head-to-head quantitative validation of an anatomically oriented, zone-directed needling protocol that balances efficacy and adverse event risk and addresses the lack of standardized puncture regimens in current clinical practice.
Protocol
Study design and participants
This randomized, patient- and assessor-blinded, parallel-group trial adhered to the CONSORT guidelines10. The checklist is provided in Supplementary File 1. The protocol was approved by the Ethics Committee of the First Affiliated Hospital of Chongqing Medical University (2023-435) and registered at ClinicalTrials.gov (NCT07094009). The study was conducted between October 2023 and April 2024 in the dermatology outpatient department. All procedures were performed in a dedicated treatment room maintained at a constant temperature of 22–24 °C. All participants provided written informed consent. Patients were randomly allocated in a 1:1:1 ratio to the FT, FL, or ZD group using a computer-generated randomization sequence. Allocation concealment was maintained using sequentially numbered opaque sealed envelopes prepared by an independent statistician. Participants and investigators, including outcome assessors and statisticians, remained blinded throughout the trial.
The primary outcome was the clinical success rate of different MNRF needling patterns in AO. Based on prior clinical observation, efficacy rates of 50% (FT), 90% (FL), and 90% (ZD) were assumed. Sample size calculation using PASS (two-tailed α = 0.05, power = 90%) determined 27 patients per group. To account for attrition, 30 patients were enrolled per group (total n = 90). Inclusion criteria: (1) age 18–50 years with AO; (2) AO severity Grade 2–3 per Park’s Grading System11; (3) willingness to provide informed consent. Exclusion criteria: (1) concurrent axillary dermatoses; (2) history of keloid or hypertrophic scarring; (3) pregnancy, lactation, or planned pregnancy; (4) coagulation disorders or immunodeficiency; (5) a previous history of invasive axillary odor treatment. Of 100 screened patients, 6 did not meet the inclusion criteria, and 4 declined, resulting in 90 randomized participants: 30 each in the FT, FL, and ZD groups (Figure 1).
Procedure of MNRF
On the day of treatment, the axillary region was thoroughly cleaned, and hair was shaved prior to the procedure. Each patient was positioned supine with the arm abducted at approximately 90° to expose the axillary vault. Following standard disinfection and sterile draping, tumescent anesthesia was administered at the dermal-subcutaneous junction. The anesthetic solution comprised 20 mL of 2% lidocaine, 0.5 mL of 0.1% epinephrine, and normal saline to a total volume of 200 mL. A waiting period of approximately 5 min was observed to ensure adequate anesthesia. The treatment area was defined as a square extending 1.0 cm beyond the hair-bearing region of the axilla and then subdivided into 3 cm2 grids. Each patient received a single treatment session. Treatment was delivered using an MNRF device equipped with a sterile, single-use tip. The device settings were fixed as follows: energy output at 15 W, pulse width at 300 ms, and needle depth at 4.0 mm. The needle penetration depth was adjusted to 4.0 mm to target the apocrine gland layer based on prior anatomical studies. The direction of needle insertion was accordingly defined as transverse (parallel to the basal skin folds) or longitudinal (perpendicular to them).
Patients were randomly assigned to one of three needling protocols: the full transverse (FT) group, in which transverse needling was applied across the entire treatment area (Figure 2A, D); the full longitudinal (FL) group, in which longitudinal needling was applied across the entire treatment area (Figure 2B, E); and the zone-directed (ZD) Group, in which a stratified approach was used (Figure 2C, F), with longitudinal needling restricted to the central region and transverse needling applied within a 1.5 cm peripheral band inside the marked border. All procedures were performed by a single experienced dermatologist to ensure consistency. Following treatment, the site was cleansed with normal saline, then a 30-minute ice compress was applied. The area was covered with sterile gauze and bandaged. Patients were instructed to keep the treatment area dry for 48 h and to avoid strenuous physical activity for 7 days. A detailed list of all materials, reagents, equipment, and software used in this study is provided in the Table of Materials. Generic institutional supplies (e.g., sterile gauze, disinfectant, and ice packs) were obtained from the hospital’s standard supply inventory.
Efficacy
Efficacy was assessed at 7 days and 6 months post-treatment. All evaluations were performed by two trained dermatologists who were blinded to group allocation. AO severity was graded on a 0–3 scale using the Park Grading System (PGS, Table 1). Treatment efficacy was determined by the change in the PGS score, which was classified as excellent, good, or fair based on a predefined AO elimination grading system (Table 2). Clinical success, defined as an efficacy grade of excellent, good, or fair, was based on published studies12,13. Recurrence was defined as a decrease in PGS score at 7 days followed by a return to baseline or higher at 6 months. The Dermatology Life Quality Index (DLQI, range 0–30) was recorded at baseline, 7 days, and 6 months.
Safety
Safety outcomes were documented at 7 days (for acute, transient events such as pain, erythema, swelling, and ecchymosis) and 6 months (for long-term sequelae such as scarring and pigmentation, as well as the status of any early complications that had resolved) according to predetermined checklists. Pain was assessed using a Visual Analog Scale (VAS, range 0–10, where 0 = no pain and 10 = worst imaginable pain).
Statistical analysis
Statistical analysis was conducted using SPSS. Normality of continuous variables was assessed with the Shapiro–Wilk test. Normally distributed data are expressed as mean ± standard deviation (SD) and were compared using one‑way ANOVA with Bonferroni post‑hoc tests. Non‑normally distributed data are presented as median (interquartile range, IQR) and analyzed using the Kruskal–Wallis H test followed by Dunn’s post‑hoc tests. Within‑group comparisons were performed using the paired t‑test (parametric) or the Wilcoxon signed‑rank test (non‑parametric). Categorical data are shown as frequencies (percentages) and compared with the Chi‑square or Fisher’s exact test, as appropriate. For multiple comparisons among the three groups, the Bonferroni correction was applied consistently to all primary and secondary endpoints, with a significance threshold of p < 0.017. All analyses were conducted on an intention‑to‑treat (ITT) basis. Treatment effects for categorical outcomes were expressed as Risk Difference (RD) and Relative Risk (RR), while the Hodges‑Lehmann median difference was used for non‑parametric continuous data. All effect sizes are reported with 95% confidence intervals (95% CIs). A two‑tailed p‑value < 0.05 was considered statistically significant for all other analyses. Exact p‑values are reported wherever feasible; p‑values below 0.001 are presented as p < 0.001. Post-hoc sensitivity analyses using a stricter efficacy definition (excellent + good only) were performed to test the robustness of the primary results.
Results
A total of 90 patients were enrolled and randomized: FT group (n = 30; 17 female/13 male), FL group (n = 30; 16 female/14 male), and ZD group (n = 30; 15 female/15 male). Baseline characteristics were comparable across groups, with no significant differences in gender distribution (p = 0.875), mean age (FT: 25.3 ± 3.8 years; FL: 26.1 ± 3.6 years; ZD: 26.9 ± 3.7 years; p = 0.251), Body Mass Index (BMI, FT: 23.0 ± 3.4 kg/m2; FL: 22.4 ± 3.8 kg/m2; ZD: 21.9 ± 3.5 kg/m2; p = 0.518), or baseline AO severity grades (all patients Grade 2 or 3; p = 0.870). All 90 participants completed the 6-month follow-up (Table 3). Typical treatment procedure and recovery of MNRF for AO are provided (Figure 3A–C). This representative patient (baseline PGS grade 3) achieved a good response (grade 1 at 6 months), with complete resolution of post-treatment erythema and no scarring.
Efficacy rates
Clinical success rates differed significantly among the three groups at 6 months post-treatment (p < 0.001, Figure 4). The FL (93.3%) and ZD (90.0%) groups achieved markedly higher success rates than the FT group (53.3%). Pairwise comparisons confirmed significant differences between each active treatment group and the FT group (FL vs. FT: p < 0.001; ZD vs. FT: p = 0.002), while no difference was observed between FL and ZD (p = 1.000). Detailed efficacy grade distributions, RD, and RR are presented in Table 4. At 7 days post-treatment, efficacy rates were 90.0% (FT), 100% (FL), and 96.7% (ZD), with no significant intergroup difference (p = 0.108, Figure 4). Efficacy grade distributions were: FT group (excellent: 53.3%, good: 20.0%, fair: 16.7%, poor: 10.0%), FL group (excellent: 73.3%, good: 23.3%, fair: 3.3%, poor: 0%), and ZD group (excellent: 50.0%, good: 26.7%, fair: 20.0%, poor: 3.3%). While FL and ZD showed a higher proportion of favorable outcomes, the differences did not reach statistical significance (Table 4).
Sensitivity analysis
To assess the robustness of the primary endpoint definition, a sensitivity analysis was performed using a stricter definition of clinical success (excellent + good only, excluding fair). At 7 days post-treatment, the efficacy rates were 73.3% in the FT group, 96.7% in the FL group, and 76.7% in the ZD group (p = 0.038). Pairwise comparisons showed significant differences between FL and FT (p = 0.007) and between FL and ZD (p = 0.016). At 6 months, the efficacy rates were 33.3% (FT), 90.0% (FL), and 66.7% (ZD) (p < 0.001). Pairwise comparisons showed significant differences between FL and FT (p < 0.001), FL and ZD (p = 0.028), and FT and ZD (p = 0.010). These sensitivity analyses confirmed the robustness of the primary findings. Detailed results are presented in Supplementary Table 1.
Recurrence
Recurrence was defined as a return to a PGS grade equal to or higher than the baseline level, restricted to initial responders (patients with reduced grade at 7 days vs. baseline). Among initial responders, 6-month recurrence rates were 40.7% (11/27) in the FT group, 6.7% (2/30) in the FL group, and 6.9% (2/29) in the ZD group, with a significant overall difference (p = 0.009, Figure 4). Pairwise comparisons showed FL and ZD groups had significantly lower recurrence risks than FT (Table 4).
DLQI
Baseline DLQI scores were comparable across groups (FT: 8.0 [IQR: 6.0–16.0]; FL: 9.0 [IQR: 6.8–15.0]; ZD: 9.5 [IQR: 6.8–16.0]; p = 0.729). All groups demonstrated significant improvements in DLQI from baseline at both follow-up time points (all p < 0.001). At 7 days, median DLQI scores were 5.0 (IQR: 3.0–9.3) (FT), 3.0 (IQR: 1.8–6.3) (FL), and 3.4 (IQR: 2.0–6.3) (ZD). Median reductions from baseline were 4.0 (95% CI: 1.50–5.50) (FT), 5.0 (95% CI: 3.00–7.50) (FL), and 6.0 (95% CI: 4.00–8.00) (ZD), with no significant intergroup differences (p = 0.085, Figure 5 and Figure 6). At 6 months, sustained improvements were observed, with median DLQI scores of 5.5 (IQR: 2.0–8.0) (FT), 1.0 (IQR: 0.0–3.0) (FL), and 2.0 (IQR: 0.0–3.0) (ZD). Median reductions were 5.0 (95% CI: 0.50–6.00) (FT), 7.0 (95% CI: 5.50–11.00) (FL), and 7.5 (95% CI: 6.00–11.00) (ZD), with significant intergroup differences (p < 0.001). Post-hoc analysis confirmed that the FL and ZD groups had significantly lower DLQI scores than the FT group (both p < 0.001), while FL and ZD showed no difference (p = 0.948, Figure 5 and Figure 6).
Safety
Significant intergroup differences were observed in the incidence of pain, erythema, and swelling (all p < 0.05, Table 5).
Pain: The FL group had a higher pain incidence (60.0%, 18/30) than the FT group (20.0%, 6/30; RR = 3.00, 95% CI: 1.39–6.50; RD = 40.0%, 95% CI: 15.4%–64.6%; p = 0.002) and ZD group (23.3%, 7/30; RR = 2.57, 95% CI: 1.24–5.34; RD = 36.7%, 95% CI: 12.0%–61.4%; p = 0.004), with no difference between FT and ZD (p = 1.000, Figure 7). Median VAS pain score was higher in FL (1.5 [IQR: 0.0–2.3]) than in FT and ZD (both 0.0 [IQR: 0.0–0.0]; p < 0.001), with a median difference of 1.0 (95% CI: 0.00–2.00). Two FL patients required lidocaine patches, and all pain resolved within 7 days (Table 5).
Other complications: Incidence of erythema/swelling was 40.0% (FL), 16.7% (ZD), and 10.0% (FT) (p = 0.013), with FL showing a significant difference vs. FT (p = 0.007; RR = 4.00, 95% CI: 1.25–12.75; RD = 30.0%, 95% CI: 9.4–50.6%). Ecchymosis rates were 20.0% (FL), 6.7% (ZD), and 3.3% (FT) (p > 0.05). No hematoma was reported, and all mild complications resolved within 2 weeks with local heat application. Dysesthesia occurred only in FL (6.7%, 2/30) and resolved within 1 month with mecobalamin (Table 5, Figure 7).
Long-term safety (6 Months Post-treatment)
At the 6-month follow-up, all early complications (pain, erythema, swelling, and ecchymosis) had resolved. Scar formation was observed in 10.0% (3/30) of the FL group, consisting of small (< 1 cm), non-hypertrophic, asymptomatic lesions (Table 5, Figure 7). No severe adverse events (e.g., burns, infections, necrosis) were reported throughout the trial. All adverse events were mild and transient. In summary, the ZD needling strategy achieved 6 months efficacy (90.0%) comparable to FL (93.3%), with a safety profile closer to FT, while FT showed lower efficacy (53.3%) and higher recurrence (40.7%). The ZD strategy effectively balanced therapeutic efficacy and safety, offering a promising optimized protocol for MNRF treatment of axillary osmidrosis.
DATA AVAILABILITY:
The dataset supporting the findings of this study is publicly available via Science Data Bank at https://doi.org/10.57760/sciencedb.45827
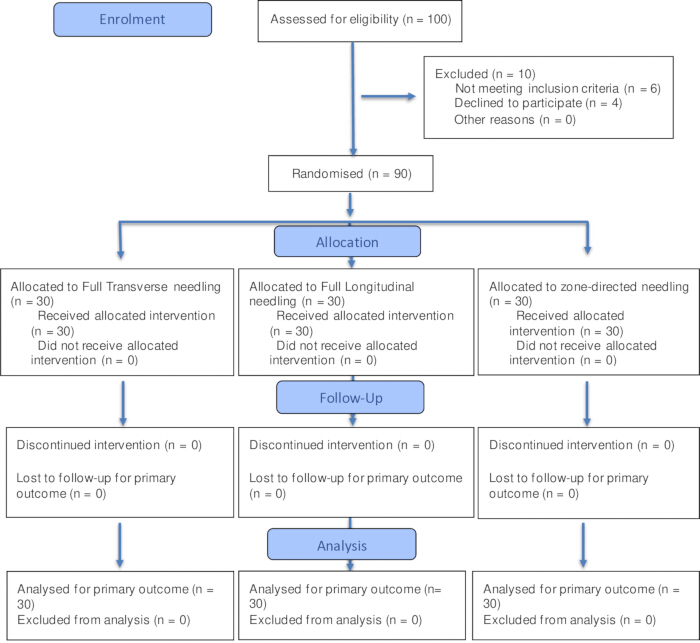
Figure 1: CONSORT diagram showing the flow of participants during the study. Adapted from the CONSORT 2025 Flow Diagram template under a Creative Commons Attribution License10. Please click here to view a larger version of this figure.
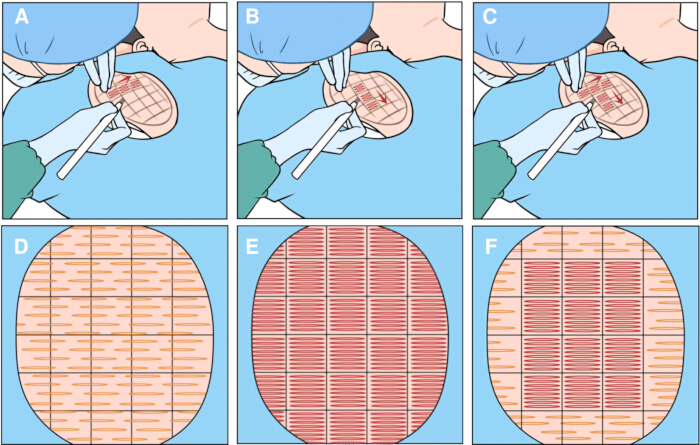
Figure 2: Schematic of three needling strategies for MNRF treatment of axillary osmidrosis. (A, D) Full Transverse (FT) Group; (B, E) Full Longitudinal (FL) Group; (C, F) Zone-Directed (ZD) Group. (A–C) Intraoperative needling orientation; (D–F) Top-down view of needle trajectory distribution. This figure was created by the authors using Adobe Photoshop. No part of this figure has been reproduced or adapted from previously published sources. Please click here to view a larger version of this figure.
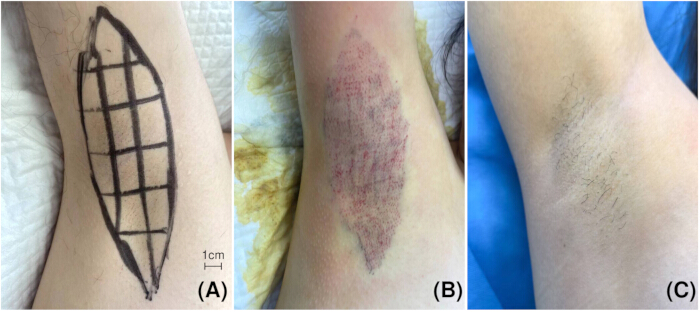
Figure 3: Typical treatment procedure and recovery of MNRF for axillary osmidrosis (AO). (A) Preoperative marking of the axillary treatment area (scale bar = 1 cm, grid size of 3 cm2 [approximately 2 cm × 1.5 cm]); (B) Immediately post-treatment, showing pinpoint bleeding and erythema; (C) At 6 months post-treatment, demonstrating complete resolution of erythema with no scar formation. Please click here to view a larger version of this figure.
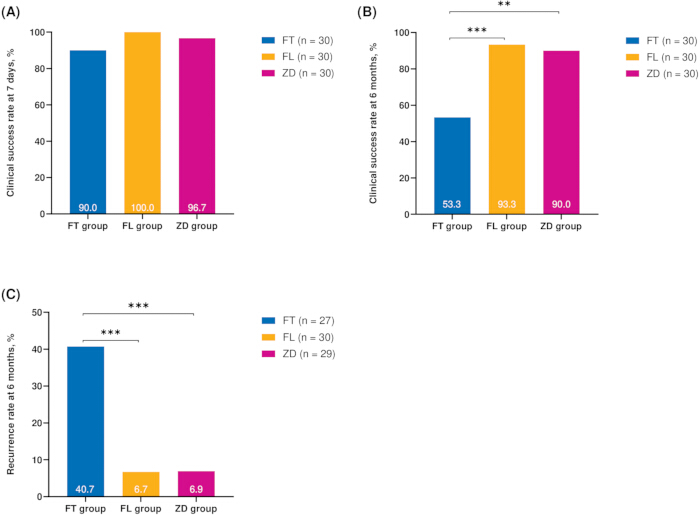
Figure 4: Clinical efficacy and recurrence outcomes. (A) Clinical success rate at 7 days post-treatment; (B) Clinical success rate at 6 months post-treatment; (C) 6-month recurrence rate (restricted to initial responders, i.e., patients with reduced PGS at 7 days). Between-group comparisons were performed using the Chi-square test with Bonferroni correction. ***p < 0.001, **p < 0.01. Please click here to view a larger version of this figure.
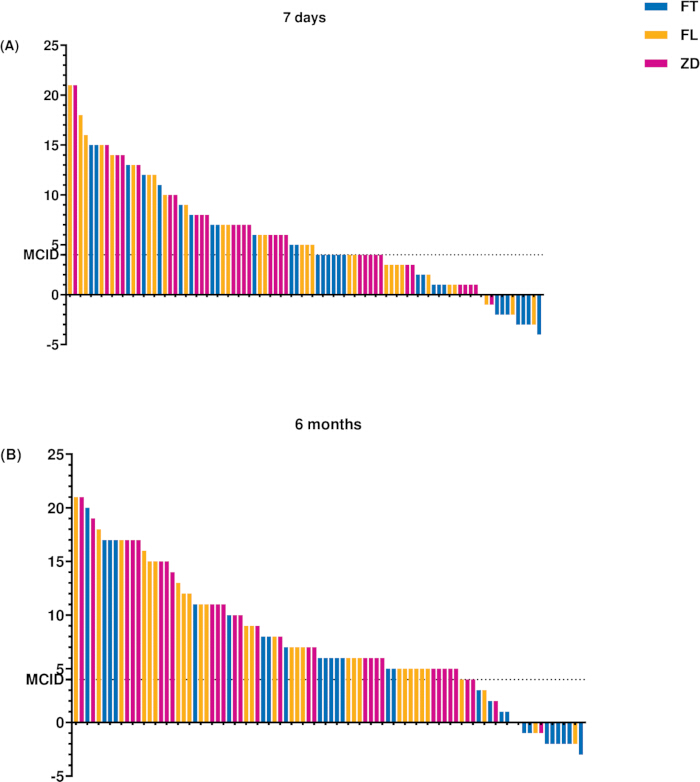
Figure 5: Individual changes in DLQI scores from baseline. (A) At 7 days and (B) 6 months. Each bar represents the DLQI reduction for an individual patient, ordered by decreasing value. The dashed line indicates the minimally clinically important difference (MCID) for DLQI, above which the improvement is considered clinically meaningful. Please click here to view a larger version of this figure.
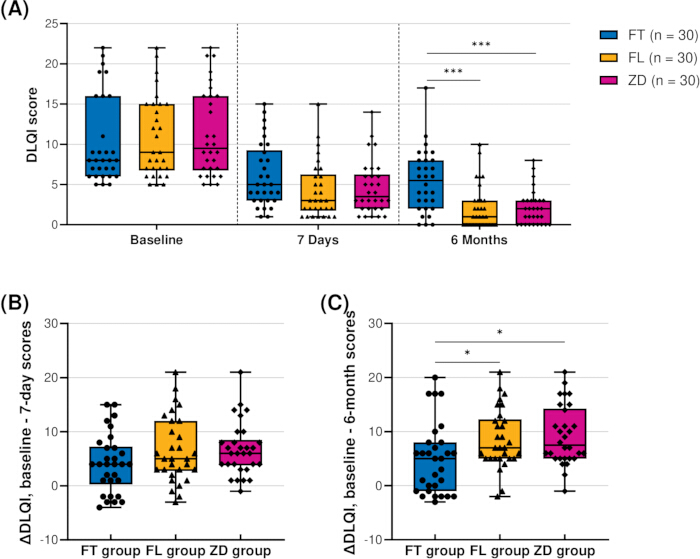
Figure 6: DLQI scores and improvements in the FT, FL, and ZD groups at baseline, 7 days, and 6 months. (A) DLQI scores at each time point; (B) DLQI improvement (ΔDLQI) from baseline to 7 days; (C) DLQI improvement (ΔDLQI) from baseline to 6 months. Between-group comparisons were performed using the Kruskal-Wallis test with Dunn’s post hoc test: *p < 0.05, **p < 0.01, ***p < 0.001. Please click here to view a larger version of this figure.
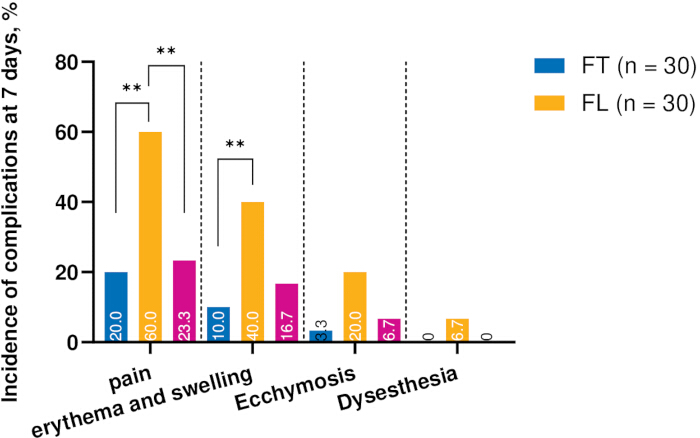
Figure 7: Incidence of complications at 7 days post-treatment in the FT, FL, and ZD groups. Data are presented as percentages. **p < 0.01. Please click here to view a larger version of this figure.
Table 1: The Park grading system of axillary osmidrosis. This grading system classifies the severity of axillary osmidrosis on a 0–3 scale. Higher grades indicate greater severity. Please click here to download this file.
Table 2: The efficacy grade of the axillary osmidrosis elimination grading system. Abbreviations: PGS = the Park grading system of axillary osmidrosis. Please click here to download this file.
Table 3: Baseline demographic and clinical characteristics of the participants. Intergroup comparisons for continuous variables (age, BMI) were performed using one‑way ANOVA, and for categorical variables (gender, PGS grade) using the χ2 test. A p value < 0.05 was considered statistically significant. Abbreviations: FT = full transverse; FL = full longitudinal; ZD = zone-directed; SD = standard deviation; PGS = the Park grading system for axillary osmidrosis; BMI = body mass index. Please click here to download this file.
Table 4: Comparison of short- and long-term efficacy, and recurrence among three groups.*p < 0.05 was considered statistically significant for overall comparisons among the three groups (Kruskal-Wallis H test/χ2 test). Post hoc pairwise comparisons (Dunn’s test/χ2 test) were performed when p < 0.05, with significance set at p’ < 0.017 (Bonferroni correction, α = 0.05/3). Abbreviations: FT = full transverse; FL = full longitudinal; ZD = zone-directed; RD = risk difference; RR = relative risk; CI = confidence interval; DLQI = dermatology life quality index; IQR = interquartile range. Please click here to download this file.
Table 5: Comparison of complications among different groups. *p < 0.05 was considered statistically significant for overall comparisons among the three groups (Kruskal-Wallis H test/χ2 test). Post hoc pairwise comparisons (Dunn’s test/χ2 test) were performed when p < 0.05, with significance set at p’ < 0.017 (Bonferroni correction, α = 0.05/3). Abbreviations: FT = full transverse; FL = full longitudinal; ZD = zone-directed; RD = risk difference; RR = relative risk; CI = confidence interval; IQR = interquartile range. Please click here to download this file.
Supplementary Table 1: Sensitivity analysis of short- and long-term efficacy among the three groups using a stricter efficacy definition (excellent + good only, excluding fair). *p < 0.05 was considered statistically significant for overall comparisons among the three groups (Kruskal‑Wallis H test/χ2 test). Post hoc pairwise comparisons (Dunn’s test/χ2 test) were performed when p < 0.05, with significance set at p' < 0.017 (Bonferroni correction, α = 0.05/3). Bold values indicate statistical significance. Abbreviations: FT = full transverse; FL = full longitudinal; ZD = zone-directed. Please click here to download this file.
Supplementary File 1: CONSORT checklist. This file contains the CONSORT checklist for the study. Please click here to download this file.
Discussion
MNRF can penetrate deeply enough to reach apocrine sweat glands, shrinking and destroying them in a targeted manner by relying on the high-frequency thermal effect, while minimizing damage to surrounding tissues. This technique generates ablation and coagulation14,15. Histological studies confirm a reduction in the number and size of both apocrine and eccrine glands post-treatment16,17. The treatment depth generally encompasses the apocrine sweat glands. Various treatment modalities have been exploring more effective and safer measures for AO. Surgical techniques have evolved toward smaller incisions and refined procedures13,18,19,20, often with negative pressure assistance, to reduce complications8,21,22. Similarly, combining negative pressure with MNRF and optimizing parameters (e.g., long conduction time with low power) has been reported to enhance efficacy20. However, a consensus on the optimal needling strategy has been lacking, with techniques largely empirical. While the inability to visualize apocrine glands in real-time is acknowledged as a limitation common to many minimally invasive approaches, the question of how to maximize glandular destruction and minimize complications without such visualization remains central to MNRF procedure optimization.
Several critical procedural steps are essential for achieving optimal outcomes with MNRF. First, accurate determination of the treatment area—extending 1.0 cm beyond the hair-bearing region—is crucial for complete coverage of the apocrine gland distribution8. Second, consistent needle depth (4.0 mm) ensures that thermal energy reaches the apocrine gland layer located in the deep dermis and superficial subcutaneous tissue, as confirmed by prior anatomical studies23,24. Third, uniform needling density across the treatment grids helps avoid skip areas that could result in incomplete glandular destruction. Additionally, in the ZD strategy, precise delineation between the central and peripheral zones is critical to achieving the intended balance between efficacy and safety.
From a troubleshooting perspective, managing intraoperative pain and postoperative adverse events is an important practical consideration. Pain during treatment can be effectively managed by ensuring adequate tumescent anesthesia and waiting approximately 5 min for the anesthetic to take full effect. For patients experiencing persistent discomfort, adjusting the energy parameters or using additional local analgesia may be considered, as suggested by prior MNRF studies8. Postoperative erythema and swelling, most pronounced in the FL group, typically resolved within 7 days with cold compress and wound care. Transient dysesthesia (6.7% in FL) resolved within 1 month with mecobalamin, suggesting conservative management suffices in most cases.
This prospective, randomized trial provides the first comparative evidence that the needling strategy is a critical factor in outcomes in MNRF treatment for AO. The principal finding is that a novel, zone-directed (ZD) strategy achieves an optimal balance, delivering long-term efficacy equivalent to that of full longitudinal (FL) needling while maintaining a safety profile comparable to that of full transverse (FT) needling without visualization. The marked superiority of both FL and ZD strategies over FT needling in 6-month efficacy (93.3% and 90.0% vs. 53.3%) and recurrence (6–7% vs. 40.7%) can be attributed to differences in energy-tissue interaction. The sensitivity analysis using a stricter efficacy definition (excellent + good only) confirmed the robustness of the primary findings, with FL and ZD strategies consistently outperforming FT at both 7 days and 6 months. Histologically, apocrine glands in AO exhibit focal hyperplasia and an irregular, three-dimensional distribution, predominantly within the central axillary vault. Although histological confirmation was not performed, the FL and ZD groups achieved significantly higher efficacy than the FT group. Based on the anatomical distribution of apocrine glands, it is hypothesized that longitudinal needle passes create contiguous, overlapping thermal lesions (thermal injury zones, TIZs) along these glandular clusters. This pattern may have contributed to more complete glandular destruction23,24. In contrast, transverse passes may generate discontinuous thermal fields, leaving residual functional glands, which could plausibly explain the higher recurrence observed in the FT group. These mechanistic interpretations remain speculative and require histological validation in future studies.
However, the enhanced efficacy of FL needling came at a high cost to tolerability. The FL group experienced a significantly higher incidence and intensity of pain, erythema, and swelling. This is consistent with excessive cumulative thermal injury at the epidermal and upper dermal levels, as longitudinal passes concentrate energy along similar entry points. A similar mechanism is implicated in severe complications from other energy-based therapies. For instance, subcutaneous necrosis with fat liquefaction and hematoma after microwave therapy has been attributed to heat accumulation from repeated pulses in the same region25. The higher rates of transient dysesthesia and minor scarring in the FL group further underscore this risk of collateral damage. The zone-directed strategy successfully decouples efficacy from excess morbidity through a novel rational design. Restricting longitudinal passes to the central zone, where the dermis is thicker and gland density is highest, ensures adequate glandular coverage. Simultaneously, it employs gentler transverse passes in the thin-skinned, gland-sparse peripheral zone, minimizing unnecessary epidermal trauma and thermal accumulation. This stratified approach operationalizes selective thermolysis, maximizing target destruction while sparing surrounding tissue. Consequently, the ZD strategy replicated the high success rate of FL needling, with a complication profile that was statistically indistinguishable from that of the safer FT approach. The findings of this RCT demonstrate that optimized MNRF compares favorably with other common modalities. Surgical treatments are associated with scar contracture and flap necrosis compared to MNRF26,27,28, while microwave therapy lacks sweat gland selectivity and may damage nerve29,30,31. In contrast, among 90 MNRF patients in this study, no instances of hematoma or necrosis were observed. The recurrence rate with the ZD strategy (6.9%) was comparable to or better than reported for these alternatives, with a superior safety profile.
ZD strategy corroborates and extends previous findings on MNRF for AO. The achieved 6-month efficacy rate of 90.0% aligns with or surpasses rates reported in prior studies employing conventional MNRF (79.2% at 3 months28) or negative-pressure assisted MNRF (76.67% at 6 months8). Furthermore, safety outcomes are consistent with the established minimally invasive profile of MNRF. The total complication rate in the ZD group was low and primarily transient. This mirrors the safety patterns reported by others, in which transient erythema, pinpoint bleeding, and mild post-inflammatory hyperpigmentation are common but self-limiting6,8,16. Regarding recurrence, despite differing definitions (worsening from post-treatment peak vs. return to baseline), the absolute 6-month recurrence rate with the ZD strategy was low (6.9%). This rate is not only significantly lower than that of the FT group (40.7%) in this trial but also compares favorably in magnitude to rates reported in other MNRF series (e.g., 20.8%28), underscoring the strategy's durable effect. The strategy's success in optimizing glandular coverage likely underlies this low recurrence. The secondary outcomes on quality of life reinforce the clinical relevance of the ZD strategy. The DLQI results showed that only the FL and ZD groups maintained a profound, statistically significant improvement at 6 months, which directly correlated with their low recurrence rates. This finding is consistent with studies reporting significant post-MNRF improvements in DLQI and a reduction in social embarrassment6, highlighting that long-term odor control is essential for meaningful psychosocial recovery. This study establishes needling pattern and zone adaptation as independent variables for MNRF success in AO. The ZD strategy offers a practical, immediately implementable protocol that resolves the classic efficacy-safety trade-off. The logic of intensifying treatment where targets are dense and mitigating it where they are sparse may be applicable to other minimally invasive glandular ablation procedures. Moreover, the clinical significance of this study extends beyond the immediate comparative findings. By providing head-to-head evidence for a stratified needling approach based on anatomical principles, this work contributes to the standardization of MNRF practice for AO. This evidence-based protocol can serve as a reference for clinicians seeking to optimize treatment outcomes while minimizing patient morbidity.
However, this study has some limitations. First, the absence of histopathological confirmation of gland destruction restricts mechanistic interpretations to the clinical level. Second, a 6-month follow-up, though adequate to demonstrate medium-term outcomes, necessitates longer-term studies to confirm permanence. Third, as a single-center trial using a single device with fixed energy parameters (15 W, 300 ms), the generalizability of the findings to other RF systems, different insulated needle designs, or alternative energy settings requires further validation, given that variations in device characteristics and operator experience may influence outcomes. Nonetheless, the anatomical principle underlying the ZD strategy—central targeting with peripheral sparing—is likely transferable to other insulated microneedle platforms. Future multicenter studies with diverse devices and standardized training protocols are needed to confirm external validity. In addition, future studies incorporating histopathological analysis and long-term follow-up are warranted to confirm the durability of the ZD strategy's efficacy and to better understand the histological mechanisms underlying the observed clinical outcomes. Beyond these, the integration of real-time imaging technologies (e.g., high-frequency ultrasound) and feedback-controlled energy delivery may further refine procedural precision and standardize outcomes32.
Disclosures
All authors declare to have no potential conflicts of interest, including any relevant financial interests, activities, relationships, or affiliations. During the preparation of this manuscript, AI tools were used solely for language polishing and grammar checking.
Acknowledgements
The authors thank all the patients who participated in this study for their cooperation. This research received no funding.
Materials
| Name | Company | Catalog Number | Comments |
|---|---|---|---|
| 0.9% Sodium Chloride Injection (Normal Saline) | Sichuan Kelun Pharmaceutical Co., Ltd. | China National Drug Approval No. H51021156 | Specification: 100 mL: 0.9 g; used as diluent to mix lidocaine and epinephrine for preparing local anesthetic solution in microneedle radiofrequency therapy for axillary osmidrosis |
| Adobe Photoshop | Adobe Inc. | Version 2024 | Software used for image editing |
| Epinephrine Hydrochloride Injection | Yuanda Pharmaceutical (China) Co., Ltd. | China National Drug Approval No. H42021700 | Specification: 1 mL:1 mg, 10 pieces per box; mixed with lidocaine for subcutaneous injection to induce vasoconstriction, reduce intraoperative bleeding and prolong local anesthetic effect during microneedle radiofrequency therapy for axillary osmidrosis |
| GraphPad Prism | GraphPad Software, Inc. | Version 10.1.2 | Software for plotting statistical graphs and visualizing research outcome data |
| High-frequency surgical electrode (treatment tip) | Peninsula Medical Co., Ltd. | Pure S4 | EO sterile medical treatment tip, applied for apocrine gland thermal ablation in microneedle radiofrequency therapy for axillary osmidrosis. This tip featured a 3 × 5 rectangular arrays of microneedles. |
| Lidocaine Hydrochloride Injection | Southwest Pharmaceutical Co., Ltd. (Taiji Group) | China National Drug Approval No. H50020038 | Specification: 5 mL: 0.1 g, 5 pieces per box; local infiltrative anesthetic mixed with epinephrine hydrochloride injection for subcutaneous anesthesia prior to microneedle radiofrequency treatment of axillary osmidrosis |
| SPSS (Statistical Package for the Social Sciences) | IBM Corporation | Version 27 | Statistical software for baseline characteristic comparison, efficacy and safety data analysis |
| United III Radiofrequency Therapeutic System | Peninsula Medical Co., Ltd. | United III-RF | Radiofrequency host system, matched with Pure S4 sterile microneedle electrodes for axillary osmidrosis ablation. |
References
- Lam TH, et al. Understanding the microbial basis of body odor in pre-pubescent children and teenagers. Microbiome. 2018;6(1):213.
- Minhas GS, et al. Structural basis of malodour precursor transport in the human axilla. eLife. 2018;7.
- Bang YH, et al. Histopathology of apocrine bromhidrosis. Plast Reconstr Surg. 1996;98(2):288-92.
- Kaminaka C, et al. Clinical and histological evaluation of a single high-energy microwave treatment for primary axillary hyperhidrosis in Asians: a prospective, randomized, controlled, split-area comparative trial. Lasers Surg Med. 2019;51(7):592-9.
- Grove GL, et al. Local procedures for axillary hyperhidrosis and osmidrosis: a systematic review of prospective and controlled clinical trials. JEADV Clin Pract. 2024;3(4):972-1004.
- Lin L, Huo R, Bi J, Meng Z, Cao Y. Fractional microneedling radiofrequency treatment for axillary osmidrosis: a minimally invasive procedure. J Cosmet Dermatol. 2019;18(1):115-20.
- Zhang J, Han P, Yang F, Jiang B. Advances in the treatment of axillary bromhidrosis. Skin Res Technol. 2024;30(8):e13895.
- Zhang Y, Li Y, Li C, Tian J. Experience of negative pressure fractional microneedle radiofrequency therapy for axillary osmidrosis: a case study. Arch Dermatol Res. 2024;317(1):66.
- Xing W, Liu W, Zhao Z, Peng J, Li X, Ma Y, Wang N. Distribution of apocrine sweat glands in the axillary region of patients with axillary osmidrosis. Chin J Dermatol. 2014;47(3):203-5.
- Hopewell S, et al. CONSORT 2025 statement: updated guideline for reporting randomized trials. BMJ. 2025;389:e081123.
- Park YJ, Shin MS. What is the best method for treating osmidrosis? Ann Plast Surg. 2001;47(3):303-9.
- Xu S, Gao L, Liu Q, Yao P, Hu F. Clinical application of optical fiber technique combined with curettage in the minimally invasive treatment of axillary osmidrosis. Asian J Surg. 2025;48(8):4772-7.
- Yao Z, et al. Blunt dissection of the axillary flap through double mini-incisions on both sides of the axilla to prevent postoperative hematoma. Plast Reconstr Surg. 2025;155(5):923e-7e.
- Feng J, Zhang L, Qi J, Huang L. Histological damage characteristics and quantitative analysis of porcine skin with non-insulated microneedle radiofrequency. Skin Res Technol. 2023;29(6):e13396.
- Fredman G, Christensen RL, Ortner VK, Haedersdal M. Visualization of energy-based device-induced thermal tissue alterations using bimodal ex-vivo confocal microscopy with digital staining: a proof-of-concept study. Skin Res Technol. 2022;28(4):564-70.
- Fatemi Naeini F, Abtahi-Naeini B, Pourazizi M, Nilforoushzadeh MA, Mirmohammadkhani M. Fractionated microneedle radiofrequency for treatment of primary axillary hyperhidrosis: a sham control study. Australas J Dermatol. 2015;56(4):279-84.
- Kim M, Shin JY, Lee J, Kim JY, Oh SH. Efficacy of fractional microneedle radiofrequency device in the treatment of primary axillary hyperhidrosis: a pilot study. Dermatology. 2013;227(3):243-9.
- Zhang P, Li D, Li L, Pan S. Effectiveness and safety of the improved mini-incision surgery for osmidrosis treatment. J Cosmet Dermatol. 2021;20(12):3986-90.
- Van TN, et al. The effectiveness of local surgical technique in treatment of axillary bromhidrosis. Open Access Maced J Med Sci. 2019;7(2):187-91.
- Wang Y, Xie S. Intraoperative hypertonic saline irrigation preventing seroma formation in the treatment of axillary bromhidrosis. Aesthetic Plast Surg. 2024;48(17):3216-21.
- Xu S, et al. Negative pressure-assisted rubbing suction technique for the treatment of axillary osmidrosis based on the minimally invasive principle. Asian J Surg. 2025;48(1):402-8.
- Zhang J, et al. Power-assisted rotary cutter with negative pressure suction through a small incision for axillary osmidrosis. Dermatol Ther. 2022;35(8):e15615.
- Kim DH, et al. Effect of 27-MHz radiofrequency on hair follicles: histological evaluation of skin treated ex vivo. Dermatol Surg. 2015;41(4):466-72.
- Zheng Z, Goo B, Kim DY, Kang JS, Cho SB. Histometric analysis of skin-radiofrequency interaction using a fractionated microneedle delivery system. Dermatol Surg. 2014;40(2):134-41.
- Zhang B, Huang L. Subcutaneous tissue necrosis with fat liquefaction, hematoma, and inflammatory mass after microwave-based treatment for axillary hyperhidrosis. J Cosmet Dermatol. 2022;21(10):4365-9.
- Morioka D, Nomura M, Lan L, Tanaka R, Kadomatsu K. Axillary osmidrosis: past, present, and future. Ann Plast Surg. 2020;84(6):722-8.
- Shin JY, Roh SG, Lee NH, Yang KM. Osmidrosis treatment approaches: a systematic review and meta-analysis. Ann Plast Surg. 2017;78(3):354-9.
- Li Y, et al. A retrospective study on comparing the surgery and microneedles radiofrequency and microwaves treatment in axillary osmidrosis. J Dermatolog Treat. 2022;33(1):420-6.
- Chen SQ, Wang TT, Zhou Y, Li W, Man XY. Comparison of long-term effectiveness and safety of microwave and surgery in the treatment of axillary osmidrosis: a single-center retrospective study. Dermatol Surg. 2022;48(1):126-30.
- Malik AS, Porter CL, Feldman SR. Bromhidrosis treatment modalities: a literature review. J Am Acad Dermatol. 2023;89(1):81-9.
- Wang YH, Cheng CY, Chang SL, Hu S, Huang YL. A single session of high-energy microwave axillary hyperhidrosis and osmidrosis therapy: key pretherapeutic assessment and outcome analysis. Lasers Surg Med. 2023;55(4):372-7.
- Kim WO. Treatment of palmar hyperhidrosis with radiofrequency microneedling based on ultrasound measurements. J Ultrasound Med. 2024;43(4):807-9.