This article describes a retrospective clinical data analysis workflow for evaluating serial heparin-binding protein measurements and their association with organ dysfunction, disease severity, and short-term outcomes in children with sepsis admitted to a pediatric intensive care unit.
Research Article
Predictive Value of Heparin-Binding Protein for Organ Dysfunction and Disease Severity in Pediatric Sepsis: A Retrospective Study
93 views
⸱
September 11th, 2026
* These authors contributed equally
In This Article
Summary
Abstract
Early risk stratification in pediatric sepsis remains difficult because conventional inflammatory markers do not fully reflect endothelial injury or microcirculatory dysfunction. This single-center retrospective observational study evaluated whether heparin-binding protein provides prognostic information for organ dysfunction and disease severity in children with sepsis admitted to the pediatric intensive care unit. A total of 150 children with sepsis admitted to the People’s Hospital of Guangxi Zhuang Autonomous Region, China, were included. Heparin-binding protein and routine inflammatory markers were measured within 24 h of admission and again approximately 48 h later. Absolute and relative short-term changes in the heparin-binding protein were calculated. Outcomes included pediatric Sequential Organ Failure Assessment-defined early organ dysfunction progression, high illness severity, organ support requirements, and 28-day all-cause mortality. Prognostic performance was assessed using receiver operating characteristic analysis, multivariable logistic regression, Cox regression, calibration assessment, and reclassification metrics. Higher baseline heparin-binding protein levels and unfavorable early trajectories were associated with greater organ dysfunction, higher illness severity, and more frequent use of mechanical ventilation, vasoactive therapy, and renal replacement therapy. Heparin-binding protein demonstrated superior discriminative performance compared with conventional inflammatory biomarkers and remained independently associated with adverse outcomes after adjustment for organ dysfunction scores and routine laboratory indices. Adding heparin-binding protein metrics to models containing clinical scores and standard biomarkers improved discrimination and risk reclassification. These findings suggest that early, serial heparin-binding protein assessment may provide useful prognostic information and complement existing risk assessment frameworks for pediatric sepsis in the pediatric intensive care unit.
Introduction
Sepsis is an infection-triggered dysregulated host response that causes life-threatening organ dysfunction and remains a major cause of mortality and disability in pediatric intensive care1. Recent epidemiological and clinical evidence indicate that pediatric sepsis continues to impose a substantial global burden, with children admitted to the pediatric intensive care unit (PICU) facing high risks of circulatory instability, respiratory failure, and multiple organ dysfunction2. Current management emphasizes early recognition and timely intervention, including antimicrobial therapy, fluid resuscitation, vasoactive support, respiratory support, and organ replacement therapy when clinically indicated. In routine PICU practice, treatment intensity and resource allocation are commonly guided by dynamic assessment frameworks based on organ dysfunction and illness-severity scores. Although these approaches have improved the standardization of sepsis care, early identification of children at high risk during the initial PICU course remains difficult in this clinically heterogeneous population3.
Early manifestations of pediatric sepsis in the PICU are often nonspecific4. Risk stratification is further complicated by age-related physiological differences, comorbidities, infection source, immune status, and prior treatment exposure. Traditional inflammatory markers, such as C-reactive protein (CRP), procalcitonin (PCT), and white blood cell count (WBC), reflect systemic inflammatory activation but do not fully capture the biological processes that directly contribute to organ dysfunction. In particular, they do not specifically reflect endothelial injury, microcirculatory perfusion disturbance, or capillary leakage, which are central to the progression of sepsis-related organ failure5. Severity scoring systems provide a broader clinical picture but usually require multiple variables and repeated measurements. As a result, score calculation may lag behind the early decision-making window in which clinicians need to identify children likely to develop progressive organ dysfunction. This creates a need for biomarkers that are both biologically relevant and operationally feasible for early PICU risk assessment6.
Heparin-binding protein (HBP), released predominantly by activated neutrophils, promotes endothelial permeability and capillary leakage and has been associated with hypotension, impaired tissue perfusion, and organ dysfunction in severe infection and sepsis7. Compared with conventional inflammatory biomarkers, HBP may more directly reflect disruption of the endothelial-microcirculatory axis before marked changes in composite clinical scores become apparent. Albumin, by contrast, is affected by capillary leakage, inflammatory consumption, vascular permeability, and critical illness-related protein loss. Therefore, the HBP-to-albumin ratio may provide a composite signal that links neutrophil-driven endothelial activation with loss of circulating protein reserve. This pathophysiological rationale supported the exploratory evaluation of the HBP-to-albumin ratio as a severity-related index in the present study.
Prior studies in patients with severe infection or sepsis have reported associations between HBP levels and illness severity, organ support requirements, and adverse outcomes. Some evidence also suggests that short-term HBP dynamics may improve risk reclassification beyond single-time-point measurements8. However, evidence in PICU-based pediatric populations remains limited. Existing studies vary in sampling windows, endpoint definitions, and threshold strategies, and practical approaches for integrating serial HBP measurements into pediatric sepsis risk assessment remain unclear. In addition, whether age-related clinical heterogeneity modifies the prognostic value of HBP remains inadequately addressed.
Therefore, this study evaluated the predictive value of early HBP levels and short-term HBP dynamics in children with sepsis treated in the PICU using a real-world retrospective cohort. We compared HBP with commonly used inflammatory biomarkers, assessed its association with pediatric Sequential Organ Failure Assessment (pSOFA)-defined organ dysfunction, and examined its incremental prognostic value when added to routine clinical and laboratory indicators. Age-stratified findings and organ support-related severity measures were also considered to address clinically relevant heterogeneity. By presenting a retrospective clinical data analysis workflow aligned with mechanisms of endothelial injury and organ dysfunction, this study aimed to determine whether early, serial HBP assessment can complement existing risk assessment frameworks for pediatric sepsis in the PICU.
Protocol
This study was approved by the institutional ethics committee of the People’s Hospital of Guangxi Zhuang Autonomous Region (IRB approval no. KY-ZC-2023-035). The requirement for informed consent was waived because this retrospective analysis used de-identified clinical data collected during routine care.
Study design and setting
This was a single-center retrospective observational cohort study conducted in the Pediatric Intensive Care Unit (PICU) of the People’s Hospital of Guangxi Zhuang Autonomous Region. Consecutive PICU admissions between January 1, 2022, and December 31, 2025, were screened. Clinical and laboratory data were extracted from the electronic medical record system, laboratory information system (LIS), and critical care information system.
PICU admission time was defined as time zero for all exposure, biomarker, organ support, and outcome windows. Before data extraction, the eligibility criteria, biomarker sampling windows, endpoint definitions, severity metrics, and statistical analysis plan were prespecified and implemented using a fixed extraction workflow (LIS extraction specification version 1.0; clinical data dictionary version 1.0). After extraction, all records were de-identified. Two investigators independently verified timestamps and source consistency for biomarker values, pediatric Sequential Organ Failure Assessment (pSOFA)-related variables, vasoactive therapy records, and organ support events. Discrepancies were resolved by joint review of source records. Cohort assembly followed prespecified steps, including screening, eligibility confirmation, biomarker-window confirmation, and endpoint completeness review. The final cohort flow is shown in Figure 1.
Participants and eligibility criteria
Children aged 1 month to 14 years admitted to the PICU with sepsis were eligible. Candidate cases were identified from PICU admission records and sepsis-related diagnoses, then confirmed by manual chart review. Sepsis was defined as suspected or confirmed infection with organ dysfunction documented during PICU care and supported by pSOFA-based assessment.
To ensure comparable early biomarker exposure, included patients were required to have both heparin-binding protein (HBP) and C-reactive protein (CRP) measured within 24 h of PICU admission and to have sufficient data for pSOFA calculation. Inclusion criteria were age 1 month to 14 years, PICU admission with sepsis, HBP, and CRP available within 0–24 h, and complete data for primary endpoint adjudication, including baseline pSOFA, 72-h pSOFA assessment, and survival follow-up. Exclusion criteria were missing baseline HBP or CRP, PICU stay <24 h, missing key variables required for endpoint adjudication, or severe immunosuppression likely to substantially alter inflammatory biomarker profiles. Severe immunosuppression was defined as active hematologic malignancy, receipt of chemotherapy or transplantation-related immunosuppressive therapy, long-term systemic corticosteroid therapy at an immunosuppressive dose, primary immunodeficiency, or other documented intensive immunosuppressive treatment before or during PICU admission. For repeated PICU admissions, only the first eligible admission was included.
Definitions of outcomes and severity metrics
The primary endpoint was early organ dysfunction progression within 72 h after PICU admission, defined as an increase of 2 or more points in pSOFA from baseline to the highest pSOFA recorded during the first 72 h (ΔpSOFA ≥ 2). Baseline pSOFA was the first pSOFA score recorded within 0–24 h after PICU admission; if multiple values were available, the score closest to the admission timestamp was used. The 72-h pSOFA value was defined as the peak pSOFA recorded during 0–72 h.
High illness severity was defined a priori as a 72-h peak pSOFA ≥ 8, and this threshold was applied uniformly in categorical analyses. This threshold was prespecified based on the unit’s severity stratification practice and its clinical interpretability for early identification of high-risk pediatric sepsis. pSOFA was also analyzed as a continuous measure of organ dysfunction burden.
Secondary outcomes were septic shock, invasive mechanical ventilation, vasoactive drug use, continuous renal replacement therapy (CRRT), PICU mortality, and 28-day all-cause mortality. Septic shock was defined as persistent circulatory failure requiring vasoactive support after fluid resuscitation, with documented tissue hypoperfusion, including elevated lactate and/or abnormal peripheral perfusion findings. Organ support outcomes were coded as binary variables within prespecified early windows. To provide a more granular measure of hemodynamic support, the vasoactive-inotropic score (VIS) was also extracted or calculated for patients receiving vasoactive therapy during the first 24 h after PICU admission. VIS was used as a quantitative organ support intensity variable in correlation and severity association analyses, while binary vasoactive therapy use was retained as a clinically interpretable treatment-requirement outcome.
Biomarker measurement and data collection
HBP and CRP were measured in the central laboratory using standardized automated immunoassay workflows, in accordance with routine clinical quality-control procedures. Biomarker testing was performed on venous blood samples collected as part of routine PICU care and processed according to the laboratory’s standard pre-analytical workflow. HBP results were reported in ng/mL, and CRP results were reported in mg/L. HBP was measured using a particle-enhanced immunoturbidimetric assay on a fully automated clinical chemistry/immunoassay platform. CRP was measured using a high-sensitivity immunoturbidimetric assay. The analytical workflow and internal quality-control procedures followed a version-controlled laboratory protocol (laboratory SOP version 2022.1) and remained unchanged in core analytical logic during the study period.
Laboratory records were exported from the LIS using a locked query and field-mapping workflow (LIS extraction specification version 1.0), including both blood draw time and report time. Baseline HBP and CRP were defined as the first reported values within 0–24 h after PICU admission. Day 2 HBP and CRP were defined as the measurements closest to 48 h within a fixed 36–60 h window. This Day 2 window was consistently used across all dynamic analyses.
Absolute HBP change was calculated as Day 2 HBP minus baseline HBP. Relative HBP change (%) was calculated as [(Day 2 HBP − baseline HBP) / baseline HBP] × 100. If baseline HBP was below the assay quantification limit or recorded as zero after system conversion, relative HBP change was not calculated; these patients were retained in analyses using baseline HBP and absolute HBP change but excluded from percentage-change analyses. The HBP-to-albumin ratio was calculated by dividing HBP by serum albumin measured within the corresponding time window and was evaluated as an exploratory composite index reflecting endothelial activation and capillary leakage-related protein loss.
In addition to HBP and CRP, routinely available inflammatory, perfusion-related, and organ function markers were extracted for comparison and multivariable models. These included white blood cell count, procalcitonin, lactate, albumin, creatinine, platelet count, coagulation variables, and liver function variables when available. Interleukin-6 (IL-6) and interleukin-8 (IL-8) values were extracted from the LIS when they had been measured as part of routine clinical evaluation within the same early assessment windows. IL-6 and IL-8 were not required for cohort inclusion and were used only in analyses where available. This rule was applied to avoid excluding otherwise eligible patients solely because cytokine testing was not routinely performed in all cases.
Demographics, comorbidities, infection source, microbiological findings when available, PICU admission vital signs, early antimicrobial treatment, resuscitation measures, and organ support interventions were extracted from the electronic medical record and the critical care information system using the predefined clinical data dictionary (version 1.0). Organ support variables included invasive mechanical ventilation, vasoactive therapy, CRRT, fluid bolus volume, and VIS during the first 24 h when applicable. Variables required for pSOFA were collected within prespecified windows. If an automatically generated pSOFA component was inconsistent with source values, two investigators reviewed the chart and recalculated the score using the prespecified scoring rules. Data quality control included timestamp validation, duplicate screening, range and distribution checks, source verification of extreme values, and audit logging of manual corrections.
To preserve reproducibility while avoiding unnecessary brand-specific wording in the main protocol text, assay documentation was recorded by method class, platform type, software environment, reportable-range rules, calibrator and control use, and internal quality-control procedures. Detailed information on reagents, calibrators, controls, and software is provided in the Materials Table. Internal quality control was performed daily, and only laboratory runs meeting the laboratory’s coefficient-of-variation acceptance criteria were included. Values below the lower quantification limit were set to the lower reportable limit. Values above the upper reportable range were set to the upper reportable limit unless a validated repeat result from the same sample was available. Laboratory units were checked for consistency before analysis; no unit conversion was performed unless an LIS unit mismatch was confirmed against the source report.
Missing data and data handling rules
Data handling rules were prespecified. Patients missing baseline HBP, baseline CRP, baseline pSOFA variables, or 72-h pSOFA variables were excluded from primary endpoint analyses. Patients missing Day 2 HBP were retained in baseline biomarker analyses and overall clinical outcome summaries but excluded from analyses requiring dynamic HBP indices. Patients without IL-6 or IL-8 measurements were retained in all primary analyses and excluded only from comparisons of cytokine-containing models.
Complete-case analysis was used for each multivariable model, and the analysis-specific sample size was reported. Multiple imputation was not used in the primary analyses because the study focused on time-locked trajectories of observed biomarkers and organ dysfunction. The potential for selection bias caused by excluding patients without baseline HBP, baseline CRP, or complete pSOFA endpoint data was considered when interpreting the findings.
Extreme laboratory values were not excluded solely on statistical grounds. Outliers were checked against source records and retained if confirmed as true values. Only clear documentation errors or unit-entry errors were corrected, and all corrections were recorded in the audit log with traceable identifiers.
Statistical analysis
All analyses followed a prespecified statistical analysis plan (analysis specification version 1.0). Continuous variables were assessed by histogram inspection and the Shapiro-Wilk test. Normally distributed variables were summarized as mean ± standard deviation and compared using independent-samples t-tests. Non-normally distributed variables were summarized as median (interquartile range) and compared using the Mann-Whitney U test. Categorical variables were summarized as counts (percentages) and compared using the chi-square test or Fisher’s exact test.
For descriptive analyses, patients were stratified by quartiles of baseline HBP and separately by the presence or absence of early organ dysfunction progression (ΔpSOFA ≥ 2). Baseline HBP quartiles were used to describe dose-response patterns across the observed biomarker distribution without assuming a universal clinical cutoff, because validated pediatric HBP thresholds for sepsis severity remain uncertain and may vary by assay platform, age distribution, and sampling window. Age was analyzed as a continuous covariate in primary models. To address age-related clinical heterogeneity, prespecified subgroup analyses were also performed using age strata of <1 year and ≥1 year, with additional exploratory age-category checks performed when sample size allowed.
Associations between HBP metrics, including baseline HBP, Day 2 HBP, absolute HBP change, relative HBP change, and HBP-to-albumin ratio, and clinical severity indicators were assessed using Spearman rank correlation coefficients. Variables reflecting early organ support, including invasive mechanical ventilation, vasoactive therapy, CRRT, fluid bolus volume, ventilator days, PICU length of stay, and VIS, were treated as clinical severity and management correlates in descriptive and association analyses.
Discriminative performance for early organ dysfunction progression and high illness severity was evaluated using receiver operating characteristic (ROC) curves. The area under the ROC curve (AUC) and 95% confidence intervals were calculated for HBP, CRP, procalcitonin, lactate, albumin, pSOFA, HBP-to-albumin ratio, and combined models. AUCs were compared using the DeLong test. Optimal cut-off values were identified by the Youden index, and sensitivity, specificity, positive predictive value, negative predictive value, and likelihood ratios were reported.
Multivariable logistic regression was used to estimate independent associations between HBP metrics and the binary severity outcomes, including early organ dysfunction progression and high illness severity. Covariates were selected a priori based on clinical relevance and data availability and included age, infection source category, baseline pSOFA, lactate, albumin, procalcitonin, CRP, septic shock at admission, and early organ support variables when appropriate. Primary prediction models for early severity outcomes were restricted to variables available within the prespecified early assessment window to reduce temporal overlap with outcome evolution. Incremental prognostic value was evaluated by sequentially adding HBP variables to the baseline clinical model. For 28-day all-cause mortality, Cox proportional hazards regression was used, and the proportional hazards assumption was checked using Schoenfeld residuals. Before model fitting, collinearity among candidate predictors was assessed, and the number of covariates included in each model was limited to preserve an adequate events-per-variable ratio.
Model improvement after adding HBP was evaluated using discrimination, calibration, and reclassification metrics. Calibration was assessed using calibration plots, calibration intercept and slope, and the Brier score, with the Hosmer-Lemeshow test reported as a supplementary calibration check. Reclassification was quantified using continuous net reclassification improvement and integrated discrimination improvement. Prespecified sensitivity analyses included narrowing the Day 2 sampling window from 36–60 h to 42–54 h, repeating analyses with a stricter organ dysfunction progression definition (ΔpSOFA ≥ 3), excluding clinically atypical extreme biomarker values after source verification, and repeating key models after excluding patients without complete dynamic HBP measurements. Sensitivity analyses were reported in the Results section or supplementary tables, as appropriate.
Statistical analyses were performed in R version 4.3.2 using a locked analysis environment (analysis environment release v1.0). Key packages were pROC version 1.18.5 for ROC analyses, survival version 3.5-7 for time-to-event models, and rms version 6.8-0 for calibration analyses. Continuous net reclassification improvement and integrated discrimination improvement were calculated using validated routines implemented in the prespecified analysis script set (script package set v1.0). All tests were two-sided, and p < 0.05 was considered statistically significant.
Results
Baseline characteristics by HBP strata and early organ dysfunction progression status
A total of 150 children with sepsis were included in the final analysis cohort. When patients were stratified by baseline heparin-binding protein (HBP) quartiles, baseline HBP increased from 21.1 ng/mL (interquartile range [IQR], 15.9–26.2) in Q1 to 262.8 ng/mL (IQR, 201.6–308.7) in Q4 (p < 0.001; Table 1). Age, sex, body weight, and chronic comorbidity were broadly comparable across quartiles. In contrast, infection source, hemodynamic instability, organ dysfunction burden, and early organ support requirements showed clear severity gradients. Bloodstream infection was more frequent in higher HBP quartiles. Heart rate increased and mean arterial pressure decreased across quartiles. Baseline pediatric Sequential Organ Failure Assessment (pSOFA) score increased from 5 (IQR, 3–8) in Q1 to 9 (IQR, 7–12) in Q4 (p < 0.001), and septic shock at admission increased from 18.9% to 42.1% (p < 0.001). Mechanical ventilation within 24 h, vasoactive support within 24 h, and continuous renal replacement therapy (CRRT) within 72 h were also more frequent in higher HBP strata. Laboratory findings showed the same direction, with higher C-reactive protein (CRP), procalcitonin, lactate, and creatinine levels and lower albumin and platelet counts in the higher HBP quartiles.
Patients with early organ dysfunction progression within 72 h, defined as ΔpSOFA ≥ 2, showed a more severe baseline profile than those without progression (Table 2). The progression group had higher white blood cell counts, higher neutrophil percentages, lower platelet counts, and more pronounced coagulation abnormalities, including higher international normalized ratio, longer activated partial thromboplastin time, lower fibrinogen levels, and higher D-dimer values. Perfusion and metabolic indicators were also worse in the progression group, including higher lactate, lower pH, more negative base excess, higher creatinine, higher urea nitrogen, higher total bilirubin, higher alanine aminotransferase, lower albumin, higher glucose, and modestly lower sodium. Early therapeutic intensity was greater in this group, with more frequent fluid bolus administration, vasoactive support, mechanical ventilation, systemic corticosteroid use, albumin infusion, packed red blood cell transfusion, and CRRT, as well as a longer pediatric intensive care unit stay. These findings indicate that higher HBP levels were aligned with broader clinical deterioration rather than representing an isolated biomarker abnormality.
Short-term biomarker dynamics and severity trajectories
Serial biomarker trajectories showed early separation between children with and without progression of organ dysfunction (Figure 2). Children with ΔpSOFA ≥ 2 had higher baseline CRP and HBP, which remained elevated during the first 72 h after pediatric intensive care unit admission. HBP showed a clearer separation than CRP: in the progression group, HBP increased from baseline and remained elevated during early follow-up, whereas in the non-progression group, HBP remained lower and generally declined after the early peak. The relative HBP change from baseline to Day 2 further separated the two groups, with larger positive changes in patients who developed early organ dysfunction.
Trajectory analysis by clinical severity strata showed a similar pattern (Figure 3). HBP was persistently higher in the septic shock and severe sepsis groups than in the sepsis group. Lactate and procalcitonin were also higher in the more severe strata and declined over time, whereas albumin was lower and recovered more slowly. pSOFA scores and the HBP-to-albumin ratio remained higher in more severe strata, supporting the link between dynamic HBP behavior, endothelial injury-related protein loss, perfusion disturbance, and organ dysfunction burden.
Correlation between HBP, illness severity, and organ support
Baseline and dynamic HBP metrics were significantly correlated with illness severity, perfusion disturbance, and organ support intensity (Table 3). Baseline HBP correlated with baseline pSOFA score (r = 0.46, 95% confidence interval [CI], 0.39–0.53; p < 0.001) and Day 2 pSOFA score (r = 0.41, 95% CI, 0.33–0.48; p < 0.001). It was also positively correlated with lactate (r = 0.38, 95% CI, 0.30–0.45; p < 0.001), CRP (r = 0.29, 95% CI, 0.20–0.37; p < 0.001), and procalcitonin (r = 0.33, 95% CI, 0.24–0.41; p < 0.001), and negatively correlated with albumin (r = −0.34, 95% CI, −0.42 to −0.26; p < 0.001). The HBP-to-albumin ratio showed the strongest correlation with severity among the tested HBP-related indicators (r = 0.62, 95% CI, 0.56–0.67; p < 0.001).
Baseline HBP was also correlated with organ support intensity and resource use. It correlated with ventilator days during the first 28 days (r = 0.27, 95% CI, 0.18–0.35; p < 0.001), pediatric intensive care unit length of stay (r = 0.23, 95% CI, 0.14–0.31; p < 0.001), total vasoactive-inotropic score during the first 24 h (r = 0.35, 95% CI, 0.27–0.43; p < 0.001), and fluid bolus volume within 24 h (r = 0.21, 95% CI, 0.12–0.29; p < 0.001). It was also correlated with mechanical ventilation within 24 h (r = 0.30, 95% CI, 0.21–0.38; p < 0.001), vasoactive support within 24 h (r = 0.36, 95% CI, 0.28–0.44; p < 0.001), and CRRT within 72 h (r = 0.19, 95% CI, 0.10–0.28; p < 0.001). Day 2 HBP correlated with Day 2 pSOFA score (r = 0.52, 95% CI, 0.45–0.58; p < 0.001), and relative HBP change correlated with ΔpSOFA (r = 0.40, 95% CI, 0.32–0.47; p < 0.001) and higher 28-day mortality risk (r = 0.24, 95% CI, 0.15–0.33; p < 0.001).
Predictive performance for early organ dysfunction progression and high illness severity
The discriminative performance of HBP and comparator markers is summarized in Table 4 and illustrated by the receiver operating characteristic curves in Figure 4. For early organ dysfunction progression, baseline HBP showed higher discrimination than conventional biomarkers and baseline pSOFA. The area under the receiver operating characteristic curve (AUC) for baseline HBP was 0.82 (95% CI, 0.79–0.86), compared with 0.64 (95% CI, 0.59–0.69) for baseline CRP, 0.71 (95% CI, 0.66–0.76) for procalcitonin, 0.73 (95% CI, 0.68–0.77) for lactate, 0.70 (95% CI, 0.65–0.75) for albumin, and 0.76 (95% CI, 0.72–0.80) for baseline pSOFA. Day 2 HBP further improved discrimination, with an AUC of 0.88 (95% CI, 0.85–0.91), sensitivity of 82.7%, specificity of 80.6%, negative predictive value of 90.5%, and Youden index of 0.63 at a cut-off value of 126.0 ng/mL.
The HBP-to-albumin ratio also showed strong discriminative performance. The baseline HBP-to-albumin ratio had an AUC of 0.84 (95% CI, 0.81–0.88), and the Day 2 HBP-to-albumin ratio had an AUC of 0.89 (95% CI, 0.86–0.92), with a sensitivity of 83.5%, specificity of 81.8%, negative predictive value of 91.0%, and Youden index of 0.65 at a cut-off value of 3.60. Combined models performed better than single predictors (Figure 5). The baseline model combining HBP and pSOFA achieved an AUC of 0.90 (95% CI, 0.87–0.92), and the model combining HBP, lactate, and albumin achieved an AUC of 0.91 (95% CI, 0.88–0.93). Day 2 combined models showed the highest performance: HBP combined with CRP and procalcitonin achieved an AUC of 0.93 (95% CI, 0.91–0.95), while the HBP-to-albumin ratio combined with interleukin-6 and interleukin-8 achieved an AUC of 0.94 (95% CI, 0.92–0.96), with sensitivity of 89.6%, specificity of 86.4%, negative predictive value of 94.4%, accuracy of 87.4%, and Youden index of 0.76.
Because interleukin-6 and interleukin-8 were available only when ordered during routine care, cytokine-containing models were analyzed in the available-case subset and were interpreted as secondary model comparisons rather than primary prediction models.
Independent associations with early organ dysfunction progression and high illness severity
In multivariable logistic regression models, HBP remained independently associated with both early organ dysfunction progression and high illness severity (Table 5). For early organ dysfunction progression, Day 2 HBP was associated with increased odds of progression (adjusted odds ratio [aOR] per 10 ng/mL increase, 1.18; 95% CI, 1.12–1.24; p < 0.001). Relative HBP change from baseline to Day 2 was also independently associated with progression (aOR per 10% increase, 1.09; 95% CI, 1.04–1.14; p < 0.001). Baseline pSOFA (aOR per 1-point increase, 1.23; 95% CI, 1.14–1.33; p < 0.001), lactate (aOR per 1 mmol/L increase, 1.28; 95% CI, 1.13–1.45; p < 0.001), septic shock at admission (aOR, 2.16; 95% CI, 1.42–3.30; p < 0.001), and mechanical ventilation within 24 h (aOR, 2.02; 95% CI, 1.32–3.10; p = 0.001) were also independently associated with progression. Baseline albumin was inversely associated with progression (aOR per 1 g/L increase, 0.93; 95% CI, 0.90–0.97; p < 0.001). CRP was not independently associated after adjustment.
For high illness severity, Day 2 HBP remained independently associated with higher odds of 72-h peak pSOFA ≥ 8 (aOR per 10 ng/mL increase, 1.15; 95% CI, 1.10–1.21; p < 0.001). Relative HBP change was also independently associated with high illness severity (aOR per 10% increase, 1.07; 95% CI, 1.02–1.12; p = 0.006). Baseline pSOFA (aOR, 1.31; 95% CI, 1.21–1.43; p < 0.001), lactate (aOR, 1.21; 95% CI, 1.08–1.36; p = 0.001), septic shock at admission (aOR, 2.43; 95% CI, 1.60–3.71; p < 0.001), and mechanical ventilation within 24 h (aOR, 1.90; 95% CI, 1.25–2.90; p = 0.003) remained significant. Albumin showed an inverse association (aOR, 0.95; 95% CI, 0.92–0.98; p = 0.002). The models showed strong discrimination, with C-statistics of 0.90 for early organ dysfunction progression and 0.91 for high illness severity.
Incremental value of adding HBP to the base model
Adding HBP metrics to the base model improved model performance for both predefined severity outcomes (Table 6). The base model included pSOFA, lactate, albumin, procalcitonin, and CRP, and the extended model added Day 2 HBP and relative HBP change. For early organ dysfunction progression, adding HBP increased the AUC by 0.14 (95% CI, 0.10–0.18; p < 0.001). Net reclassification improvement was 0.31 (95% CI, 0.18–0.44; p < 0.001), and integrated discrimination improvement was 0.072 (95% CI, 0.044–0.103; p < 0.001). The Brier score decreased from 0.168 to 0.132, the calibration intercept moved from 0.08 to 0.03, the calibration slope improved from 0.86 to 0.97, and the Hosmer-Lemeshow p-value increased from 0.09 to 0.41.
For high illness severity, adding HBP increased the AUC by 0.13 (95% CI, 0.09–0.17; p < 0.001). Net reclassification improvement was 0.28 (95% CI, 0.15–0.42; p < 0.001), and integrated discrimination improvement was 0.061 (95% CI, 0.034–0.091; p < 0.001). The Brier score decreased from 0.162 to 0.129, the calibration intercept improved from 0.07 to 0.02, the calibration slope improved from 0.88 to 0.98, and the Hosmer-Lemeshow p-value increased from 0.12 to 0.46. These results indicate that HBP improved discrimination, calibration, and individual risk reclassification beyond conventional clinical and laboratory indicators.
Sensitivity analyses
Prespecified sensitivity analyses were performed to evaluate the robustness of the association between HBP metrics and early severity outcomes (Supplementary Table 1). When the Day 2 biomarker window was narrowed from 36–60 h to 42–54 h, Day 2 HBP remained independently associated with early organ dysfunction progression (aOR per 10 ng/mL increase, 1.16; 95% CI, 1.10–1.23; p < 0.001) and high illness severity (aOR, 1.14; 95% CI, 1.08–1.20; p < 0.001). When early organ dysfunction progression was redefined using a stricter threshold of ΔpSOFA ≥ 3, Day 2 HBP remained associated with progression (aOR, 1.19; 95% CI, 1.12–1.27; p < 0.001), and relative HBP change also remained significant (aOR per 10% increase, 1.08; 95% CI, 1.03–1.14; p = 0.003). After excluding source-verified clinically atypical extreme HBP values, the associations remained directionally unchanged. In the complete dynamic HBP cohort, Day 2 HBP and relative HBP change remained associated with both early organ dysfunction progression and high illness severity. These sensitivity analyses did not materially alter the main findings.
Time-dependent prediction and 28-day mortality
Time-dependent AUC analysis showed that HBP-based models maintained discriminative performance for 28-day all-cause mortality across follow-up (Figure 6). The highest time-dependent AUC values occurred during the early follow-up period, and the advantage of combined HBP-based models gradually narrowed over time. Time-dependent receiver operating characteristic curves showed the same pattern at selected follow-up points (Figure 7), with HBP-based and combined models generally outperforming CRP alone. These findings support the role of HBP as an early risk stratification and reassessment biomarker rather than a stand-alone late prognostic marker.
In Cox regression analysis, Day 2 HBP was independently associated with higher 28-day mortality risk after multivariable adjustment (adjusted hazard ratio [aHR] per 10 ng/mL increase, 1.12; 95% CI, 1.07–1.17; p < 0.001; Table 7). The relative HBP change from baseline to Day 2 also remained independently associated with a higher 28-day mortality risk (aHR per 10% increase, 1.05; 95% CI, 1.01–1.09; p = 0.012). Baseline pSOFA (aHR per 1-point increase, 1.12; 95% CI, 1.05–1.19; p = 0.001), lactate (aHR per 1 mmol/L increase, 1.18; 95% CI, 1.06–1.31; p = 0.003), albumin (aHR per 1 g/L increase, 0.96; 95% CI, 0.93–0.99; p = 0.016), and septic shock at admission (aHR, 1.84; 95% CI, 1.12–3.04; p = 0.017) also remained independently associated with 28-day mortality risk. Mechanical ventilation within 24 h and CRRT within 72 h were significant in univariable analyses but did not remain significant after adjustment.
Subgroup analyses showed that the association between Day 2 HBP and 28-day mortality risk was directionally consistent across clinically relevant strata (Table 8). Day 2 HBP remained significantly associated with mortality risk in children aged <1 year (hazard ratio [HR], 1.14; 95% CI, 1.06–1.23; p < 0.001) and ≥1 year (HR, 1.11; 95% CI, 1.05–1.17; p < 0.001), with no significant age interaction (p for interaction = 0.28). Similar consistency was observed across sex, septic shock status, baseline pSOFA category, lactate category, mechanical ventilation status, and albumin category. The association tended to be stronger in clinically severe strata, including septic shock, baseline pSOFA ≥8, lactate ≥2.5 mmol/L, mechanical ventilation within 24 h, and albumin <32 g/L. Relative HBP change showed the same direction of association, although some lower-risk subgroups had wider confidence intervals and non-significant results.
Data availability:
The de-identified patient-level dataset supporting the findings of this study is publicly available in the Figshare repository at https://doi.org/10.6084/m9.figshare.32545806.v1. Analysis code and additional study materials are available from the corresponding author upon reasonable request. All shared data have been de-identified in accordance with institutional and ethical requirements for patient confidentiality.
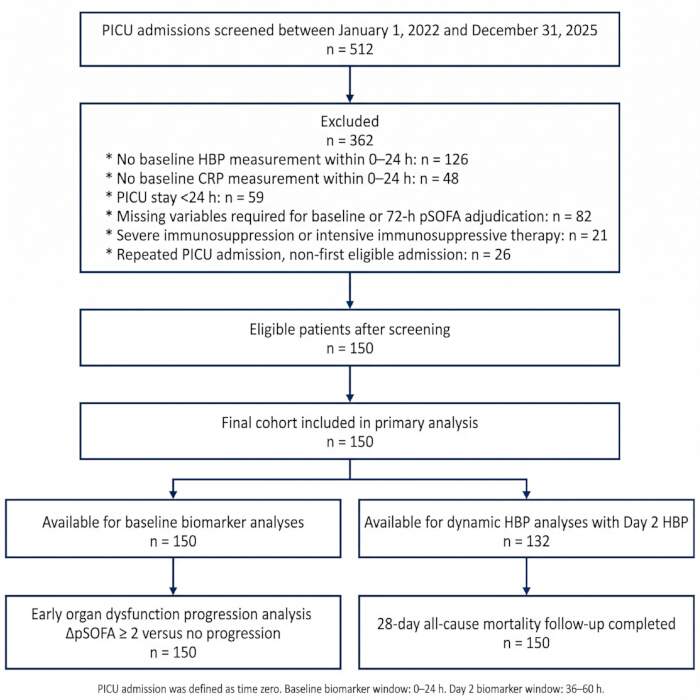
Figure 1: Study flowchart of participant selection. Flowchart showing pediatric intensive care unit (PICU) admissions screened between January 1, 2022, and December 31, 2025, stepwise exclusions, eligible patients, and the final analysis cohort of 150 children with sepsis. Baseline biomarker analyses included all 150 patients, and dynamic heparin-binding protein (HBP) analyses were performed among patients with available Day 2 HBP measurements. PICU admission was defined as time zero. Baseline biomarker window: 0–24 h. Day 2 biomarker window: 36–60 h. Please click here to view a larger version of this figure.
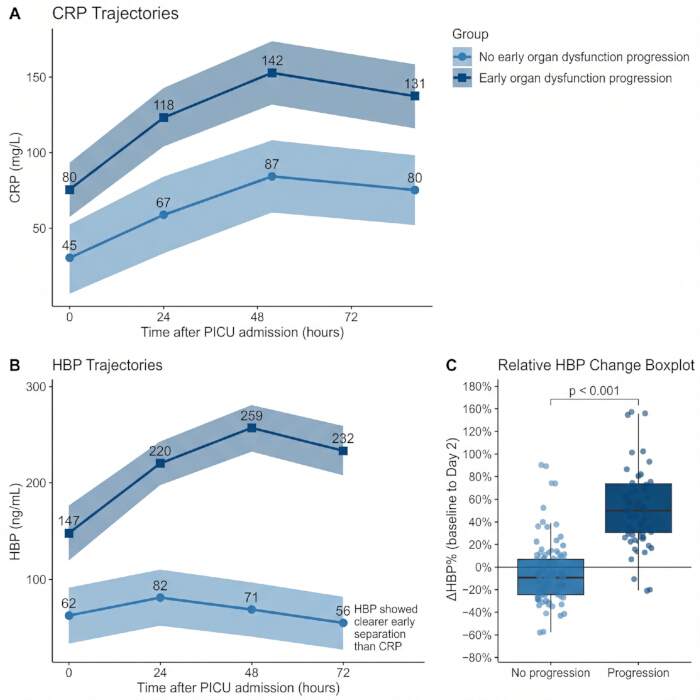
Figure 2: Early trajectories of C-reactive protein and heparin-binding protein by early organ dysfunction progression. (A) C-reactive protein (CRP) trajectories from baseline to 72 h after PICU admission in children with and without early organ dysfunction progression. (B) Heparin-binding protein (HBP) trajectories over the same period. (C) Relative HBP change from baseline to Day 2, stratified by progression status. Early organ dysfunction progression was defined as an increase of 2 or more points in pediatric Sequential Organ Failure Assessment (pSOFA) score within 72 h after PICU admission (ΔpSOFA ≥ 2). Shaded bands or error bars indicate variability around group-level estimates. Please click here to view a larger version of this figure.
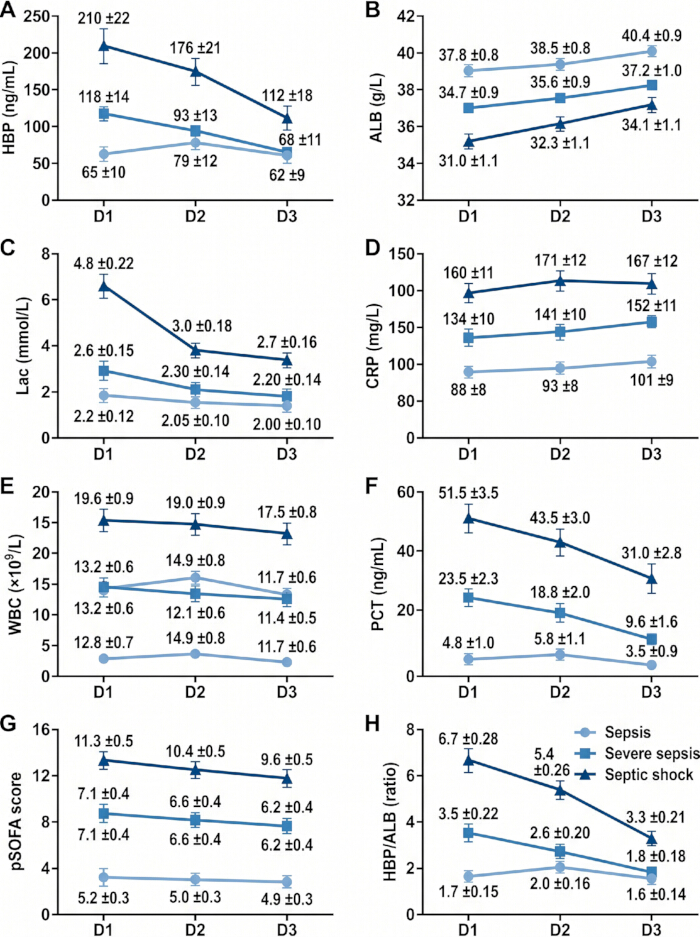
Figure 3: Short-term biomarker and severity trajectories across sepsis severity strata. Serial changes from Day 1 to Day 3 are shown for patients stratified into sepsis, severe sepsis, and septic shock groups. (A) Heparin-binding protein (HBP). (B) Albumin (ALB). (C) Lactate (Lac). (D) C-reactive protein (CRP). (E) White blood cell count (WBC). (F) Procalcitonin (PCT). (G) Pediatric Sequential Organ Failure Assessment (pSOFA) score. (H) HBP-to-albumin ratio. The figure illustrates parallel gradients in endothelial activation, capillary leakage-related protein loss, perfusion disturbance, systemic inflammation, and organ dysfunction across increasing severity strata. Please click here to view a larger version of this figure.
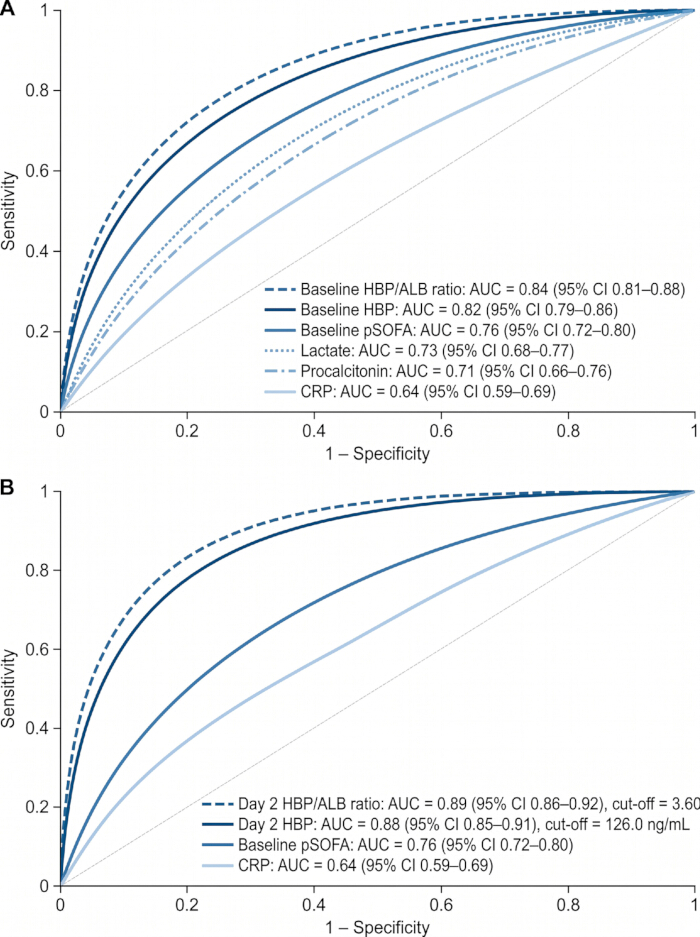
Figure 4: Discriminative performance of single biomarkers and clinical indicators for early organ dysfunction progression. Receiver operating characteristic (ROC) curves comparing individual predictors. (A) Baseline predictors, including baseline HBP, baseline HBP-to-albumin ratio, baseline pSOFA, lactate, procalcitonin, and CRP. (B) Day 2 predictors, including Day 2 HBP, Day 2 HBP-to-albumin ratio, baseline pSOFA, and CRP. Early organ dysfunction progression was defined as ΔpSOFA ≥ 2 within 72 h after PICU admission. Area under the curve (AUC) values and confidence intervals correspond to the final values reported in Table 4. Please click here to view a larger version of this figure.
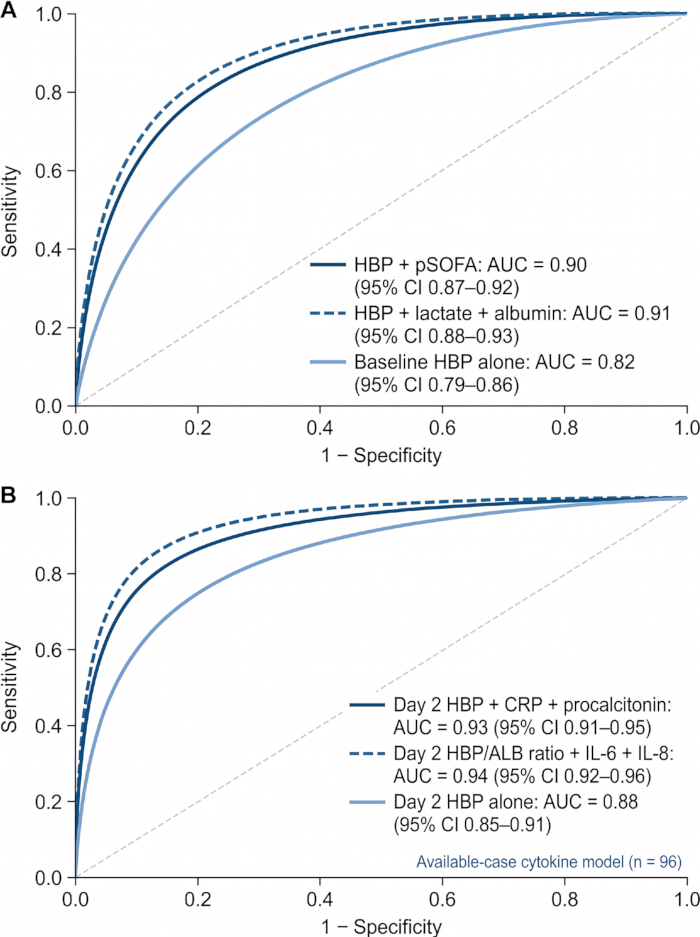
Figure 5: Receiver operating characteristic curves for HBP-based combined models. (A) Baseline combined models, including HBP + pSOFA and HBP + lactate + albumin, were compared with baseline HBP alone. (B) Day 2 combined models, including Day 2 HBP + CRP + procalcitonin and Day 2 HBP-to-albumin ratio + interleukin-6 + interleukin-8, compared with Day 2 HBP alone. Cytokine-containing models were analyzed in the available-case subset because interleukin-6 and interleukin-8 were measured only when ordered as part of routine clinical care. AUC values correspond to Table 4. Please click here to view a larger version of this figure.
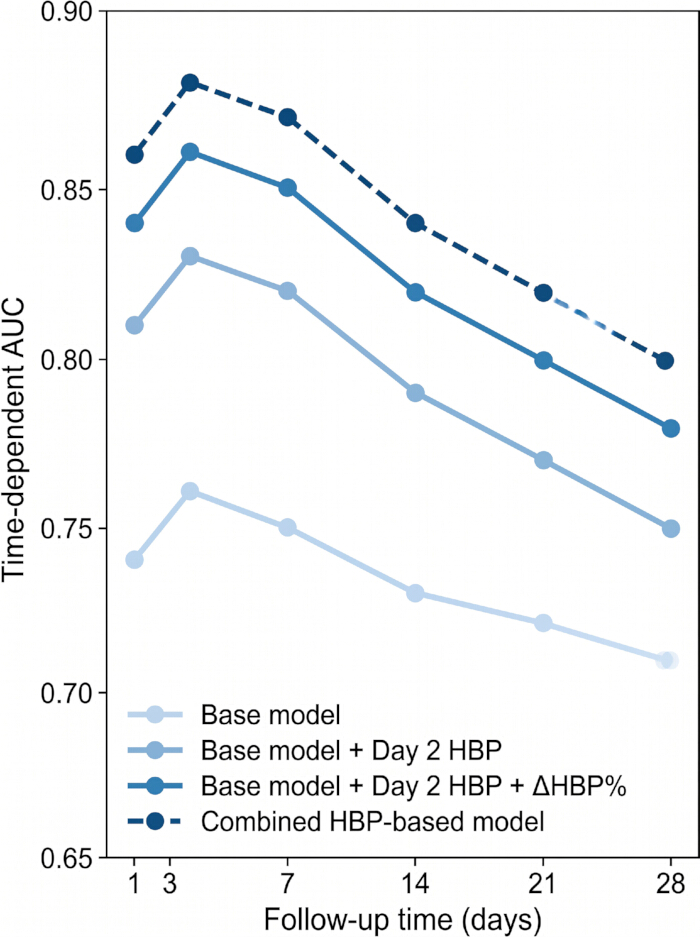
Figure 6: Time-dependent AUCs of HBP-based models for 28-day all-cause mortality. Time-dependent AUC curves are shown for the base model, the base model plus Day 2 HBP, the base model plus Day 2 HBP and relative HBP change (ΔHBP%), and the combined HBP-based model. The base model included pSOFA, lactate, albumin, procalcitonin, and CRP. The figure shows that HBP-based models had the greatest discriminative advantage during early follow-up, with gradual narrowing of the difference over 28 days. Please click here to view a larger version of this figure.
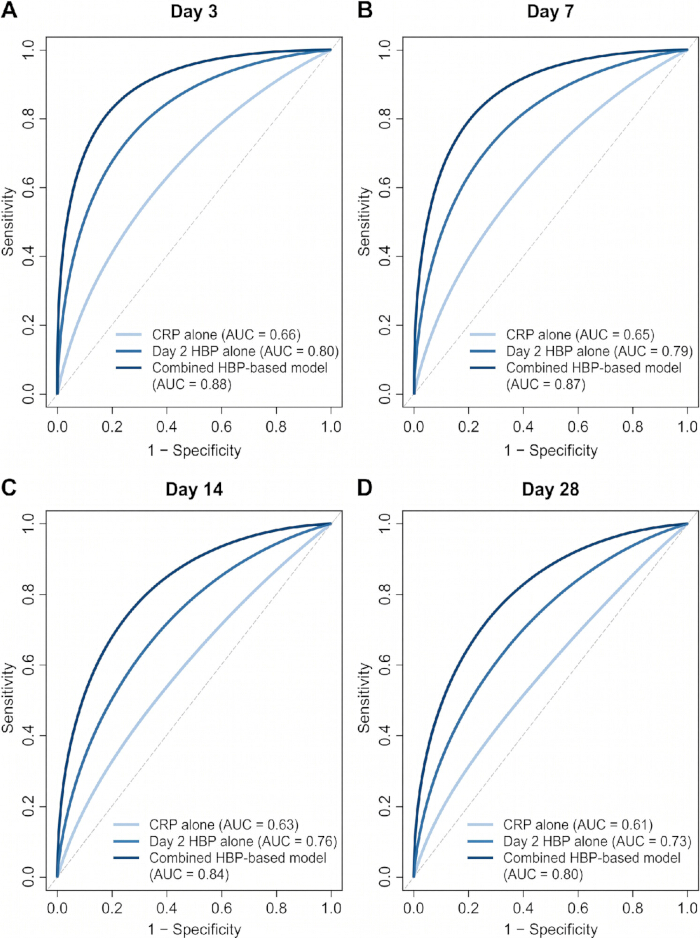
Figure 7: Time-dependent ROC curves for 28-day all-cause mortality prediction at selected follow-up time points. ROC curves are shown for CRP alone, Day 2 HBP alone, and the combined HBP-based model. (A) Day 3. (B) Day 7. (C) Day 14. (D) Day 28. The combined HBP-based model showed higher discrimination than either single biomarker across the selected time points. Please click here to view a larger version of this figure.
| Variable | Q1 (lowest HBP), n=37 | Q2, n=38 | Q3, n=37 | Q4 (highest HBP), n=38 | p value |
| Baseline HBP, ng/mL | 21.1 (15.9–26.2) | 58.4 (46.8–72.5) | 132.6 (104.3–165.8) | 262.8 (201.6–308.7) | <0.001 |
| Age, years | 3.1 (0.9–7.8) | 3.4 (1.0–8.2) | 3.2 (0.8–7.5) | 3.0 (0.7–7.1) | 0.84 |
| Male sex, n (%) | 21 (56.8) | 22 (57.9) | 20 (54.1) | 23 (60.5) | 0.93 |
| Body weight, kg | 14.8 (9.2–24.5) | 15.1 (9.5–25.8) | 14.5 (8.9–24.2) | 14.2 (8.5–23.6) | 0.88 |
| Chronic comorbidity, n (%) | 9 (24.3) | 10 (26.3) | 11 (29.7) | 12 (31.6) | 0.79 |
| Respiratory infection, n (%) | 18 (48.6) | 17 (44.7) | 15 (40.5) | 13 (34.2) | 0.38 |
| Bloodstream infection, n (%) | 4 (10.8) | 7 (18.4) | 10 (27.0) | 15 (39.5) | 0.006 |
| Abdominal infection, n (%) | 5 (13.5) | 5 (13.2) | 6 (16.2) | 7 (18.4) | 0.82 |
| Heart rate, beats/min | 128 (116–142) | 136 (122–150) | 145 (130–158) | 156 (138–170) | <0.001 |
| Mean arterial pressure, mmHg | 67 (60–74) | 64 (57–71) | 60 (52–68) | 56 (48–63) | <0.001 |
| Baseline pSOFA score | 5 (3–8) | 6 (4–9) | 8 (5–10) | 9 (7–12) | <0.001 |
| Septic shock at admission, n (%) | 7 (18.9) | 10 (26.3) | 13 (35.1) | 16 (42.1) | <0.001 |
| Mechanical ventilation within 24 h, n (%) | 9 (24.3) | 13 (34.2) | 17 (45.9) | 22 (57.9) | 0.003 |
| Vasoactive support within 24 h, n (%) | 8 (21.6) | 12 (31.6) | 18 (48.6) | 24 (63.2) | <0.001 |
| CRRT within 72 h, n (%) | 1 (2.7) | 3 (7.9) | 5 (13.5) | 8 (21.1) | 0.015 |
| CRP, mg/L | 46.2 (28.5–72.8) | 71.4 (45.3–98.6) | 103.7 (70.2–142.4) | 138.6 (96.5–181.2) | <0.001 |
| Procalcitonin, ng/mL | 4.8 (1.6–12.5) | 8.9 (3.2–19.6) | 16.4 (6.8–31.5) | 28.7 (12.2–52.4) | <0.001 |
| Lactate, mmol/L | 1.8 (1.2–2.6) | 2.3 (1.6–3.4) | 3.0 (2.0–4.5) | 4.2 (2.8–6.1) | <0.001 |
| Albumin, g/L | 37.6 (34.1–40.5) | 35.4 (31.8–38.2) | 32.8 (29.5–36.1) | 29.6 (26.4–33.2) | <0.001 |
| Platelet count, ×10⁹/L | 216 (158–287) | 184 (132–248) | 151 (98–216) | 118 (72–176) | <0.001 |
| Creatinine, μmol/L | 35.2 (25.8–48.6) | 42.5 (30.6–58.4) | 53.7 (38.2–75.6) | 68.4 (46.5–96.2) | <0.001 |
Table 1: Baseline characteristics by baseline heparin-binding protein quartiles. Baseline demographic, infection-related, hemodynamic, organ support, and laboratory characteristics of 150 children with sepsis admitted to the PICU, stratified by baseline HBP quartiles. Values are presented as median (interquartile range) or n (%), as appropriate.
| Variable | No Early Progression n = 96 | Early Progression (ΔpSOFA ≥ 2, n=54) | p-value |
| White blood cell count, ×10⁹/L | 11.8 (7.5–16.2) | 16.4 (10.5–23.8) | <0.001 |
| Neutrophils, % | 72.5 (63.1–81.4) | 84.6 (76.2–90.5) | <0.001 |
| Platelet count, ×10⁹/L | 196 (132–268) | 112 (68–184) | <0.001 |
| INR | 1.18 (1.05–1.34) | 1.46 (1.22–1.82) | <0.001 |
| APTT, s | 38.4 (32.6–46.7) | 51.2 (41.8–68.5) | <0.001 |
| Fibrinogen, g/L | 3.1 (2.3–4.2) | 2.2 (1.5–3.4) | 0.002 |
| D-dimer, mg/L FEU | 1.8 (0.9–3.6) | 4.9 (2.1–9.8) | <0.001 |
| Lactate, mmol/L | 2.1 (1.4–3.2) | 4.3 (2.7–6.6) | <0.001 |
| pH | 7.38 (7.32–7.43) | 7.29 (7.20–7.36) | <0.001 |
| Base excess, mmol/L | −2.4 (−5.6 to 0.6) | −7.8 (−12.5 to −3.1) | <0.001 |
| Creatinine, μmol/L | 41.6 (29.2–59.8) | 68.5 (45.7–102.4) | <0.001 |
| Urea nitrogen, mmol/L | 5.8 (3.9–8.4) | 9.6 (6.2–14.8) | <0.001 |
| Total bilirubin, μmol/L | 12.4 (7.8–21.6) | 26.8 (14.5–48.2) | <0.001 |
| Alanine aminotransferase, U/L | 34 (19–68) | 82 (36–178) | <0.001 |
| Albumin, g/L | 35.8 (32.1–39.4) | 29.8 (26.5–34.1) | <0.001 |
| Glucose, mmol/L | 6.8 (5.4–8.9) | 9.6 (6.7–13.8) | 0.001 |
| Sodium, mmol/L | 137 (134–140) | 134 (130–138) | 0.018 |
| Initial fluid bolus ≥20 mL/kg, n (%) | 34 (35.4) | 35 (64.8) | <0.001 |
| Vasoactive support within 24 h, n (%) | 28 (29.2) | 34 (63.0) | <0.001 |
| Mechanical ventilation within 24 h, n (%) | 27 (28.1) | 34 (63.0) | <0.001 |
| Systemic corticosteroid use, n (%) | 20 (20.8) | 25 (46.3) | 0.001 |
| Albumin infusion, n (%) | 24 (25.0) | 29 (53.7) | <0.001 |
| Albumin dose, g/kg | 0.3 (0.0–0.8) | 0.8 (0.3–1.5) | <0.001 |
| Packed red blood cell transfusion, n (%) | 14 (14.6) | 19 (35.2) | 0.003 |
| CRRT within 72 h, n (%) | 4 (4.2) | 13 (24.1) | <0.001 |
| PICU length of stay, days | 8 (5–13) | 15 (9–23) | <0.001 |
Table 2: Baseline laboratory findings and early interventions by progression of early organ dysfunction. Comparison of laboratory indices, perfusion markers, coagulation variables, organ function indicators, and early therapeutic interventions between children with and without early organ dysfunction progression. Early organ dysfunction progression was defined as ΔpSOFA ≥ 2 within 72 h after PICU admission.
| HBP-related metric | Correlated variable | Correlation coefficient, r | 95% CI | p value |
| Baseline HBP | Baseline pSOFA score | 0.46 | 0.39–0.53 | <0.001 |
| Baseline HBP | Day 2 pSOFA score | 0.41 | 0.33–0.48 | <0.001 |
| Baseline HBP | Lactate | 0.38 | 0.30–0.45 | <0.001 |
| Baseline HBP | CRP | 0.29 | 0.20–0.37 | <0.001 |
| Baseline HBP | Procalcitonin | 0.33 | 0.24–0.41 | <0.001 |
| Baseline HBP | Albumin | −0.34 | −0.42 to −0.26 | <0.001 |
| HBP-to-albumin ratio | Severity score | 0.62 | 0.56–0.67 | <0.001 |
| Baseline HBP | Ventilator days within 28 days | 0.27 | 0.18–0.35 | <0.001 |
| Baseline HBP | PICU length of stay | 0.23 | 0.14–0.31 | <0.001 |
| Baseline HBP | Total VIS within 24 h | 0.35 | 0.27–0.43 | <0.001 |
| Baseline HBP | Fluid bolus volume within 24 h | 0.21 | 0.12–0.29 | <0.001 |
| Baseline HBP | Mechanical ventilation within 24 h | 0.3 | 0.21–0.38 | <0.001 |
| Baseline HBP | Vasoactive support within 24 h | 0.36 | 0.28–0.44 | <0.001 |
| Baseline HBP | CRRT within 72 h | 0.19 | 0.10–0.28 | <0.001 |
| Day 2 HBP | Day 2 pSOFA score | 0.52 | 0.45–0.58 | <0.001 |
| Relative HBP change | ΔpSOFA | 0.4 | 0.32–0.47 | <0.001 |
| Relative HBP change | 28-day mortality status | 0.24 | 0.15–0.33 | <0.001 |
Table 3: Correlations between HBP metrics, severity scores, and organ support indicators. Spearman correlation coefficients for baseline and dynamic HBP-related metrics with pSOFA scores, inflammatory markers, perfusion indicators, organ support variables, vasoactive-inotropic score, pediatric intensive care unit length of stay, and 28-day mortality status.
| Predictor or model | AUC | 95% CI | Cut-off | Sensitivity, % | Specificity, % | PPV, % | NPV, % | Accuracy, % | Youden index |
| Baseline CRP | 0.64 | 0.59–0.69 | 92.0 mg/L | 61.5 | 60.2 | 46.5 | 73.4 | 60.7 | 0.22 |
| Procalcitonin | 0.71 | 0.66–0.76 | 12.0 ng/mL | 68.4 | 65.3 | 52.1 | 78.6 | 66.4 | 0.34 |
| Lactate | 0.73 | 0.68–0.77 | 2.8 mmol/L | 70.2 | 66.7 | 54.3 | 79.5 | 68 | 0.37 |
| Albumin | 0.7 | 0.65–0.75 | 32.0 g/L | 65.7 | 68.4 | 53.8 | 77.6 | 67.3 | 0.34 |
| Baseline pSOFA | 0.76 | 0.72–0.80 | 7 points | 72.2 | 70.8 | 58.2 | 81.7 | 71.3 | 0.43 |
| Baseline HBP | 0.82 | 0.79–0.86 | 98.0 ng/mL | 78.5 | 76.4 | 65.1 | 86.2 | 77.3 | 0.55 |
| Day 2 HBP | 0.88 | 0.85–0.91 | 126.0 ng/mL | 82.7 | 80.6 | 70.4 | 90.5 | 81.3 | 0.63 |
| Baseline HBP-to-albumin ratio | 0.84 | 0.81–0.88 | 2.8 | 80.1 | 78.6 | 67.8 | 87.9 | 79.1 | 0.59 |
| Day 2 HBP-to-albumin ratio | 0.89 | 0.86–0.92 | 3.6 | 83.5 | 81.8 | 71.6 | 91 | 82.4 | 0.65 |
| HBP + pSOFA | 0.9 | 0.87–0.92 | Model probability | 85.4 | 83.1 | 75 | 91.1 | 84 | 0.69 |
| HBP + lactate + albumin | 0.91 | 0.88–0.93 | Model probability | 86.7 | 84.2 | 76.4 | 91.8 | 85.1 | 0.71 |
| Day 2 HBP + CRP + procalcitonin | 0.93 | 0.91–0.95 | Model probability | 88.5 | 85.8 | 79.1 | 93.2 | 86.9 | 0.74 |
| Day 2 HBP-to-albumin ratio + IL-6 + IL-8 | 0.94 | 0.92–0.96 | Model probability | 89.6 | 86.4 | 80.3 | 94.4 | 87.4 | 0.76 |
Table 4: Predictive performance of biomarkers and models for early organ dysfunction progression. AUCs, 95% confidence intervals, optimal cut-off values, sensitivity, specificity, positive predictive value, negative predictive value, accuracy, and Youden index for single biomarkers, the HBP-to-albumin ratio, and HBP-based combined models in identifying early progression of organ dysfunction.
| Predictor | Early Organ Dysfunction Progression | High Illness Severity | ||||
| aOR | 95% CI | p value | aOR | 95% CI | p value | |
| Day 2 HBP, per 10 ng/mL | 1.18 | 1.12–1.24 | <0.001 | 1.15 | 1.10–1.21 | <0.001 |
| Relative HBP change, per 10% increase | 1.09 | 1.04–1.14 | <0.001 | 1.07 | 1.02–1.12 | 0.006 |
| Baseline pSOFA, per 1-point increase | 1.23 | 1.14–1.33 | <0.001 | 1.31 | 1.21–1.43 | <0.001 |
| Lactate, per 1 mmol/L increase | 1.28 | 1.13–1.45 | <0.001 | 1.21 | 1.08–1.36 | 0.001 |
| Albumin, per 1 g/L increase | 0.93 | 0.90–0.97 | <0.001 | 0.95 | 0.92–0.98 | 0.002 |
| Procalcitonin, per 10 ng/mL increase | 1.06 | 1.01–1.12 | 0.028 | 1.05 | 1.00–1.11 | 0.046 |
| CRP, per 10 mg/L increase | 1.01 | 0.98–1.04 | 0.42 | 1.02 | 0.99–1.05 | 0.25 |
| Septic shock at admission | 2.16 | 1.42–3.30 | <0.001 | 2.43 | 1.60–3.71 | <0.001 |
| Mechanical ventilation within 24 h | 2.02 | 1.32–3.10 | 0.001 | 1.9 | 1.25–2.90 | 0.003 |
| Infection source category | 1.18 | 0.91–1.54 | 0.21 | 1.21 | 0.93–1.58 | 0.16 |
| Age, per year | 0.98 | 0.93–1.04 | 0.53 | 0.97 | 0.91–1.03 | 0.31 |
| Model C-statistic | 0.9 | — | — | 0.91 | — | — |
| Hosmer-Lemeshow p value | 0.41 | — | — | 0.46 | — | — |
| Nagelkerke R² | 0.4 | — | — | 0.42 | — | — |
Table 5: Multivariable logistic regression models for early organ dysfunction progression and high illness severity. Adjusted odds ratios and 95% confidence intervals for predictors of early organ dysfunction progression (ΔpSOFA ≥ 2) and high illness severity, defined as 72-h peak pSOFA ≥ 8. Model discrimination, calibration, and explained variance are also summarized.
| Outcome | Model | AUC | ΔAUC | 95% CI for ΔAUC | p value | NRI | 95% CI for NRI | IDI | 95% CI for IDI | Brier score | Calibration intercept | Calibration slope | Hosmer-Lemeshow p value |
| Early organ dysfunction progression | Base model | 0.78 | Reference | — | — | Reference | — | Reference | — | 0.168 | 0.08 | 0.86 | 0.09 |
| Early organ dysfunction progression | Base model + Day 2 HBP + ΔHBP% | 0.92 | 0.14 | 0.10–0.18 | <0.001 | 0.31 | 0.18–0.44 | 0.072 | 0.044–0.103 | 0.132 | 0.03 | 0.97 | 0.41 |
| High illness severity | Base model | 0.79 | Reference | — | — | Reference | — | Reference | — | 0.162 | 0.07 | 0.88 | 0.12 |
| High illness severity | Base model + Day 2 HBP + ΔHBP% | 0.92 | 0.13 | 0.09–0.17 | <0.001 | 0.28 | 0.15–0.42 | 0.061 | 0.034–0.091 | 0.129 | 0.02 | 0.98 | 0.46 |
Table 6: Incremental predictive value of adding HBP metrics to the base model. Changes in AUC, net reclassification improvement, integrated discrimination improvement, Brier score, calibration intercept, calibration slope, and Hosmer-Lemeshow test after adding Day 2 HBP and ΔHBP% to the base model for early organ dysfunction progression and high illness severity. The base model included pSOFA, lactate, albumin, procalcitonin, and CRP.
| Predictor | Univariable Analysis | Multivariable Analysis | ||||
| HR | 95% CI | p value | aHR | 95% CI | p value | |
| Day 2 HBP, per 10 ng/mL | 1.18 | 1.12–1.24 | <0.001 | 1.12 | 1.07–1.17 | <0.001 |
| Relative HBP change, per 10% increase | 1.08 | 1.04–1.12 | <0.001 | 1.05 | 1.01–1.09 | 0.012 |
| Baseline pSOFA, per 1-point increase | 1.18 | 1.11–1.26 | <0.001 | 1.12 | 1.05–1.19 | 0.001 |
| Lactate, per 1 mmol/L increase | 1.27 | 1.15–1.40 | <0.001 | 1.18 | 1.06–1.31 | 0.003 |
| Albumin, per 1 g/L increase | 0.93 | 0.90–0.96 | <0.001 | 0.96 | 0.93–0.99 | 0.016 |
| Procalcitonin, per 10 ng/mL increase | 1.09 | 1.03–1.16 | 0.004 | 1.04 | 0.98–1.10 | 0.18 |
| CRP, per 10 mg/L increase | 1.04 | 1.01–1.07 | 0.018 | 1.01 | 0.98–1.04 | 0.43 |
| Septic shock at admission | 2.76 | 1.78–4.29 | <0.001 | 1.84 | 1.12–3.04 | 0.017 |
| Mechanical ventilation within 24 h | 2.31 | 1.46–3.66 | <0.001 | 1.28 | 0.78–2.11 | 0.33 |
| CRRT within 72 h | 2.89 | 1.62–5.16 | <0.001 | 1.42 | 0.75–2.69 | 0.28 |
| Age, per year | 0.97 | 0.91–1.04 | 0.39 | 0.98 | 0.91–1.05 | 0.56 |
Table 7: Cox regression analyses for 28-day all-cause mortality. Univariable and multivariable hazard ratios for 28-day all-cause mortality, including Day 2 HBP, relative HBP change, baseline pSOFA, lactate, albumin, procalcitonin, CRP, septic shock at admission, mechanical ventilation within 24 h, CRRT within 72 h, and age.
| Subgroup | Day 2 HBP HR per 10 ng/mL | 95% CI | p value | ΔHBP% HR per 10% increase | 95% CI | p value | p for interaction |
| Age <1 year | 1.14 | 1.06–1.23 | <0.001 | 1.06 | 1.01–1.12 | 0.021 | 0.28 |
| Age ≥1 year | 1.11 | 1.05–1.17 | <0.001 | 1.04 | 1.00–1.09 | 0.049 | — |
| Male sex | 1.12 | 1.06–1.19 | <0.001 | 1.05 | 1.01–1.10 | 0.018 | 0.61 |
| Female sex | 1.13 | 1.06–1.21 | <0.001 | 1.05 | 1.00–1.11 | 0.041 | — |
| Septic shock present | 1.14 | 1.08–1.21 | <0.001 | 1.07 | 1.02–1.13 | 0.006 | 0.19 |
| Septic shock absent | 1.09 | 1.03–1.16 | 0.004 | 1.03 | 0.98–1.09 | 0.21 | — |
| Baseline pSOFA <8 | 1.08 | 1.02–1.15 | 0.009 | 1.03 | 0.98–1.09 | 0.18 | 0.24 |
| Baseline pSOFA ≥8 | 1.14 | 1.08–1.20 | <0.001 | 1.07 | 1.02–1.12 | 0.005 | — |
| Lactate <2.5 mmol/L | 1.09 | 1.02–1.16 | 0.01 | 1.03 | 0.98–1.09 | 0.2 | 0.31 |
| Lactate ≥2.5 mmol/L | 1.13 | 1.07–1.20 | <0.001 | 1.06 | 1.01–1.12 | 0.014 | — |
| No mechanical ventilation within 24 h | 1.08 | 1.01–1.15 | 0.026 | 1.02 | 0.97–1.08 | 0.36 | 0.22 |
| Mechanical ventilation within 24 h | 1.14 | 1.08–1.21 | <0.001 | 1.07 | 1.02–1.13 | 0.007 | — |
| Albumin ≥32 g/L | 1.09 | 1.02–1.16 | 0.011 | 1.03 | 0.98–1.09 | 0.22 | 0.18 |
| Albumin <32 g/L | 1.14 | 1.08–1.21 | <0.001 | 1.07 | 1.02–1.13 | 0.006 | — |
Table 8: Subgroup Cox analyses of dynamic HBP metrics for 28-day all-cause mortality. Subgroup hazard ratios and interaction tests for Day 2 HBP and ΔHBP% across strata defined by age, sex, septic shock status, baseline pSOFA, baseline lactate, early mechanical ventilation, and baseline albumin.
Supplementary Table 1: Sensitivity analyses for HBP metrics and early severity outcomes. Sensitivity analyses evaluated the robustness of the associations between HBP metrics and early severity outcomes after narrowing the Day 2 sampling window to 42–54 h, applying a stricter progression definition (ΔpSOFA ≥ 3), excluding source-verified atypical extreme HBP values, and restricting analyses to patients with complete dynamic HBP measurements.Please click here to download this file.
Discussion
This retrospective pediatric intensive care unit (PICU) cohort found that heparin-binding protein (HBP) was closely associated with organ dysfunction burden and disease severity in pediatric sepsis and provided additional prognostic information beyond conventional inflammatory markers9. Higher baseline HBP levels and larger short-term increases were associated with higher pediatric Sequential Organ Failure Assessment (pSOFA) scores, greater need for mechanical ventilation, vasoactive therapy, continuous renal replacement therapy (CRRT), and higher 28-day mortality risk. These findings are consistent with the biological role of HBP as both an inflammatory mediator and a marker of endothelial injury10. HBP is released by activated neutrophils, increases endothelial permeability, and promotes vascular leakage, which can worsen microcirculatory dysfunction and contribute to multi-organ impairment. This position along the endothelial-microcirculatory axis may explain why HBP showed stronger and more stable associations with clinical severity than conventional inflammatory markers that mainly reflect downstream systemic inflammation11.
Our findings are also consistent with prior studies in pediatric and adult critical care settings12. A multicenter prospective PICU study in China reported diagnostic and prognostic value of HBP in pediatric sepsis and showed that repeated measurements improved clinical assessment, supporting the relevance of dynamic testing13. Meta-analyses have similarly shown moderate to high predictive performance of HBP for severe infection, shock, organ dysfunction, and mortality, while also noting heterogeneity in thresholds and effect sizes across populations and sampling windows14. This heterogeneity underscores the need to calibrate HBP thresholds and sampling strategies to specific settings. In the present cohort, HBP-centered combined models, particularly those incorporating albumin and conventional inflammatory markers, showed higher discrimination and better negative predictive value than single predictors, which is consistent with previous evidence that HBP performs best when interpreted alongside clinical scores and other biomarkers15.
An additional observation was the strong performance of the HBP-to-albumin ratio. From a biological perspective, this composite index may better reflect the combined effects of neutrophil activation, endothelial permeability, and capillary leakage than either marker alone. HBP is directly involved in endothelial barrier disruption, whereas lower albumin levels may reflect vascular protein loss, systemic inflammation, and critical illness-related permeability changes. The HBP-to-albumin ratio, therefore, captures both endothelial activation and a downstream physiological consequence of capillary leakage. This may explain its stronger correlation with pSOFA scores and improved discriminative performance compared with several individual biomarkers. Because this ratio is not yet an established pediatric sepsis threshold, it should be interpreted as an exploratory composite index that requires prospective validation.
For descriptive analyses, baseline HBP was stratified into quartiles to evaluate dose-response patterns across the observed biomarker distribution rather than to establish clinical decision thresholds. This approach was appropriate because validated pediatric HBP cutoffs for sepsis severity remain uncertain and may vary by assay platform, sampling window, and patient mix. The quartile analysis showed that higher HBP strata were accompanied by higher pSOFA scores, more frequent septic shock, greater organ support requirements, and more abnormal laboratory indicators. These patterns support a severity gradient but should not be interpreted as definitive bedside cutoffs.
A key finding of this study is the added value of dynamic HBP assessment. The relative HBP change from baseline to Day 2 remained independently associated with early progression of organ dysfunction, high illness severity, and a higher 28-day mortality risk after adjustment for pSOFA, lactate, albumin, and other covariates. This suggests that persistently elevated or rising HBP after initial resuscitation may identify a high-risk phenotype characterized by ongoing neutrophil activation, sustained endothelial barrier dysfunction, and persistent microcirculatory impairment. Similar associations between dynamic HBP trajectories and short-term mortality have been reported in intensive care cohorts, supporting the external plausibility of our findings16.
Age-related clinical heterogeneity is important in pediatric sepsis because immune maturation, endothelial responses, vascular permeability, and baseline physiological reserve differ across developmental stages17. In this study, age was included in the primary models and subgroup analyses were performed using age strata. The association between Day 2 HBP and 28-day mortality risk remained directionally consistent in children aged <1 year and ≥1 year, and interaction testing did not suggest significant age-related effect modification. These findings suggest that the prognostic signal of HBP was relatively stable across the age strata examined in this cohort. However, the sample size was not sufficient to establish age-specific reference ranges or age-specific clinical cutoffs, and larger pediatric cohorts are needed to evaluate whether HBP kinetics differ among neonates, infants, preschool children, and older children.
The observed associations between HBP and organ support requirements were also reflected by quantitative measures of hemodynamic support intensity. In addition to binary vasoactive therapy use, higher HBP levels were correlated with higher vasoactive-inotropic score (VIS), indicating that HBP may identify children requiring more intensive cardiovascular support. This finding is clinically relevant because VIS provides a more granular measure of hemodynamic support than a simple yes-or-no vasoactive therapy variable. Together with the associations between HBP, lactate, pSOFA, mechanical ventilation, and CRRT, this result supports the interpretation of HBP as a marker of physiological instability and evolving organ dysfunction rather than a nonspecific inflammatory signal.
From a clinical perspective, HBP appears to be a useful complementary biomarker for early risk assessment and reassessment in pediatric sepsis. Beyond its correlation with pSOFA and organ support intensity, adding HBP to a base model including pSOFA, lactate, albumin, procalcitonin, and C-reactive protein improved discrimination, reclassification, and calibration18. These gains indicate that HBP captures information not fully represented by routine laboratory and clinical indices, likely reflecting endothelial barrier injury and microcirculatory dysfunction. A practical application would be an early assessment pathway in which HBP is measured soon after PICU admission and repeated within 48–72 h. Children with high baseline HBP and unfavorable early trajectories could then be considered for closer hemodynamic monitoring, more frequent reassessment of organ function, and earlier review of treatment response19,20. This should be interpreted as a risk-stratification aid rather than evidence that HBP-guided intervention improves outcomes, which requires prospective testing.
Several limitations should be noted. First, this was a single-center retrospective study, so residual confounding, treatment-selection bias, and center-specific practice patterns cannot be fully excluded. Second, selection bias may have been introduced because patients without baseline HBP or C-reactive protein measurements, incomplete pSOFA endpoint data, or incomplete survival follow-up were excluded from the primary analysis. Patients without Day 2 HBP were retained in baseline analyses but excluded from dynamic HBP analyses. Therefore, the dynamic analyses may overrepresent children who underwent repeated biomarker testing because of greater perceived clinical severity or closer monitoring. Third, interleukin-6 and interleukin-8 were not routinely measured in all patients, so cytokine-containing models were based on available-case data and should be interpreted as secondary exploratory analyses rather than primary predictive models. Fourth, although fixed sampling windows were used, variation in exact blood draw times within those windows may have introduced measurement variability. Absolute HBP thresholds may also not be directly transferable across institutions because of differences in assay platforms and laboratory workflows. Fifth, the sample size was moderate, and some subgroup analyses had limited event counts, which reduces the precision of effect estimates. Finally, the study endpoints, including early organ dysfunction progression, high illness severity, and 28-day mortality, are influenced by multiple factors beyond endothelial injury, including comorbidities, pathogen distribution, antimicrobial timing, and resource availability21.
Future studies should focus on multicenter prospective validation, external calibration of HBP cutoffs, and optimization of sampling schedules in pediatric sepsis22. Integrating dynamic HBP metrics with pSOFA trajectories, lactate clearance, VIS, and organ support intensity may help build risk tools that are both statistically robust and operationally feasible for PICU workflows. Such tools should provide explicit risk categories and actionable thresholds for bedside use. Mechanistic and translational studies are also needed to better define the links between HBP, endothelial barrier dysfunction, coagulation-inflammation crosstalk, and microcirculatory abnormalities. A clearer understanding of these pathways could strengthen the biological basis for HBP-guided individualized management and support future evaluation of endothelium-targeted strategies in pediatric sepsis23.
In this pediatric PICU cohort, HBP was strongly associated with organ dysfunction burden and disease severity. Day 2 HBP levels and early HBP dynamics independently predicted early organ dysfunction progression, high illness severity, and higher 28-day mortality risk. Compared with conventional inflammatory markers, HBP showed stronger discriminative performance and improved model discrimination, reclassification, and calibration when added to clinical scores and routine biomarkers. These findings support incorporating HBP into early assessment and dynamic monitoring frameworks for pediatric sepsis in the PICU. Repeated HBP measurements and HBP-based composite indices, such as the HBP-to-albumin ratio, may improve the identification of high-risk children beyond conventional inflammatory markers and clinical scores alone. Prospective multicenter studies are needed to validate clinically actionable thresholds and determine how HBP-guided monitoring strategies can be integrated into routine pediatric critical care practice.
Disclosures
The authors declare that they have no competing interests relevant to this study. The funding source had no role in the study design, data collection, data analysis, data interpretation, or manuscript preparation.
Acknowledgements
The authors thank the medical and nursing staff of the Pediatric Intensive Care Unit for their support in data collection and patient care. We also acknowledge the contributions of all patients and their families whose clinical data enabled this study. This work was supported by a self-funded research project of the Guangxi Zhuang Autonomous Region Health Commission (Project title: Clinical significance of heparin-binding protein in pediatric sepsis patients in the PICU; Contract No. Z-A20230028).
Materials
| Name | Company | Catalog Number | Comments |
|---|---|---|---|
| Analysis script set | Study investigators | Script package set version 1.0 | Version-controlled R script set used for data cleaning, descriptive statistics, ROC analysis, logistic regression, Cox regression, calibration analysis, reclassification analysis, subgroup analysis, and figure/table generation. |
| Automated clinical chemistry/immunoassay analyzer | Hospital central laboratory platform | Institutional system, not commercially cataloged | Fully automated clinical chemistry/immunoassay platform used in the hospital central laboratory for routine biomarker testing. Exact platform was maintained under the laboratory’s standard operating procedure. |
| Base R stats package | R Foundation for Statistical Computing | Included in R 4.3.2 | Used for standard descriptive statistics, Shapiro-Wilk tests, t-tests, chi-square tests, Fisher’s exact tests, and nonparametric tests where applicable. |
| Clinical data dictionary | Study investigators | Clinical data dictionary version 1.0 | Investigator-developed data dictionary defining demographics, infection source, comorbidities, interventions, organ support variables, pSOFA components, and outcome fields. |
| cobas e immunoassay analyzer series | Roche Diagnostics | Platform-dependent; no single reagent catalog number | Compatible analyzer family for Roche Elecsys assays, including IL-6. Used where cytokine testing was ordered as part of routine care. |
| Critical care information system | Pediatric Intensive Care Unit, People’s Hospital of Guangxi Zhuang Autonomous Region | Institutional system, not commercially cataloged | Source system for pediatric intensive care unit admission time, organ support records, mechanical ventilation, vasoactive therapy, fluid bolus volume, continuous renal replacement therapy, and pediatric Sequential Organ Failure Assessment-related variables. |
| De-identified analysis dataset | Study investigators | Institutional dataset, not commercially cataloged | De-identified retrospective dataset containing eligible pediatric sepsis admissions, biomarker measurements, organ support records, pSOFA variables, and 28-day outcome data. Access is subject to institutional ethics and data-governance approval. |
| Diluent MultiAssay | Roche Diagnostics | 7299010190 | Sample diluent listed for Roche Elecsys IL-6 assay workflows. |
| Electronic medical record system | People’s Hospital of Guangxi Zhuang Autonomous Region | Institutional system, not commercially cataloged | Source system for demographic data, diagnosis records, clinical notes, comorbidities, treatment information, vital signs, organ support events, and outcome follow-up. |
| Graphing and table-generation scripts | Study investigators | Included in script package set version 1.0 | Used to generate publication figures, analytical tables, receiver operating characteristic curves, time-dependent AUC plots, and subgroup displays from the locked analysis dataset. |
| Human Interleukin-8 ELISA Kit | Thermo Fisher Scientific / Invitrogen | BMS204-3 | Enzyme-linked immunosorbent assay kit for quantitative detection of human interleukin-8. Included as the interleukin-8 assay source when interleukin-8 testing was available in the laboratory information system. |
| Human Interleukin-8 ELISA Kit, ten-plate format | Thermo Fisher Scientific / Invitrogen | BMS204-3TEN | Ten-plate format of the human interleukin-8 ELISA kit. Listed as an available assay format for interleukin-8 measurement. |
| Laboratory information system | People’s Hospital of Guangxi Zhuang Autonomous Region | Institutional system, not commercially cataloged | Source system for HBP, CRP, procalcitonin, lactate, albumin, complete blood count, coagulation variables, liver and kidney function variables, interleukin-6, and interleukin-8 when available. |
| Laboratory information system extraction specification | Study investigators | LIS extraction specification version 1.0 | Investigator-developed extraction specification defining biomarker variables, blood draw time, report time, sampling windows, unit checks, and field mapping from the laboratory information system. |
| Laboratory standard operating procedure | People’s Hospital of Guangxi Zhuang Autonomous Region, central laboratory | Laboratory SOP version 2022.1 | Version-controlled internal protocol for routine biomarker processing, assay operation, reportable-range rules, internal quality control, and result release. |
| PreciControl Multimarker | Roche Diagnostics | 5341787190 | Quality-control material listed for Roche Elecsys IL-6 assay workflows. |
| pROC R package | CRAN / R package authors | Version 1.18.5 | R package used for receiver operating characteristic curve analysis, AUC estimation, confidence intervals, and DeLong tests. |
| R statistical software | R Foundation for Statistical Computing | Version 4.3.2 | Statistical computing environment used for all analyses. |
| rms R package | CRAN / R package authors | Version 6.8-0 | R package used for regression modeling, calibration plots, calibration intercept and slope, and model performance assessment. |
| Statistical analysis plan | Study investigators | Analysis specification version 1.0 | Prespecified statistical analysis plan defining endpoint coding, descriptive analyses, receiver operating characteristic analysis, regression models, reclassification metrics, and sensitivity analyses. |
| survival R package | CRAN / R package authors | Version 3.5-7 | R package used for Cox proportional hazards regression and survival-related model checking. |
References
- Weiss SL, Fitzgerald JC, Pappachan J, Wheeler D, Jaramillo-Bustamante JC, Salloo A, et al. Global epidemiology of pediatric severe sepsis: the Sepsis Prevalence, Outcomes, and Therapies Study. Am J Respir Crit Care Med. 2015;191(10):1147-1157. doi:10.1164/rccm.201412-2323OC.
- Lin JC, Spinella PC, Fitzgerald JC, Tucci M, Bush JL, Nadkarni VM, et al. New or progressive multiple organ dysfunction syndrome in pediatric severe sepsis: a sepsis phenotype with higher morbidity and mortality. Pediatr Crit Care Med. 2017;18(1):8-16. doi:10.1097/PCC.0000000000000978.
- Weiss SL, Fitzgerald JC. Pediatric sepsis diagnosis, management, and sub-phenotypes. Pediatrics. 2024;153(1):e2023062967. doi:10.1542/peds.2023-062967.
- Hilarius KWE, Skippen PW, Kissoon N. Early recognition and emergency treatment of sepsis and septic shock in children. Pediatr Emerg Care. 2020;36(2):101-106. doi:10.1097/PEC.0000000000002043.
- Iba T, Maier CL, Helms J, Ferrer R, Thachil J, Levy JH. Managing sepsis and septic shock in an endothelial glycocalyx-friendly way: from the viewpoint of Surviving Sepsis Campaign guidelines. Ann Intensive Care. 2024;14(1):64. doi:10.1186/s13613-024-01301-6.
- Schlapbach LJ, Watson RS, Sorce LR, Argent AC, Menon K, Hall MW, et al. International consensus criteria for pediatric sepsis and septic shock. JAMA. 2024;331(8):665-674. doi:10.1001/jama.2024.0179.
- Linder A, Christensson B, Herwald H, Björck L, Akesson P. Heparin-binding protein: an early marker of circulatory failure in sepsis. Clin Infect Dis. 2009;49(7):1044-1050. doi:10.1086/605563.
- Yang W, Dong W. Heparin-binding protein as a diagnostic and prognostic marker of infections: a systematic review and meta-analysis. Mediterr J Hematol Infect Dis. 2025;17(1):e2025029.
- Mishra H, Balanza N, Francis C, Zhong KT, Wright J, Conroy AL, et al. Heparin-binding protein stratifies mortality risk among Ugandan children hospitalized with respiratory distress. Open Forum Infect Dis. 2024;11(7):ofae386. doi:10.1093/ofid/ofae386.
- Huang C, Zhang C, Zhang J, Zhang L, Mo Y, Mo L. Heparin-binding protein in critically ill children with severe community-acquired pneumonia. Front Pediatr. 2021;9:759535. doi:10.3389/fped.2021.759535.
- Wu YL, Yo CH, Hsu WT, Qian F, Wu BS, Dou QL, et al. Accuracy of heparin-binding protein in diagnosing sepsis: a systematic review and meta-analysis. Crit Care Med. 2021;49(1):e80-e90. doi:10.1097/CCM.0000000000004738.
- Linder A, Arnold R, Boyd JH, Zindovic M, Zindovic I, Lange A, et al. Heparin-binding protein measurement improves the prediction of severe infection with organ dysfunction in the emergency department. Crit Care Med. 2015;43(11):2378-2386. doi:10.1097/CCM.0000000000001265.
- Liu P, Chen D, Lou J, Lin J, Huang C, Zou Y, et al. Heparin-binding protein as a biomarker of severe sepsis in the pediatric intensive care unit: a multicenter, prospective study. Clin Chim Acta. 2023;539:26-33. doi:10.1016/j.cca.2022.11.028.
- Taha AM, Najah Q, Omar MM, Abouelmagd K, Ali M, Hasan MT, et al. Diagnostic and prognostic value of heparin-binding protein in sepsis: a systematic review and meta-analysis. Medicine (Baltimore). 2024;103(25):e38525. doi:10.1097/MD.0000000000038525.
- Zuo L, Li X, Wang L, Yuan H, Liao Z, Zhou S, et al. Heparin-binding protein as a biomarker for the diagnosis of sepsis in the intensive care unit: a retrospective cross-sectional study in China. BMJ Open. 2024;14(6):e078687. doi:10.1136/bmjopen-2023-078687.
- Dou QL, Liu J, Zhang W, Zhang Y, Li H, Chen J, et al. Dynamic changes in heparin-binding protein as a prognostic biomarker for 30-day mortality in sepsis patients in the intensive care unit. Sci Rep. 2022;12(1):10751. doi:10.1038/s41598-022-14827-1.
- Wynn JL, Wong HR. Pathophysiology and treatment of septic shock in neonates. Clin Perinatol. 2010;37(2):439-479. doi:10.1016/j.clp.2010.04.002.
- Wang X, Li R, Qian S, Yu D. Multilevel omics for the discovery of biomarkers in pediatric sepsis. Pediatr Investig. 2023;7(4):277-289. doi:10.1002/ped4.12405.
- Remy KE, Kissoon N. Unraveling the promise and challenges of biomarkers in pediatric sepsis: a commentary on risk estimation of organ dysfunction and immune dysregulation. Pediatr Res. 2025;97:2486-2488. doi:10.1038/s41390-025-03983-5.
- Fisher J, Linder A. Heparin-binding protein: a key player in the pathophysiology of organ dysfunction in sepsis. J Intern Med. 2017;281(6):562-574. doi:10.1111/joim.12604.
- Esposito S, Mucci B, Alfieri E, Tinella A, Principi N. Advances and challenges in pediatric sepsis diagnosis: integrating early warning scores and biomarkers for improved prognosis. Biomolecules. 2025;15(1):123. doi:10.3390/biom15010123.
- Leonard S, Guertin H, Odoardi N, Miller MR, Patel MA, Daley M, et al. Pediatric sepsis inflammatory blood biomarkers that correlate with clinical variables and severity of illness scores. J Inflamm (Lond). 2024;21(1):7. doi:10.1186/s12950-024-00379-w.
- Tasouli F, Georgopoulou E, Chatzigrigoriadis C, Velissaris D, Michailides C. Heparin binding protein in sepsis: a comprehensive overview of pathophysiology, clinical usage and utility as biomarker. Biomedicines. 2025;13(9):2315. doi:10.3390/biomedicines13092315.