Short-form drama environments provide dense reinforcement conditions through ultra-short episodes and frequent re-entry. Using an S-O-R model and PLS-SEM, this study examined continuance intention among short-form drama users. The findings indicate that affective satisfaction was positively associated with habit, and habit was positively associated with continuance intention.
A subscription to JoVE is required to view this content. Sign in or start your free trial.
Research Article
From Affective Satisfaction to Habit: Reinforcement Dynamics in Short-Form Drama Engagement
In This Article
Summary
Abstract
Short-form drama environments have emerged as structurally distinct digital environments characterized by ultra-short episodes, high-frequency re-entry, and algorithmically reinforced exposure. While prior continuance research has examined satisfaction and habit as parallel predictors of sustained use, little is known about how compressed reinforcement cycles embedded in short-form ecosystems may strengthen the association between affective responses and habitual engagement under conditions of dense reinforcement. Drawing on the stimulus-organism-response (S-O-R) framework, this study proposes a structurally reinforced habit-formation model in which environmental stimuli (access convenience, passing time, and content quality) influence affective satisfaction, which, in turn, is associated with habitual engagement and continuance intention. Using cross-sectional survey data from 260 short-form drama users, analyzed using partial least squares structural equation modeling (PLS-SEM), the findings reveal that affective satisfaction is significantly associated with habit formation, and that habit emerges as a dominant driver of continuance intention. Quantitatively, content quality (β = 0.448, p < 0.001) and passing time (β = 0.385, p < 0.001) were the strongest predictors of affective satisfaction, which strongly predicted habit (β = 0.686, p < 0.001) and continuance intention (β = 0.496, p < 0.001). Habit further contributed to continuance intention (β = 0.393, p < 0.001), with the model explaining 61.0% and 68.9% of the variance in affective satisfaction and continuance intention, respectively. Theoretically, this study advances structurally compressed engagement research by conceptualizing short-form structural features as contextual reinforcement conditions that strengthen the association between satisfaction and habit. Practically, the results suggest that micro-episodic design and rapid re-entry mechanisms play a critical role in stabilizing behavioral continuity in short-form drama ecosystems. Because the study used a cross-sectional survey design, the findings should be interpreted as correlational evidence of associations among digital experience factors, affective satisfaction, habit, and continuance intention rather than evidence of causal or temporal change.
Introduction
The global digital entertainment landscape has undergone a profound transformation with the rapid expansion of short-form content platforms. Fueled by mobile-first consumption habits, algorithmic recommendation systems, and increasingly fragmented patterns of media use, short-form dramas have emerged as one of the fastest-growing entertainment formats worldwide1,2. Unlike traditional streaming services that rely on extended viewing sessions, short-form drama platforms deliver ultra-short episodes designed for rapid consumption and frequent re-entry throughout the day. As these platforms become deeply embedded in everyday digital routines, understanding the psychological mechanisms that sustain user engagement has become an increasingly important research priority.
Despite the growing popularity of short-form dramas, existing continuance research remains largely grounded in traditional digital entertainment environments and information systems continuance research3 such as online streaming services, video-on-demand platforms, and social media applications. However, short-form drama ecosystems possess several distinctive structural characteristics—including ultra-short episodic formats, high-frequency re-entry opportunities, and algorithmically reinforced exposure—that create dense reinforcement cycles which repeatedly expose users to emotionally rewarding content within compressed interaction sequences1,4,5. Consequently, psychological processes underlying engagement in short-form drama environments may differ substantially from those observed in traditional streaming contexts.
A further limitation of prior research is that satisfaction and habit (HB) have typically been conceptualized as parallel predictors of continuance intention (CI) in information systems continuance research6. Although both constructs have consistently demonstrated significant explanatory power, relatively little attention has been devoted to understanding how affective satisfaction (as) may gradually evolve into habitual engagement through repeated reinforcement experiences. In particular, it remains unclear how structurally compressed digital environments influence the affective-to-behavioral pathway linking emotional gratification to automatic usage patterns. As a result, the psychological process through which positive affective experiences become routinized into habitual engagement remains insufficiently understood.
To address this gap, the present study develops and tests a reinforcement-based habit formation model within the stimulus-organism-response (S-O-R) framework. Specifically, we propose that digital experience factors influence continuance intention through a sequential affective–behavioral process in which affective satisfaction is conducive to habit formation, which subsequently predicts continuance intention. By examining this mechanism in the context of short-form drama consumption, this study extends continuance theory beyond static post-adoption explanations and advances understanding of how structurally compressed digital environments shape sustained user engagement.
Based on the identified research gap, we hypothesize that continuance intention in structurally compressed short-form drama environments is shaped through a sequential affective–behavioral reinforcement process. Specifically, digital experience factors enhance affective satisfaction, affective satisfaction facilitates habit formation, and habit subsequently reinforces continuance intention. This central hypothesis guides the proposed research model and the empirical investigation presented in this study.
Unlike prior applications of the S-O-R framework, this study adopts the S-O-R framework7 to examine how environmental stimuli influence internal affective states and subsequent behavioral responses in structurally compressed media ecosystems. We propose that digital experience factors influence continuance intention through a sequential process in which affective satisfaction fosters habit formation, which, in turn, predicts continuance intention. The framework has been widely applied in digital commerce, social media, and online entertainment research to explain how environmental attributes shape user engagement and behavioral persistence8,9. Consumer technology adoption research has similarly emphasized the role of experiential factors in shaping continued technology use10. In digital environments, experiential features function as environmental stimuli that trigger emotional reactions and shape post-adoption behavior.
In the present study, digital experiences—comprising access convenience (AC), passing time motivation (PT), and perceived content quality (CQ)—are conceptualized as environmental stimuli. Access convenience reflects the perceived effortlessness and fluency associated with initiating media use, which in turn is associated with experiential control and reduces cognitive load11,12. Passing time represents leisure-oriented motivation within fragmented temporal contexts, a key driver of mobile media engagement13,14. Perceived content quality captures narrative immersion, relevance, and entertainment value, which are critical determinants of user satisfaction in digital media contexts15. Together, these experiential stimuli shape users' affective evaluations during media interaction.
Affective satisfaction represents the organismic state in the S-O-R framework. Satisfaction reflects users' overall emotional appraisal of their experience and has consistently been identified as a primary predictor of continuance intention in post-adoption contexts3,16. However, in high-frequency and repetitive usage environments, satisfaction alone may be insufficient to explain persistent engagement. Repeated positive affective experiences may strengthen the association between engagement and habitual behavior.
Habit formation provides a complementary explanation for behavioral persistence. Habit refers to learned automatic behavioral tendencies triggered by contextual cues through repeated prior actions6,17. Within information systems research, habit has been identified as a critical determinant of continued technology use beyond conscious intention6. In short-form drama consumption contexts, frequent micro-engagements embedded in daily routines may facilitate the development of habitual repetition. As habit strengthens, behavior becomes less dependent on active cognitive evaluation and more resistant to situational variability, thereby reinforcing continuance intention.
By integrating digital experiences, affective satisfaction, and habit formation within a sequential mediation framework, this study advances theoretical understanding of sustained engagement in short-form drama contexts. Specifically, we propose that digital experiences influence continuance intention through a two-stage affective-behavioral pathway: experiential stimuli enhance affective satisfaction, which, in turn, fosters habit formation, ultimately reinforcing continuance intention.
Using survey data from 260 short-form drama users and PLS-SEM, this study empirically examines this sequential mediation mechanism. Theoretically, it extends the S-O-R framework by incorporating habit as a reinforcement mechanism and provides empirical evidence for the sequential affective–habitual pathway in short-form digital environments.
The S-O-R framework posits that environmental stimuli influence internal psychological states, which subsequently shape behavioral responses. In this study, access convenience, passing time, and content quality are conceptualized as stimuli; affective satisfaction and habit represent organismic processes; and continuance intention represents the behavioral response.
Affective satisfaction reflects users' overall emotional evaluation of their media experience and has been consistently associated with continuance intention. In high-frequency digital environments, repeated positive affective experiences may also contribute to habit formation. Prior research in digital media and streaming contexts suggests that affective satisfaction functions as a key organismic state linking platform stimuli to continuance-related responses18. Based on the proposed theoretical framework and prior literature, the following hypotheses are proposed.
Access convenience refers to the perceived ease of accessing digital content. According to the S-O-R framework, environmental stimuli influence users' affective evaluations. Service convenience research further suggests that reduced time and effort costs enhance perceived value and satisfaction in service encounters10. Accordingly, it is hypothesized that access convenience positively influences affective satisfaction (H1).
Passing time is a leisure-oriented motivation for consuming short-form content. Prior research suggests that time-oriented consumption motives generate positive emotional responses and increase satisfaction. Therefore, we hypothesize that passing time positively influences affective satisfaction (H2).
Content quality reflects users' perceptions of the relevance and entertainment value of media content. Prior studies consistently identify it as a major determinant of user satisfaction and continued engagement19. Accordingly, it is hypothesized that content quality positively influences affective satisfaction (H3).
Affective satisfaction and habit have consistently been identified as important antecedents of continuance intention in post-adoption contexts. Prior habit research further shows that repeated performance in stable contexts strengthens automaticity over time, while mobile media environments can intensify routine-based usage patterns4,20. Hence, we propose that affective satisfaction positively influences continuance intention (H4).
Habit refers to automatic behavioral tendencies that develop through repeated past behavior in stable contexts6,17. In post-adoption contexts, repeated positive experiences facilitate the formation of habitual usage patterns, as users increasingly rely on automated responses rather than conscious evaluation6,17. From a reinforcement-learning perspective, repeated behaviors accompanied by positive affective outcomes strengthen associative learning processes and increase the likelihood of future automatic enactment21. Once a habit is formed, it becomes a key mechanism that translates satisfaction into behavioral persistence. Habitual users tend to continue engaging with content with less cognitive effort, which strengthens continuance intention6. Accordingly, habit is conceptualized in this study as a mediating mechanism that links affective satisfaction to continuance intention. Based on the above rationale, it is hypothesized that affective satisfaction positively influences habit (H5), habit positively influences continuance intention (H6), and habit mediates the relationship between affective satisfaction and continuance intention (H7). Furthermore, affective satisfaction and habit are proposed to sequentially mediate the relationships between access convenience and continuance intention (H8a), passing time and continuance intention (H8b), and content quality and continuance intention (H8c).
Although prior studies have substantially advanced understanding of continuance behavior in digital media environments, several important gaps remain. Existing research has predominantly focused on traditional streaming, social media, or technology adoption contexts and has generally conceptualized satisfaction and habit as parallel determinants of continuance intention. Comparatively little attention has been devoted to understanding how structurally compressed short-form environments may shape the psychological process linking affective satisfaction and habit formation. Table 13,6,10,18,22summarizes representative prior studies and highlights the research gaps addressed by the present study.
| Study | Research Context | Main Focus | Key Findings | Research Gap |
| Bhattacherjee (2001)3 | Information Systems | Continuance Intention | Satisfaction predicts continuance intention | Habit formation process not examined |
| Limayem et al. (2007)6 | Information Systems | Habit and Continuance | Habit influences continued system use | Satisfaction and habit treated as separate predictors |
| Venkatesh et al. (2012)10 | Technology Acceptance | Post-adoption Behavior | Behavioral intention predicts continued use | Structural characteristics of digital environments not considered |
| Wu et al. (2025)18 | Short-form Drama | Subscription Intention | Content quality affects continuance through satisfaction | Habit formation mechanism not examined |
| Zhang et al. (2024)22 | Short-form Video | User Satisfaction | Satisfaction improves continued engagement | Satisfaction-to-habit conversion process unexplored |
| Recent Short-form Media Studies | Short-form Content Platforms | User Engagement | Algorithmic exposure increases engagement | Structural reinforcement mechanisms remain under-theorized |
| Present Study | Short-form Drama Ecosystem | Reinforcement-Based Habit Formation | Examines how affective satisfaction facilitates habit formation and continuance intention within structurally compressed environments | Addresses the identified gaps through a sequential affective–behavioral framework |
Table 1: Summary of prior research and identified gaps. This table summarizes representative prior studies on digital continuance, satisfaction, habit, and short-form media engagement. Columns include: study author and year; research context; key constructs examined; the relationship between satisfaction and habit (parallel vs. sequential); and the specific research gap addressed by the present study.
This study empirically analyzes the relationships among independent variables (i.e., access convenience, passing time, and content quality), mediating variables (i.e., affective satisfaction and habit), and the dependent variable (i.e., CI). Gender, age, education, and income were included as control variables.
As shown in Figure 1, the model depicts a dense reinforcement cycle positioned between affective satisfaction and habit formation. This notation represents the structural context of short-form drama ecosystems—characterized by ultra-short episode duration, high re-entry frequency, and algorithmic content delivery—that creates abundant opportunities for cue-response pairing. The model proposes that environmental stimuli influence affective satisfaction, which subsequently facilitates habitual engagement under structurally compressed reinforcement cycles. Short-form ecosystems exhibit dense cue-response associations and repeated engagement opportunities that may strengthen the association between satisfaction and habit23,24.
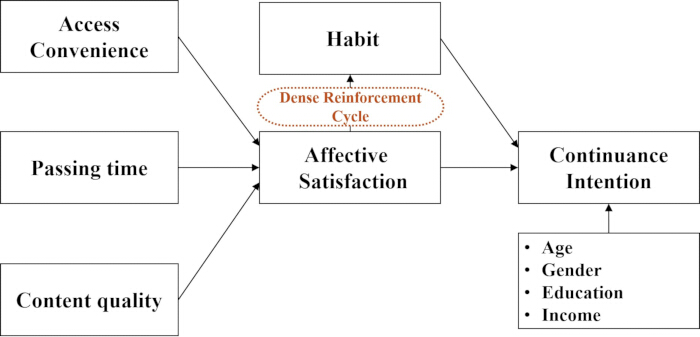
Figure 1: Reinforcement-based habit formation model in short-form drama environments. The 'Dense Reinforcement Cycle' denotes the high-frequency cue-response opportunities characteristic of short-form ecosystems (micro-episodes, rapid re-entry, algorithmic curation), theorized to intensify the satisfaction-to-habit relationship. This structural property is conceptualized as a contextual condition rather than an empirically measured temporal acceleration. Control variables (age, gender, education, and income) are excluded from the depicted pathways for visual clarity. Please click here to view a larger version of this figure.
Access restricted. Please log in or start a trial to view this content.
Protocol
All procedures involving human participants were conducted in accordance with the ethical standards for human-subject research at aSSIST University and Dong-A University. As all responses were anonymized at the time of collection and no personally identifiable information was obtained at any stage, the Institutional Review Board of aSSIST University determined that the study qualified for exemption from full review under the set forth in Article 15 of the Bioethics and Safety Act of the Republic of Korea and the requirements for exemption from review set forth in Article 13 of its Enforcement Rule (https://public.irb.or.kr/pt/pt01/PT0103/PT0103R01.do). The exemption approval ID was obtained before beginning the survey; all participants reviewed an informed consent statement describing the study purpose, voluntary participation, anonymity, data use, and their right to discontinue participation. Only participants who provided electronic informed consent were allowed to proceed. No personally identifiable information was collected.
Data collection and analysis
Sample characteristics
Participants were recruited through Prolific from English-speaking countries, including the United States, the United Kingdom, Canada, Australia, and New Zealand, between July 5 and July 10, 2025. The questionnaire consisted of validated multi-item measures assessing access convenience, passing time, content quality, affective satisfaction, habit, and continuance intention, together with demographic questions. Participants were eligible if they were at least 18 years old, had prior experience watching short-form dramas, and actively used social networking services. Eligibility was confirmed using screening questions asking participants to confirm their age, prior short-form drama viewing experience, and current social networking service use. Participants who did not meet these criteria were excluded before completing the full questionnaire. Attention-check items were embedded in the survey to identify inattentive responses; participants who failed any attention-check item, submitted incomplete responses, or failed screening questions were excluded from analysis. A total of 292 responses were collected. After excluding 32 responses due to screening failure, incomplete responses, or failed attention-check items, 260 valid responses were retained for analysis. The survey required approximately 8–10 min to complete, and participants received approximately €2.00 ($3.440).
Measurement model
Responses were recorded on a 7-point Likert scale ranging from 1 (strongly disagree) to 7 (strongly agree). This study validated the research model using the PLS-SEM25,26. PLS-SEM was selected because the study is prediction-oriented, examines a relatively complex mediation model, and focuses on explained variance in endogenous constructs.
Mediation analysis
Statistical significance was evaluated using bias-corrected bootstrapping with 5,000 resamples (Figure 2). Standardized path coefficients, indirect effects, effect sizes (f2), predictive relevance (Q2), and 95% confidence intervals were examined to evaluate the proposed hypotheses and mediation effects.
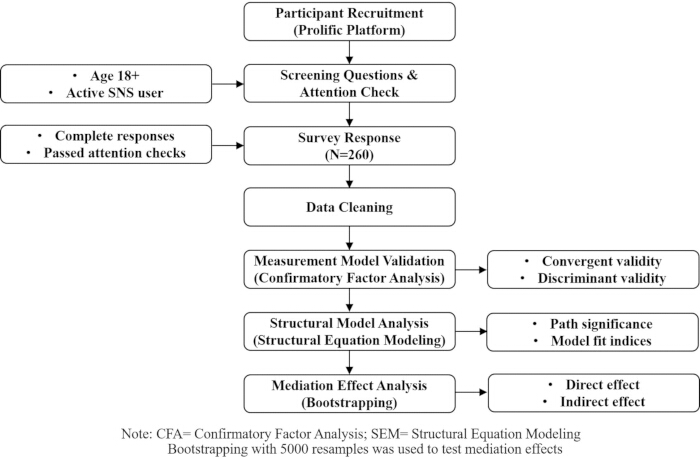
Figure 2: Research procedure and data analysis workflow. Eligible participants were active SNS users aged 18 years or older. The figure illustrates participant recruitment through the online survey platform, screening and attention-check procedures, survey data collection (N = 260), data cleaning, measurement model assessment, structural model assessment using PLS-SEM, and mediation testing through bootstrapping with 5,000 resamples. Please click here to view a larger version of this figure.
Structural model
Validated measurement scales for all study constructs were adapted from previously published studies. Minor wording modifications were made where necessary to ensure their suitability for the short-form drama context. The measurement items are presented in Table 2. Although the content quality scale was originally developed in broader streaming and digital entertainment contexts, it captures users' perceptions of the breadth and diversity of entertainment. In short-form drama contexts, entertainment formats may include hybrid or cross-genre elements that extend beyond traditional narrative episodes. Therefore, the item referring to entertainment variety reflects perceived content diversity rather than literal sports broadcasting and is conceptually consistent with the construct of content quality in this study.
| Construct | Item | Question |
| Access convenience | AC1 | I could watch short-form drama anytime I wanted. |
| AC2 | I could watch short-form drama wherever I am. | |
| AC3 | I could use any digital device to access short-form drama content. | |
| Passing time | PT1 | I would watch short-form dramas because it passes the time away, particularly when I am bored |
| PT2 | I would watch short-form dramas when I have nothing better to do | |
| PT3 | I would watch short-form dramas because it gives me something to occupy my time | |
| Content quality | CQ1 | Short-form drama content offers a wide range of content. |
| CQ2 | Short-form drama content offers exclusive and original content. | |
| CQ3 | Short-form drama content provides a diverse range of entertaining episodes and genres. | |
| CQ4 | Short-form drama content offers a wide variety of global content. | |
| Affective media satisfaction | AS1 | I feel happy after spending time with short-form drama |
| AS2 | Short-form drama gives me pleasure | |
| AS3 | Short-form drama experience is enjoyable | |
| AS4 | Feel good after watching short-form drama | |
| Habit | HB1 | I watch short-form drama out of habit. |
| HB2 | I access and use short-form drama contexts without thinking. | |
| HB3 | I use short-form drama contexts naturally. | |
| Continuance intention | CI1 | I intend to use the short-form drama streaming in the near future. |
| CI2 | I am willing to continue using short-form drama content in the near future. | |
| CI3 | I will maintain my engagement with short-form drama content in the near future. |
Table 2: Measurement items of the research model. This table lists the measurement items, construct labels, and source references used to operationalize the research variables. All items were measured on a 7-point Likert scale ranging from 1 (strongly disagree) to 7 (strongly agree). The table presents each construct (access convenience, passing time, content quality, affective satisfaction, habit, and continuance intention), its associated indicator items, and the original study from which each scale was adapted.
Common method bias
Because all variables were collected using self-reported survey data, common method bias (CMB) was assessed using both procedural and statistical remedies. First, several procedural remedies were implemented to reduce potential method bias. Participation was voluntary and anonymous, and respondents were assured that there were no right or wrong answers. Measurement items were adapted from validated prior studies and were carefully reworded to fit the short-form drama context. The questionnaire was structured to minimize evaluation apprehension and reduce item ambiguity. Second, Harman's single-factor test was conducted to examine whether a single factor accounted for the majority of the variance. The unrotated exploratory factor analysis revealed that the first factor explained less than 50% of the total variance, suggesting that common method bias is unlikely to be a serious concern. Third, full collinearity variance inflation factors (VIFs) were examined following Kock and Mayfield27. All VIF values were below the conservative threshold of 3.3 (Table 3), indicating that common method bias does not substantially affect the model estimates. Nevertheless, because all variables were collected from the same respondents within a single survey wave, residual common-method bias cannot be completely ruled out.
| Inner Model Path | VIF |
| AC→AS | 1.342 |
| AS→HB | 1.000 |
| AS→CI | 1.933 |
| CQ→AS | 1.410 |
| HB→CI | 1.939 |
| PT→AS | 1.154 |
Table 3: Collinearity statistics (VIF). This table presents the variance inflation factor (VIF) values for all predictor constructs used in the structural model. Rows list each predictor construct (access convenience, passing time, content quality, affective satisfaction, and habit), and the corresponding VIF values are reported in the adjacent column. VIF values were examined to assess potential multicollinearity among constructs and to evaluate the likelihood of common method bias.
Troubleshooting and modifications
If a substantial number of responses failed the screening or attention-check criteria, the eligibility criteria were refined and the survey instructions clarified to ensure participants had genuine prior experience with short-form drama. If internal consistency reliability fell below recommended thresholds (e.g., composite reliability < 0.70) or average variance extracted (AVE) fell below 0.50, item loadings were examined, and poorly performing indicators were removed while maintaining theoretical coherence. If multicollinearity was detected (e.g., variance inflation factor values exceeded recommended limits), construct specifications were reassessed, and redundant indicators were removed. If mediation or moderation effects were non-significant, the sample size was increased and/or construct operationalization was re-examined to ensure adequate statistical power. Bootstrapping was conducted using a sufficient number of subsamples (e.g., 5,000) to obtain stable parameter estimates.
Access restricted. Please log in or start a trial to view this content.
Results
Sample characteristics
Table 4 shows a well-balanced sample of 260 respondents across key demographic categories. By age, the largest group is participants in their 20s or younger (38.8%), followed by those in their 30s (32.3%). Respondents in their 40s (14.2%) and 50s (14.6%) are represented in smaller but similar proportions. Gender is almost evenly distributed, with 49.2% male and 50.8% female participants. In terms of education, university graduates make u...
Access restricted. Please log in or start a trial to view this content.
Discussion
This study aimed to explain continuance intention in short-form drama contexts by integrating digital experience factors, affective satisfaction, and habit formation within the S-O-R framework. The findings provide strong empirical support for the proposed sequential mechanism and suggest that digital continuance is best understood as a dynamic affective–behavioral reinforcement process. Digital experience factors—access convenience, passing time, and content quality—significantly influence affective sa...
Access restricted. Please log in or start a trial to view this content.
Disclosures
The authors declare no conflicts of interest.
Acknowledgements
This work was supported by research funding from aSSIST University.
Access restricted. Please log in or start a trial to view this content.
Materials
| Name | Company | Catalog Number | Comments |
|---|---|---|---|
| Chatgpt 5.2 | OpenAI | RRID:SCR_023775 | Enhancing readability and grammar check, https://www.chatgpt.com/ |
| Prolific (Online Participant Recruitment Platform) | Prolific Academic Ltd | Not available / Not identified | Online platform used to recruit survey participants. Participants were screened based on eligibility criteria (e.g., current employment in an organization with AI adoption experience) and compensated according to Prolific's fair-pay guidelines. https://www.prolific.com/ |
| Qualtrics (Online Survey Platform) | Qualtrics, LLC | RRID:SCR_016728 | Web-based survey platform used for questionnaire design, distribution, and response data collection. All measurement items were administered via Qualtrics using a 7-point Likert scale (1 = strongly disagree, 7 = strongly agree). https://www.qualtrics.com/ |
| SmartPLS 4.0 (PLS-SEM Software) | SmartPLS GmbH | RRID:SCR_022040 | Used for all Partial Least Squares Structural Equation Modeling (PLS-SEM) analyses, including outer model assessment (composite reliability, AVE, HTMT), inner model path analysis (bootstrapping, 5,000 samples), MICOM 3-step compositional invariance testing (permutation, 1,000 draws), and PLS-MGA between-group difference tests. https://smartpls.com/ |
References
- He Z, et al. User immersion-aware short video recommendation. ACM Trans Inf Syst. 2025;44(1):1-33.
- Zhou R. Understanding the impact of TikTok's recommendation algorithm on user engagement. Int J Comput Sci Inf Technol. 2024;3(2):201-208.
- Bhattacherjee A. Understanding information systems continuance: An expectation-confirmation model. MIS Q. 2001;25(3):351-370.
- Oulasvirta A, Rattenbury T, Ma L, Raita E. Habits make smartphone use more pervasive. Pers Ubiquitous Comput. 2012;16(1):105-114.
- Peters H, et al. Social media use is predictable from app sequences: Using LSTM and transformer neural networks to model habitual behavior. Comput Hum Behav. 2024;161:108381.
- Limayem M, Hirt SG, Cheung CM. How habit limits the predictive power of intention: The case of information systems continuance. MIS Q. 2007;31(4):705-737.
- Mehrabian A, Russell JA. A verbal measure of information rate for studies in environmental psychology. Environ Behav. 1974;6(2):233.
- Eroglu SA, Machleit KA, Davis LM. Atmospheric qualities of online retailing: A conceptual model and implications. J Bus Res. 2001;54(2):177-184.
- Islam JU, et al. Impact of website attributes on customer engagement in banking: A solicitation of stimulus-organism-response theory. Int J Bank Mark. 2020;38(6):1279-1303.
- Venkatesh V, Thong JYL, Xu X. Consumer acceptance and use of information technology: Extending the unified theory of acceptance and use of technology. MIS Q. 2012;36(1):157-178.
- Berry LL, Seiders K, Grewal D. Understanding service convenience. J Mark. 2002;66(3):1-17.
- Kim J, Fesenmaier DR. Sharing tourism experiences: The posttrip experience. J Travel Res. 2017;56(1):28-40.
- Quan-Haase A, Young AL. Uses and gratifications of social media: A comparison of Facebook and instant messaging. Bull Sci Technol Soc. 2010;30(5):350-361.
- Whiting A, Williams D. Why people use social media: A uses and gratifications approach. Qual Mark Res Int J. 2013;16(4):362-369.
- DeLone WH, McLean ER. The DeLone and McLean model of information systems success: A ten-year update. J Manag Inf Syst. 2003;19(4):9-30.
- Hennig-Thurau T, Gwinner KP, Gremler DD. Understanding relationship marketing outcomes: An integration of relational benefits and relationship quality. J Serv Res. 2002;4(3):230-247.
- Wood W, Neal DT. A new look at habits and the habit-goal interface. Psychol Rev. 2007;114(4):843-863.
- Wu T, Jiang N, Sharif SP, Chen M. Explaining subscription intention for video streaming platforms in China: Integrating UTAUT2 model, perceived value theory, and SOR theory. PLoS One. 2025;20(5):e0322860.
- Prabhavathy R, Senthilkumar S. User experiences in over-the-top (OTT) streaming media platform services. Qubah Acad J. 2025;5(2):82-99.
- Gardner B. A review and analysis of the use of "habit" in understanding, predicting and influencing health-related behaviour. Health Psychol Rev. 2015;9(3):277-295.
- Neal DT, Wood W, Labrecque JS, Lally P. How do habits guide behavior? Perceived and actual triggers of habits in daily life. J Exp Soc Psychol. 2012;48(2):492-498.
- Zhang K, et al. SaqRec: Aligning recommender systems to user satisfaction via questionnaire feedback. 33rd ACM International Conference on Information and Knowledge Management. 2024;doi.org/10.1145/3627673.367964.
- Peters H, et al. Context-aware prediction of active and passive user engagement: Evidence from a large online social platform. J Big Data. 2024;11(1):110.
- Wood W. Habits, goals, and effective behavior change. Curr Dir Psychol Sci. 2024;33(4):226-232.
- Lohmöller JB. Predictive vs. structural modeling: PLS vs. ML. Latent variable path modeling with partial least squares. Physica, Heidelberg. 1989.
- Sarstedt M, Ringle CM, Hair JF. Treating unobserved heterogeneity in PLS-SEM: A multi-method approach. Partial least squares path modeling: Basic concepts, methodological issues and applications. Springer, Cham. 2017.
- Kock N, Mayfield M. PLS-based SEM algorithms: The good neighbor assumption, collinearity, and nonlinearity. Inf Manag Bus Rev. 2015;7(2):113-130.
- Henseler J, Ringle CM, Sarstedt M. A new criterion for assessing discriminant validity in variance-based structural equation modeling. J Acad Mark Sci. 2015;43(1):115-135.
- Alruwaili RF. Scroll immersion and short-form video use: Predictors of attention, memory, and fatigue among Saudi social media users. Acta Psychol. 2025;260:105674.
- Sutrisno SS. Attention in the age of TikTok: Examining the cognitive impact of short-form video consumption. San Jose State University, 2025. https://scholarworks.sjsu.edu/etd_theses/5697/.
Access restricted. Please log in or start a trial to view this content.
Reprints and Permissions
This article has been published
Video Coming Soon