This protocol describes a standardized three-arm controlled trial for the evaluation of participatory music education in university students. It details participant screening, procedures for intervention delivery, active and waitlist comparator procedures, fidelity monitoring, safety response, outcome assessment, and longitudinal assessment of affect, perceived stress, and social connectedness.
Method Article
Protocol for a Three-Arm Controlled Trial of Participatory Music Education in University Students
In This Article
Summary
Abstract
Participatory music education may offer a practical group-based approach to supporting university student wellbeing, but protocols that separate active music participation from general music exposure remain limited. This article describes a standardized three-arm controlled trial for evaluating the emotional and social outcomes of participatory music education in university students aged 18–26 years. The age range is used to keep the sample developmentally comparable and reduce heterogeneity related to mature, returning, or part-time students. Participants are allocated to a 6-week participatory music education group, an active-control music appreciation group, or a waitlist-control group. The participatory program includes rhythm practice, active music-making, same-room subgroup improvisation, guided co-creation, and structured reflection. The active-control condition matches session duration, facilitator contact, the group setting, and music exposure but excludes instrument handling, synchronized performance, improvisation, composition, and co-creation. Both active arms receive one 90-min session per week for 6 weeks. Outcomes are measured at baseline, within 48 h after the final session, and at a 4-week follow-up using the Positive and Negative Affect Schedule, the 10-item Perceived Stress Scale, and the Social Connectedness Scale–Revised. The protocol specifies facilitator scripts, outside-session music activity logs, fidelity monitoring, psychological distress response procedures, and predefined mixed-effects analyses with sensitivity analyses for contamination, missing data, baseline stressor status, and session-level clustering. Representative data from 90 participants showed greater baseline-to-post-intervention changes in the participatory music education group for positive affect, perceived stress, and social connectedness, with similar patterns observed at follow-up. Significant adjusted pairwise contrasts showed absolute Hedges’ g values ranging from 1.07 to 2.02. The protocol provides a reproducible framework for testing whether active music participation provides additional emotional and social benefits beyond passive music exposure in university settings.
Introduction
University students face academic demands, role transitions, changes in peer relationships, and uncertainty about future employment, all of which may increase psychological distress and highlight the need for scalable wellbeing interventions within higher education settings1. A systematic review and meta-analysis of undergraduate students reported a high pooled prevalence of non-specific anxiety, supporting the need for feasible, prevention-oriented interventions that can be delivered in campus environments2. In China, student mental health has also become an important concern because academic pressure, competitive assessment, and employment-related uncertainty may interact with social and developmental transitions during early adulthood.
Participatory music education emphasizes active music-making, coordination, and co-creation rather than passive listening. It has been proposed as a low-cost, group-based approach for supporting mental wellbeing because it combines emotional expression, peer interaction, shared attention, and embodied participation3. From a mechanistic perspective, synchronized musical activities may promote social bonding through self–other alignment and coordinated group effort4. Studies of group rhythmic activities, including drumming, have also reported improvements in affective and social outcomes, suggesting that active musical participation may influence both emotional state and social functioning5.
Recent China-based evidence supports the relevance of music-based approaches for university populations. Music education strategies have been evaluated for anxiety and depression among Chinese university students6. Experimental evidence has also suggested that conventional and technology-enhanced music therapy can reduce anxiety and improve mental wellbeing in Chinese students7. In addition, Five-Element Music combined with Eight-Section Brocade and group impromptu music therapy have shown benefits for depression, anxiety, sleep, test anxiety, and emotional regulation among Chinese medical and vocational college students8,9. These studies provide useful local evidence; however, many focus on receptive listening, combined traditional health practices, clinical-style music therapy, or specific medical student populations rather than on a standardized participatory music education protocol for general university students.
Existing music-based intervention studies remain heterogeneous in their intervention components, session structure, and comparator conditions, which limits reproducibility and makes it difficult to isolate the contribution of active participation beyond general exposure to music10. Many behavioral intervention studies also rely on usual-care or no-intervention controls, leaving nonspecific factors such as attention, expectancy, group contact, and repeated assessment insufficiently controlled11. To address this limitation, the present protocol uses both an active control condition and a waitlist control condition. The active control matches session duration, facilitator contact, discussion structure, and music exposure while excluding instrument handling, synchronized performance, leadership rotation, improvisation, and co-creation12.
The protocol assesses affect, perceived stress, and social connectedness at baseline, immediately after the 6-week intervention, and at the 4-week follow-up using the Positive and Negative Affect Schedule, the 10-item Perceived Stress Scale, and the Social Connectedness Scale–Revised13,14,15. Eligibility is restricted to students aged 18–26 years to define a relatively homogeneous young adult university cohort and reduce heterogeneity related to older returning students, part-time enrollment, employment demands, and family responsibilities. This criterion is used for standardization rather than to imply that students older than 26 years cannot benefit from participatory music education.
To reduce contamination, participants are asked not to begin any new structured participatory music-making program, ensemble rehearsal, group singing, drumming circle, or music therapy activity during the intervention and follow-up periods. Routine personal music listening is not restricted because it is common in students’ daily lives and is not equivalent to the participatory group processes targeted by this protocol. Outside-session music activities are monitored using a brief weekly log that records personal music listening, informal singing or instrument use, organized group music-making, and participation in any new music-related course or club activity. Any new structured group music-making outside the assigned condition is coded as a contamination indicator and examined in sensitivity analyses.
Protocol
The study was conducted in accordance with institutional and national guidelines for research involving human participants. Before recruitment, the study procedures were reviewed and approved by the School of Humanities, Arts and Design, Guangxi University of Science and Technology, with an institutional ethics exemption/authorization issued on December 25, 2025. Written site authorization was obtained from each institution involved in participant recruitment or intervention delivery. All participants provided written informed consent before screening, baseline assessment, randomization, and intervention delivery. Participation was voluntary, and participants could withdraw at any time without academic penalty or loss of access to campus services. Consent forms were stored separately from study data. All datasets, logs, tables, and figures were identified using unique participant codes. The code-to-contact key was stored in an encrypted file accessible only to designated study personnel. Participants received written information regarding confidentiality, data storage, withdrawal procedures, and referral pathways for campus counseling or student support services. If psychological distress occurred, the participant stopped the current activity and the predefined safety procedure was implemented: brief discomfort was managed with a short pause and optional return to the session; persistent distress resulted in discontinuation of the session and provision of referral information; and any immediate safety concern was managed according to institutional emergency procedures. The event, actions taken, referral offered, and participation status were recorded in the adverse event log.
1. Study Preparation and Materials
- Room Setup
- Reserve a quiet classroom, rehearsal room, or multipurpose activity space for 10–15 participants. Ensure that the room has adequate ventilation, stable lighting, minimal external noise, and no scheduled interruptions during the 90-min session.
- Arrange chairs in a closed circle and maintain a clear central area of approximately 1–2 m. Use a 5-min pre-session buffer only for participant arrival, seating, attendance confirmation, and instrument distribution. Do not use this buffer to extend, replace, or shorten any part of the standardized 90-min session.
- Record participants arriving within the 5-min buffer as on time. Participants arriving after the formal session start but within 10 min should join at the next activity transition and be coded as a minor participant-related deviation. Participants arriving more than 10 min after the session begins may observe but are recorded as having an incomplete session. Participants arriving more than 25 min after the session begins are recorded as absent for adherence calculations. Record the arrival time, missed intervention component, and deviation code in the fidelity log.
- Instruments
- Prepare at least 14 non-branded hand-held percussion instruments: 12 for participants and two spares. Use specification-based instruments, such as frame drums (approximately 25–35 cm in diameter), shakers (approximately 15–25 cm in length), and claves or rhythm sticks (approximately 18–25 cm in length).
- Inspect all instruments before each session for cleanliness, structural integrity, sound production, and safe handling. Record the instrument category, quantity, substitutions, and reasons for any substitutions in the implementation log.
- Facilitator Materials
- Use the standardized six-session participatory music education scripts provided in Supplementary File 1. Each script specifies the intervention blocks, target durations, activity content, transition wording, standardized verbal prompts, reflection questions, and fidelity checkpoints.
- Use the matched active-control music appreciation guide provided in Supplementary File 2. The guide specifies the weekly listening themes, music excerpt categories, listening durations, discussion prompts, and prohibited activities.
- Prepare attendance sheets, weekly outside-session music activity logs, fidelity checklists, and adverse event logs before participant recruitment. Apply the predefined delivery thresholds and deviation codes described in Supplementary Table 1.
- Train facilitators and research assistants before participant enrollment in session timing, standardized verbal prompts, late-arrival procedures, active-control boundaries, confidentiality procedures, psychological distress response, adverse event documentation, and fidelity coding.
- Measures and Data Storage
- Prepare paper-based or electronic versions of the Positive and Negative Affect Schedule, the 10-item Perceived Stress Scale, and the Social Connectedness Scale–Revised. Use the same administration mode for each participant across all assessment time points whenever feasible.
- Create restricted-access folders for consent forms, participant identification keys, screening records, raw datasets, scored datasets, fidelity logs, adverse event logs, statistical scripts, and analysis outputs. Store identifiable information separately from the outcome data.
- Do not provide facilitators with access to outcome datasets. Provide the statistician with only de-identified datasets containing masked group labels.
- Tracking and Reporting Anchors
- Create a participant tracking sheet containing the participant code, eligibility status, consent completion, assigned study arm, baseline assessment completion, weekly attendance, completion of outside-session music activity logs, post-intervention assessment completion, follow-up completion, withdrawal status, and, where voluntarily provided, the reason for withdrawal.
- Present the study design, randomization procedure, and assessment schedule in Figure 1. Summarize baseline participant characteristics, prior music training, recent 7-day major stressor status, baseline balance tests, attendance, and adherence by study arm in Table 1.
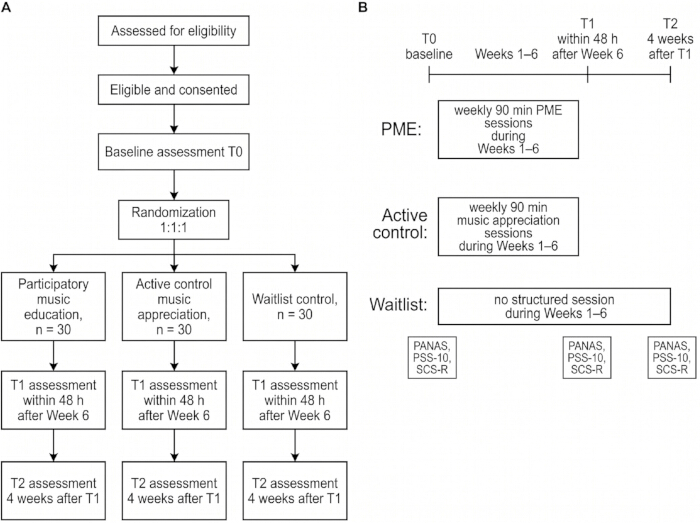
Figure 1. Study design and assessment schedule. (A) Flow diagram of participant recruitment, eligibility screening, informed consent, baseline assessment (T0), and 1:1:1 allocation to the participatory music education (PME), active-control music appreciation, or waitlist-control groups (n = 30 per group). Randomization was performed using sex-stratified block randomization (block size = 6), with allocation concealment maintained until completion of the baseline assessment. (B) Study timeline showing weekly 90-min participatory music education and active-control sessions during Weeks 1–6, no structured intervention for the waitlist-control group, the post-intervention assessment (T1) conducted within 48 h after the Week 6 session, and the follow-up assessment (T2) conducted 4 weeks after T1. PANAS, PSS-10, and Social Connectedness Scale–Revised (SCS-R) were administered at T0, T1, and T2. Please click here to view a larger version of this figure.
| Variable | Participatory Music Education (n = 30) | Active Control (n = 30) | Waitlist Control (n = 30) | P value |
| Age, years | 20.34 ± 1.50 | 20.45 ± 1.70 | 20.48 ± 1.54 | 0.94 |
| Female, n (%) | 18 (60.0) | 19 (63.3) | 24 (80.0) | 0.18 |
| Male, n (%) | 12 (40.0) | 11 (36.7) | 6 (20.0) | — |
| Undergraduate, n (%) | 24 (80.0) | 25 (83.3) | 24 (80.0) | 0.92 |
| Postgraduate, n (%) | 6 (20.0) | 5 (16.7) | 6 (20.0) | — |
| Arts and humanities, n (%) | 8 (26.7) | 7 (23.3) | 8 (26.7) | 0.95 |
| Social sciences and business, n (%) | 10 (33.3) | 11 (36.7) | 9 (30.0) | — |
| Science, engineering, and health, n (%) | 12 (40.0) | 12 (40.0) | 13 (43.3) | — |
| Prior music training: none/minimal, n (%) | 18 (60.0) | 18 (60.0) | 20 (66.7) | 0.71 |
| Prior music training: 1–3 years, n (%) | 6 (20.0) | 9 (30.0) | 8 (26.7) | — |
| Prior music training: ≥4 years, n (%) | 6 (20.0) | 3 (10.0) | 2 (6.7) | — |
| Current organized group music-making, n (%) | 3 (10.0) | 2 (6.7) | 3 (10.0) | 0.86 |
| Recent 7-day major stressor, n (%) | 8 (26.7) | 7 (23.3) | 9 (30.0) | 0.85 |
| Baseline personal music listening ≥3 days/week, n (%) | 21 (70.0) | 22 (73.3) | 20 (66.7) | 0.86 |
| Attendance rate (sessions attended/6) | 0.87 ± 0.09 | 0.84 ± 0.09 | — | 0.2 |
| Protocol-adherent participants (≥5 of 6 sessions), n (%) | 25 (83.3) | 23 (76.7) | — | 0.53 |
Table 1: Baseline participant characteristics and attendance. Baseline demographic characteristics, academic characteristics, previous music training, recent 7-day major stressor status, baseline music exposure, intervention attendance, and protocol adherence by study arm. Values are presented as mean ± SD or n (%).
2. Participant Recruitment and Screening
- Recruitment
- Recruit undergraduate and postgraduate students aged 18–26 years through campus announcements, institutional email lists, student service channels, and approved classroom announcements. Use the same recruitment materials across all study arms.
- Use the 18–26-year age range to define a comparable young adult university cohort and reduce heterogeneity associated with mature returning students, part-time enrollment, employment demands, and family responsibilities.
- Provide prospective participants with information on the study purpose, random assignment procedure, session duration, weekly frequency, total study duration, assessment time points, voluntary participation, withdrawal rights, confidentiality procedures, and the informed consent requirement. Describe the study as a comparison of different music-related and non-intervention conditions without presenting any study arm as superior.
- Screening and Eligibility
- Screen participant eligibility using the standardized online screening questionnaire provided in Supplementary File 3 before assigning a participant identification code.
- Include students who are 18–26 years of age, enrolled full-time in an undergraduate or postgraduate program, able to provide written informed consent, able to attend at least five of the six intervention sessions, willing to complete all assessment time points, and willing to complete the weekly outside-session music activity logs.
- Exclude students enrolled in formal music performance degree programs, receiving concurrent structured group psychotherapy or structured music therapy, with moderate or severe hearing impairment affecting group participation, with physical or neurological limitations preventing the safe use of hand-held percussion instruments, with a self-reported severe psychiatric or psychological condition that would make group participation inappropriate, receiving psychiatric medication for an unstable condition, having undergone a psychiatric medication change within the previous 4 weeks, or unable to meet the attendance requirement.
- Record current organized group music-making at screening, including ensemble rehearsals, choir participation, band practice, drumming circles, music club performances, or structured music therapy. Stable informal personal music habits do not constitute exclusion criteria.
- Instruct participants not to initiate any new structured participatory music-making activities during the 6-week intervention and the 4-week follow-up period. Routine personal music listening is not restricted. Record weekly personal music listening, informal singing or instrument use, organized group music-making, and participation in any new music-related course or club activity using the outside-session activity log.
- Code any new structured group music-making outside the assigned study condition as contamination. Retain the participant in the intention-to-treat analysis and evaluate contamination in the sensitivity analyses.
- Record exclusion reasons using predefined categories only. Do not collect unnecessary diagnostic details. Provide information regarding available campus support services when screening indicates that additional support may be appropriate.
- Participant Identification and Baseline Descriptors
- Assign a unique participant identification code before randomization. Use this code consistently for screening records, consent documentation, assessment forms, session logs, fidelity records, and analysis datasets.
- Store the participant code-to-contact key in an encrypted file. Do not include participant names, student identification numbers, telephone numbers, email addresses, or other direct identifiers in the analysis datasets.
- Record participant age, sex, academic level, academic discipline, previous music training, prior group music-making experience, baseline outside-session music activity level, and recent major stressor status during the previous 7 days.
- If a participant withdraws, record the withdrawal status and any voluntarily provided reason. Retain previously collected de-identified data unless the participant requests deletion where permitted by institutional policy.
3. Baseline Assessment
- Administration
- Administer the baseline assessments in a quiet room before any study-related group activity. Seat participants with adequate spacing and instruct them to complete the questionnaires independently.
- Use the same administration mode at baseline, post-intervention, and follow-up whenever feasible. Record the administration mode for each participant.
- Administer the outcome measures in the following order: the Positive and Negative Affect Schedule, the 10-item Perceived Stress Scale, and the Social Connectedness Scale–Revised.
- Review each questionnaire immediately for missing responses. Ask participants to complete unintentionally omitted items when feasible. Participants may decline to answer any item without penalty.
- Recent Stressor Check
- Ask each participant: “During the past 7 days, did you experience a major stressful event that substantially affected your mood, stress, sleep, or study routine?”
- For participants responding “yes,” record only a broad optional category (academic, interpersonal, family, financial, health-related, or other).
- Code the recent 7-day major stressor status as a binary covariate in the primary linear mixed-effects models. If baseline imbalance is observed between study groups, report the imbalance in Table 1 and retain the covariate in the adjusted model.
- Compare the primary model estimates with and without adjustment for the recent stressor covariate as part of the sensitivity analyses.
- Export and Summary
- Export the completed baseline responses to the restricted-access raw dataset immediately after data collection.
- Score the baseline measures according to Supplementary Table 2. Record the handling of missing items and scale-level missingness in the scoring log.
- Summarize the baseline outcome measures by study arm in Table 2 and report descriptive baseline balance p values.
| Outcome | Participatory Music Education (n = 30) | Active Control (n = 30) | Waitlist Control (n = 30) | P value |
| PANAS positive affect, T0 | 29.23 ± 6.13 | 28.17 ± 5.75 | 29.13 ± 6.58 | 0.764 |
| PANAS negative affect, T0 | 22.33 ± 4.33 | 20.00 ± 6.58 | 21.50 ± 5.12 | 0.247 |
| Ten-item Perceived Stress Scale (PSS-10), T0 | 18.87 ± 5.02 | 19.23 ± 5.13 | 17.87 ± 4.07 | 0.521 |
| Social Connectedness Scale–Revised (SCS-R), T0 | 77.67 ± 11.40 | 74.27 ± 11.47 | 77.53 ± 13.76 | 0.481 |
Table 2: Baseline outcome measures. Baseline (T0) scores for the Positive and Negative Affect Schedule (PANAS) positive affect, PANAS negative affect, the Ten-item Perceived Stress Scale (PSS-10), and the Social Connectedness Scale–Revised (SCS-R) by study arm. Values are presented as mean ± SD.
4. Randomization and Allocation
- Sequence Generation
- Generate the allocation list in R using 1:1:1 block randomization with a fixed block size of 6 and stratification by sex.
- Set the random seed to 20260302. Use the reproducible R script provided in Supplementary File 4, including the package version, random seed, block size, stratification variable, allocation ratio, and output format.
- Generate neutral allocation labels. Store the link between the neutral labels and the study arms in a password-protected file that is inaccessible to outcome assessors and the statistician until the analysis code has been finalized.
- Allocation Concealment and Assignment
- Conceal the allocation sequence using sealed, opaque, sequentially numbered envelopes or a password-protected electronic allocation file.
- Release the allocation only after eligibility has been confirmed, written informed consent has been obtained, and the baseline assessment has been completed.
- Assign participants to the participatory music education, active-control, or waitlist-control group immediately after allocation release. Record the participant code, allocation release date, allocation release time, and responsible staff member in the participant tracking sheet.
- Match the participatory music education and active-control groups with respect to weekly session frequency, session duration, room type, facilitator contact time, and assessment timing.
- Do not provide structured music sessions to the waitlist-control group during the 6-week intervention period. After completion of the follow-up assessment, offer participants access to a condensed music education session or an equivalent campus activity, if permitted by the institution.
- Require all participants to complete the weekly outside-session music activity logs.
- Blinding During Analysis
- Use participant identification codes only in the analysis datasets and mask the intervention groups as Group A, Group B, and Group C before statistical analysis.
- Keep the statistician masked to the group identities during the primary model fitting whenever feasible.
- Unmask the group labels only after the primary model specifications, sensitivity analyses, and figure templates have been finalized. Record the unmasking, protocol deviations, contamination events, and any analysis changes in the analysis log.
5. Intervention Delivery
- Session Timing and Active Control
- Deliver one 90-min session per week for six consecutive weeks in both active study arms. Maintain the same weekly cadence, room type, facilitator contact time, and session duration. Use the 5-min pre-session buffer described in Step 1.1.2 only for participant arrival, seating, attendance confirmation, and instrument distribution.
- Deliver the active-control condition as structured music appreciation using the curated music library and weekly discussion guide provided in Supplementary File 2. Each session includes orientation, guided listening, silent note-taking, structured discussion, and a closing summary.
- Do not permit instrument handling, synchronized clapping, singing, group performance, improvisation, composition, or co-creation during the active-control condition. Keep facilitator prompts descriptive and reflective. Code any prohibited activity as a fidelity deviation and classify it as facilitator-related or participant-related.
- Participatory Music Education Structure
- Conduct the standardized 90-min participatory music education session using the six-session facilitator script provided in Supplementary File 1.
- Begin with a 10-min grounding warm-up consisting of slow breathing, posture adjustment, and simple pulse-clapping activities.
- Conduct a 25-min rhythm circle. Teach one core rhythmic pattern, practice call-and-response variations, and rotate short leadership opportunities among participants.
NOTE: If a brief reset is needed, pause immediately after the rhythm circle for no longer than 2 min to allow participants to drink water, receive a brief recap, or re-center as a group. Resume the session immediately and complete all remaining intervention components during the same session. - Conduct a 25-min improvisation activity in the same room. Divide participants into two or three subgroups within the circle or into separate areas of the room. Assign each subgroup one musical role (pulse, texture, or melody/riff). Permit subgroups to hear one another during preparation before recombining all subgroups for one brief whole-group performance.
- Conduct a 20-min co-creation activity using one fixed weekly prompt, such as “a week on campus.” Ask each subgroup to create and perform one short sound story, rhythm sequence, or vocal-percussion piece.
- Conduct a 10-min structured reflection using the following standardized questions: “What emotion best describes your current state?” “What was one noticeable social moment?" and "What is one takeaway from today’s activity?”
- Do not split any intervention component across different days. Code any omitted core component, incorrect sequence, or intervention component shortened beyond the predefined tolerance as a facilitator-related fidelity deviation.
- Reporting Anchor
- Present the standardized 90-min participatory music education session structure in Figure
- Record the timing of each intervention block, pause-point use, omitted or shortened components, extended components, late arrivals, active-control boundary violations, and reasons for deviations immediately after each session according to Supplementary Table 1.
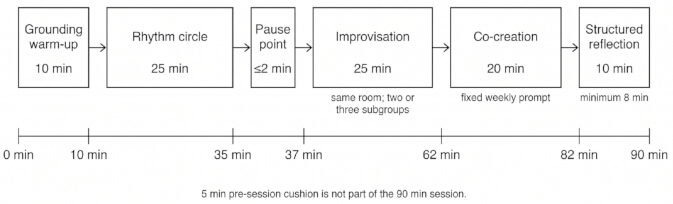
Figure 2. Standardized participatory music education (PME) session structure. Standardized 90-min participatory music education session consisting of a 10-min grounding warm-up, 25-min rhythm circle, optional pause point (≤2 min), 25-min same-room subgroup improvisation, 20-min co-creation activity using a fixed weekly prompt, and 10-min structured reflection. The optional pause point is included within the 90-min session. The 5-min pre-session buffer used for participant arrival and preparation is not part of the intervention session duration. Please click here to view a larger version of this figure.
6. Fidelity and Safety Monitoring
- Attendance, Fidelity, and Corrective Actions
- Record participant attendance after every intervention session. Define participant-level adherence as attendance at five or more of the six sessions, and apply the late-arrival rule described in Step 1.1.3 when classifying partial attendance. Report adherence rates by study arm in Table 1.
- Complete a fidelity checklist after every participatory music education and active-control session. Code the required intervention components, timing tolerances, pause-point use, prohibited active-control activities, and deviation type according to Supplementary Table 1.
- Classify implementation deviations as facilitator-related or participant-related. Facilitator-related deviations include missed intervention components, incorrect sequencing, unscripted therapeutic advice, staff-initiated active-control boundary violations, timing errors beyond the predefined tolerance, and incomplete fidelity records. Participant-related deviations include late arrival, early departure, refusal to participate in an activity, disruptive behavior, or participant-initiated active-control boundary violations.
- Correct minor timing deviations within the same session by shortening transition periods or facilitator explanations only. Do not shorten the final reflection period to less than 8 min or replace omitted core intervention components with unscripted activities.
- Define a low-fidelity session as any session with one omitted core intervention component, one major active-control boundary violation, a total delivered intervention time of less than 80 min, or more than two block-level timing deviations beyond the predefined tolerance. Retrain the facilitator before the next session if repeated facilitator-related deviations occur.
- Summarize attendance, fidelity scores, deviation types, low-fidelity sessions, corrective actions, facilitator retraining, and safety events in Table 3.
- Safety Response
- Monitor participants for discomfort or psychological distress during screening, assessment, discussion, improvisation, co-creation, and reflection activities.
- Apply the predefined three-level response procedure. Level 1 (brief discomfort) is managed by pausing participation, offering water or a short break, and allowing the participant to return voluntarily. Level 2 (persistent distress) results in discontinuation of that participant’s session, relocation to a private area, and provision of campus support referral information. Level 3 (immediate safety concern) is managed according to institutional emergency procedures.
- Record the date, study group, session number, intervention activity, event level, actions taken, referral offered, return status, and assessment of study relatedness in the adverse event log provided in Supplementary File 5.
| Indicator | Participatory Music Education | Active Control | Waitlist Control |
| Planned sessions, n | 6 | 6 | 0 |
| Standard session duration, min | 90 | 90 | — |
| Attendance rate (sessions attended/6) | 0.87 ± 0.09 | 0.84 ± 0.09 | — |
| Protocol-adherent participants (≥5 of 6 sessions), n (%) | 25 (83.3) | 23 (76.7) | — |
| Fidelity checklist score, Week 1 | 8.92 ± 0.58 | 8.86 ± 0.61 | — |
| Fidelity checklist score, Week 2 | 9.17 ± 0.49 | 9.09 ± 0.66 | — |
| Fidelity checklist score, Week 3 | 9.21 ± 0.51 | 8.98 ± 0.57 | — |
| Fidelity checklist score, Week 4 | 9.29 ± 0.46 | 9.03 ± 0.55 | — |
| Fidelity checklist score, Week 5 | 9.33 ± 0.44 | 8.95 ± 0.54 | — |
| Fidelity checklist score, Week 6 | 9.31 ± 0.48 | 9.02 ± 0.52 | — |
| Mean fidelity score (6 weeks) | 9.20 ± 0.49 | 8.99 ± 0.56 | — |
| Pause point used, n/6 (%) | 2/6 (33.3) | — | — |
| Low-fidelity sessions, n/6 (%) | 0/6 (0.0) | 1/6 (16.7) | — |
| Facilitator-related deviations, n | 1 | 2 | — |
| Participant-related deviations, n | 4 | 5 | — |
| Late-arrival deviations, n | 3 | 4 | — |
| Early-departure deviations, n | 1 | 1 | — |
| Active-control boundary violations, n | — | 1 | — |
| Corrective actions applied, n | 1 | 2 | — |
| Facilitator retraining required, n | 0 | 1 | — |
| Brief discomfort managed without discontinuation, n (%) | 1 (3.3) | 1 (3.3) | — |
| Distress events requiring discontinuation, n (%) | 0 (0.0) | 0 (0.0) | — |
| Adverse events related to study participation, n (%) | 0 (0.0) | 0 (0.0) | — |
Table 3: Implementation, fidelity, and safety indicators. Attendance, intervention fidelity, pause-point use, implementation deviations, corrective actions, facilitator retraining, participant discomfort events, session discontinuations, and adverse events recorded during the 6-week intervention period, summarized by study arm.
7. Post-Intervention Assessment and Follow-up
- T1 and T2 Assessment
- Administer the T1 assessments within 48 h after completion of the Week 6 session for the participatory music education and active-control groups. Administer the T1 assessments for the waitlist-control group during the same calendar week.
- Administer the T2 assessments 4 weeks after T1 using a secure electronic survey link. Send reminder notifications on Day 3 and Day 7 if the survey remains incomplete.
- Use the same outcome measures, administration mode, questionnaire item order, and privacy conditions used at baseline whenever feasible. Record the assessment date, completion status, administration mode, missing items, reminder dates, withdrawal status, and any voluntarily provided reason for withdrawal.
- Export and Reporting
- Export the T1 and T2 responses to the restricted-access raw dataset immediately after data collection. Score all outcome measures according to Supplementary Table 2.
- Present the post-intervention change-from-baseline outcomes in Figure 3.
- Summarize the T1 scores, T2 scores, change-from-baseline values, and T1-to-T2 attenuation in Table 4. Define ΔT1 as T1 − T0, ΔT2 as T2 − T0, and attenuation as ΔT2 − ΔT1.
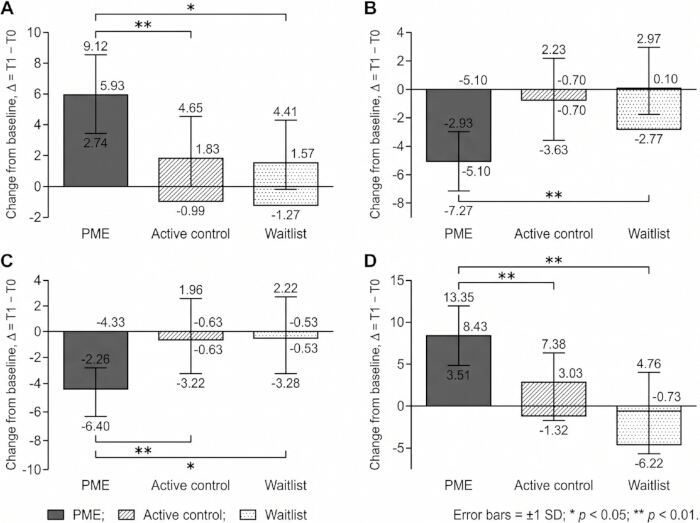
Figure 3. Post-intervention change-from-baseline outcomes. Mean ± SD change scores from baseline (T0) to the post-intervention assessment (T1) for the participatory music education (PME), active-control, and waitlist-control groups. (A) Positive and Negative Affect Schedule (PANAS) positive affect. (B) PANAS negative affect. (C) Ten-item Perceived Stress Scale (PSS-10). (D) Social Connectedness Scale–Revised (SCS-R). The horizontal line represents no change from baseline (Δ = 0). Brackets indicate the predefined comparisons between the PME group and the active-control and waitlist-control groups. Error bars represent ±1 SD. P < 0.05; P < 0.01. Please click here to view a larger version of this figure.
| Outcome | Group | ΔT1 (mean ± SD) | T1 Score (mean ± SD) | ΔT2 (mean ± SD) | T2 Score (mean ± SD) | T1-to-T2 Attenuation |
| PANAS positive affect | Participatory Music Education | 5.93 ± 3.19 | 35.17 ± 7.94 | 7.47 ± 5.24 | 36.70 ± 9.12 | 1.54 |
| Active Control | 1.83 ± 2.82 | 30.00 ± 6.61 | 2.60 ± 3.59 | 30.77 ± 7.26 | 0.77 | |
| Waitlist Control | 1.57 ± 2.84 | 30.70 ± 7.71 | 1.47 ± 4.08 | 30.60 ± 8.10 | −0.10 | |
| PANAS negative affect | Participatory Music Education | −5.10 ± 2.17 | 17.23 ± 5.10 | −4.97 ± 2.98 | 17.37 ± 5.31 | 0.13 |
| Active Control | −0.70 ± 2.93 | 19.30 ± 7.07 | −0.57 ± 4.17 | 19.43 ± 7.37 | 0.13 | |
| Waitlist Control | 0.10 ± 2.87 | 21.60 ± 6.36 | −0.67 ± 3.94 | 20.83 ± 6.89 | −0.77 | |
| Ten-item Perceived Stress Scale (PSS-10) | Participatory Music Education | −4.33 ± 2.07 | 14.53 ± 5.75 | −5.17 ± 3.83 | 13.70 ± 6.66 | −0.84 |
| Active Control | −0.63 ± 2.59 | 18.60 ± 5.90 | −0.77 ± 4.25 | 18.47 ± 7.21 | −0.14 | |
| Waitlist Control | −0.53 ± 2.75 | 17.33 ± 4.58 | 0.27 ± 3.37 | 18.13 ± 4.78 | 0.80 | |
| Social Connectedness Scale–Revised (SCS-R) | Participatory Music Education | 8.43 ± 4.92 | 86.10 ± 11.29 | 9.63 ± 6.54 | 87.30 ± 12.48 | 1.20 |
| Active Control | 3.03 ± 4.35 | 77.30 ± 12.99 | 3.20 ± 4.89 | 77.47 ± 14.22 | 0.17 | |
| Waitlist Control | −0.73 ± 5.49 | 76.80 ± 14.07 | −0.83 ± 8.54 | 76.70 ± 14.78 | −0.10 |
Table 4: Post-intervention and follow-up outcomes. Outcome scores at the post-intervention assessment (T1) and 4-week follow-up (T2), together with change-from-baseline values and T1-to-T2 attenuation for each study arm. ΔT1 = T1 − T0; ΔT2 = T2 − T0; attenuation = ΔT2 − ΔT1.
8. Data Processing and Analysis
- Data Structure and Scoring
- Store the analysis dataset in long format with one row per participant per assessment time point. Include the participant code, masked group label, assessment time point, outcome scores, attendance, contamination indicator, recent 7-day major stressor status, and missingness indicators.
- Name variables and score the Positive and Negative Affect Schedule, the 10-item Perceived Stress Scale, and the Social Connectedness Scale–Revised according to Supplementary Table 2. Apply reverse scoring, total score calculation, range checks, and scale-level missingness rules before model fitting.
- Missing Data
- If exactly one item is missing within a scale at one assessment time point, impute the missing item using the participant’s mean score for the completed items within the same scale at that assessment time point. If two or more items are missing within a scale, treat the corresponding scale score as missing.
- Use linear mixed-effects models as the primary analysis to retain participants with incomplete repeated outcome data under the assumptions of the model.
- If more than 5% of participants have at least one missing scale-level outcome at T1 or T2, conduct a multiple-imputation sensitivity analysis using 20 imputed datasets. Include the study group, assessment time point, baseline outcome score, recent 7-day major stressor status, sex, age, attendance, contamination indicator, and all available outcome scores in the imputation model.
- Compare the estimates obtained from the complete-case, mixed-model, and multiple-imputation analyses. Report whether the conclusions for the predefined group × time comparisons remain unchanged.
- Model Fitting and Reporting
- Fit linear mixed-effects models in R version 4.5.2 using lme4 version 1.1-38. Include fixed effects for study group, assessment time point, the group × time interaction, baseline recent 7-day major stressor status, and any meaningfully imbalanced baseline covariates. Include a participant-level random intercept.
- Evaluate session-level clustering in a sensitivity analysis by adding a session-level random intercept or using cluster-robust standard errors when supported by the data. If the clustering model is singular or unstable because of a limited number of clusters, retain the participant-level model as the primary analysis and report the clustering analysis as sensitivity evidence.
- Use emmeans version 2.0.1 to estimate marginal means and the predefined contrasts. Compare the participatory music education group with the active-control and waitlist-control groups at T1 and T2.
- Use a two-sided α = 0.05 for the predefined primary contrasts. Report the estimated effects, 95% confidence intervals (CIs), p values, and Hedges’ g in Table 5.
- Report baseline balance p values in Tables 1 and 2. Report T1-to-T2 attenuation for each outcome and study group in Table 4. Report participant withdrawals, missing follow-up assessments, and any voluntarily provided reasons for withdrawal in Figure 1 or in a supplementary dropout table.
- Treat subgroup analyses as exploratory. Restrict the reported subgroup analyses to sex, previous music training, baseline recent 7-day major stressor status, and contamination status. Apply a false discovery rate correction within the subgroup-analysis family.
| Outcome | Time | Contrast | Estimated Marginal Mean Difference | 95% CI | P value | Hedges' g |
| PANAS positive affect | T1 | Participatory Music Education vs Active Control | 5.17 | 1.39 to 8.95 | 0.008 | 1.34 |
| Participatory Music Education vs Waitlist Control | 4.47 | 0.43 to 8.51 | 0.031 | 1.43 | ||
| PANAS negative affect | T1 | Participatory Music Education vs Active Control | −2.07 | −5.26 to 1.12 | 0.199 | −1.69 |
| Participatory Music Education vs Waitlist Control | −4.37 | −7.35 to −1.39 | 0.005 | −2.02 | ||
| Ten-item Perceived Stress Scale (PSS-10) | T1 | Participatory Music Education vs Active Control | −4.07 | −7.08 to −1.06 | 0.009 | −1.56 |
| Participatory Music Education vs Waitlist Control | −2.80 | −5.49 to −0.11 | 0.041 | −1.54 | ||
| Social Connectedness Scale–Revised (SCS-R) | T1 | Participatory Music Education vs Active Control | 8.8 | 2.51 to 15.09 | 0.007 | 1.15 |
| Participatory Music Education vs Waitlist Control | 9.3 | 2.71 to 15.89 | 0.007 | 1.74 | ||
| PANAS positive affect | T2 | Participatory Music Education vs Active Control | 5.93 | 1.67 to 10.19 | 0.007 | 1.07 |
| Participatory Music Education vs Waitlist Control | 6.1 | 1.64 to 10.56 | 0.008 | 1.26 | ||
| PANAS negative affect | T2 | Participatory Music Education vs Active Control | −2.06 | −5.38 to 1.26 | 0.219 | −1.20 |
| Participatory Music Education vs Waitlist Control | −3.46 | −6.64 to −0.28 | 0.033 | −1.22 | ||
| Ten-item Perceived Stress Scale (PSS-10) | T2 | Participatory Music Education vs Active Control | −4.77 | −8.36 to −1.18 | 0.01 | −1.07 |
| Participatory Music Education vs Waitlist Control | −4.43 | −7.43 to −1.43 | 0.005 | −1.49 | ||
| Social Connectedness Scale–Revised (SCS-R) | T2 | Participatory Music Education vs Active Control | 9.83 | 2.92 to 16.74 | 0.006 | 1.1 |
| Participatory Music Education vs Waitlist Control | 10.6 | 3.53 to 17.67 | 0.004 | 1.36 |
Table 5: Linear mixed-effects model results. Predefined comparisons of the participatory music education (PME) group with the active-control and waitlist-control groups at T1 and T2 based on linear mixed-effects models. Results include estimated marginal mean differences, 95% confidence intervals (CI), P values, and Hedges’ g.
Results
Participant Enrollment, Completion, and Baseline Characteristics at T0
Figure 1A illustrates participant flow from enrollment and eligibility screening through baseline assessment and random allocation. Figure 1B illustrates the assessment schedule across baseline (T0), the 6-week intervention period, the post-intervention assessment conducted within 48 h after Week 6 (T1), and the 4-week follow-up assessment (T2). Ninety students were randomized in a 1:1:1 ratio to PME (n = 30), active-control music appreciation (n = 30), or waitlist control (n = 30). Baseline demographic characteristics, previous music training, recent 7-day major stressor status, baseline music exposure, attendance, and protocol adherence are summarized in Table 1. Baseline outcome measures are summarized in Table 2. The participant-level dataset used to generate the tables and figures is provided in Supplementary Data File 1.
The three study groups were broadly comparable at baseline. Mean age was similar across groups (PME, 20.34 ± 1.50 years; active control, 20.45 ± 1.70 years; waitlist control, 20.48 ± 1.54 years). Female participants comprised 18/30 (60.0%) of the PME group, 19/30 (63.3%) of the active-control group, and 24/30 (80.0%) of the waitlist-control group. No or minimal previous music training was reported by 18/30 (60.0%), 18/30 (60.0%), and 20/30 (66.7%) participants, respectively (Table 1). Baseline outcome measures likewise showed no marked pre-intervention differences among the groups (Table 2). PANAS positive affect scores were 29.23 ± 6.13 in the PME group, 28.17 ± 5.75 in the active-control group, and 29.13 ± 6.58 in the waitlist-control group. PANAS negative affect scores were 22.33 ± 4.33, 20.00 ± 6.58, and 21.50 ± 5.12, respectively. Mean PSS-10 scores were 18.87 ± 5.02, 19.23 ± 5.13, and 17.87 ± 4.07, whereas SCS-R scores were 77.67 ± 11.40, 74.27 ± 11.47, and 77.53 ± 13.76, respectively.
Intervention Exposure, Fidelity, and Safety During Weeks 1–6
Figure 2 illustrates the standardized 90-min PME session structure, including the grounding warm-up, rhythm circle, designated pause point, improvisation, co-creation, and structured reflection components. Intervention exposure was high in both active study arms. Mean attendance was 0.87 ± 0.09 in the PME group and 0.84 ± 0.09 in the active-control group. Protocol adherence, defined as attendance at five or more of six sessions, was achieved by 25/30 (83.3%) participants in the PME group and 23/30 (76.7%) participants in the active-control group.
Table 3 summarizes the complete 6-week implementation, fidelity, deviation, corrective-action, and safety indicators. Fidelity remained consistently high throughout the intervention. PME fidelity scores ranged from 8.92 ± 0.58 to 9.33 ± 0.44, with a 6-week mean of 9.20 ± 0.49. Active-control fidelity scores ranged from 8.86 ± 0.61 to 9.09 ± 0.66, with a corresponding mean of 8.99 ± 0.56. The designated pause point was used in 2 of 6 PME sessions (33.3%), indicating selective implementation of the reset procedure rather than routine interruption of session delivery. Implementation deviations were infrequent. No PME session met the predefined low-fidelity threshold. One active-control session (1/6; 16.7%) was classified as low fidelity because of an active-control boundary violation. Facilitator-related deviations occurred once in the PME group and twice in the active-control group, whereas participant-related deviations occurred four and five times, respectively. Corrective actions were implemented once in the PME group and twice in the active-control group. Facilitator retraining was required once in the active-control group and was not required in the PME group. No adverse events related to study participation were recorded, and no participant discontinued because of a distress event. Brief discomfort that did not require discontinuation occurred in 1/30 (3.3%) participants in both the PME and active-control groups.
Post-Intervention and Follow-Up Outcomes at T1 and T2
Table 4 summarizes outcome scores at T1 and T2, change-from-baseline values (ΔT1 = T1 − T0 and ΔT2 = T2 − T0), and T1-to-T2 attenuation estimates (ΔT2 − ΔT1). Figure 3 illustrates the change-from-baseline results for PANAS positive affect (Figure 3A), PANAS negative affect (Figure 3B), PSS-10 (Figure 3C), and SCS-R (Figure 3D). At T1, the PME group demonstrated the largest improvements across all four outcome measures. PANAS positive affect increased, whereas PANAS negative affect and PSS-10 scores decreased to a greater extent than in either comparator group. SCS-R scores likewise increased more in the PME group than in the active-control or waitlist-control groups (Table 4; Figure 3). The favorable pattern was maintained at the 4-week follow-up (T2). The PME group continued to show larger improvements from baseline than either comparator group across all outcome measures, whereas the active-control group demonstrated smaller improvements and the waitlist-control group showed minimal or inconsistent change. The T1-to-T2 attenuation analysis indicated maintenance or continued improvement in the PME group. Positive affect, perceived stress, and social connectedness continued to change in the favorable direction, while reductions in negative affect were largely maintained. By comparison, attenuation estimates were smaller in the active-control group and showed little consistent improvement in the waitlist-control group (Table 4).
Model-Based Estimates
Table 5 summarizes the predefined linear mixed-effects model contrasts comparing the PME group with the active-control and waitlist-control groups at T1 and T2. The models included fixed effects for study group, assessment time, the group × time interaction, baseline recent 7-day major stressor status, and any meaningfully imbalanced baseline covariates, together with a participant-level random intercept. Estimated marginal mean differences, 95% CIs, P values, and Hedges’ g are presented in Table 5. The model-based results were consistent with the descriptive analyses. At both T1 and T2, the PME group demonstrated higher PANAS positive affect and SCS-R scores and lower PSS-10 scores than both comparator groups. For PANAS negative affect, the PME group differed significantly from the waitlist-control group at both time points, whereas the comparison with the active-control group was not statistically significant. Standardized effect sizes generally favored the PME group and remained in the same direction at both post-intervention assessments, supporting the consistency of the observed group differences across outcome measures. Sensitivity analyses incorporating multiple imputation for missing data and session-level clustering did not alter the direction of the predefined group × time contrasts. Exploratory subgroup analyses were interpreted after false discovery rate correction.
Supplementary materials accompanying this article include the PME facilitator scripts (Supplementary File 1), active-control music library and discussion guide (Supplementary File 2), online screening questionnaire (Supplementary File 3), randomization R script (Supplementary File 4), adverse event and distress response template (Supplementary File 5), Supplementary Figures 1–2, and Supplementary Data File 1 containing the participant-level dataset used to generate the tables and figures reported in this study.
Supplementary File 1. PME facilitator scripts. Facilitator scripts for all six participatory music education (PME) sessions, including session timing, facilitator prompts, transitions, guided reflection questions, pause-point wording, and intervention fidelity checkpoints.Please click here to download this file.
Supplementary File 2. Active-control music library and discussion guide. Weekly listening themes, curated music excerpts, note-taking instructions, structured discussion prompts, and prohibited active music-making activities for the active-control condition.Please click here to download this file.
Supplementary File 3. Online screening questionnaire. Online participant screening questionnaire including eligibility criteria, availability for study attendance, previous music training, exclusion criteria, and outside-session music activity screening.Please click here to download this file.
Supplementary File 4. Randomization R script. R script for sex-stratified 1:1:1 block randomization using a block size of 6 and a random seed of 20260302.Please click here to download this file.
Supplementary File 5. Adverse event and distress response template. Safety monitoring form documenting event severity, actions taken, referrals offered, participant return status, and assessment of study relatedness.Please click here to download this file.
Supplementary Table 1. Fidelity thresholds and deviation coding. Intervention fidelity thresholds, timing criteria, deviation codes, low-fidelity definitions, and corresponding corrective actions.Please click here to download this file.
Supplementary Table 2. Variable dictionary and scoring rules. Variable names, coding conventions, questionnaire scoring procedures, reverse-scoring rules, missing-data handling, and derived change-score variables.Please click here to download this file.
Supplementary Data File 1. De-identified participant-level dataset. Long-format, de-identified participant-level dataset used for all statistical analyses and to generate the tables and figures reported in this study.Please click here to download this file.
Discussion
Across the measured outcomes, the PME group showed a coherent pattern of short-term improvement relative to both comparator groups. The direction of change was maintained at the 4-week follow-up, and the T1-to-T2 attenuation estimates indicated continued improvement or maintenance for positive affect, perceived stress, and social connectedness, with negative affect remaining largely stable rather than returning toward baseline. This pattern supports the use of a standardized participatory music education protocol to produce measurable well-being-related outcomes in a university setting. However, these findings should be interpreted cautiously because they reflect the implementation of a controlled protocol rather than definitive evidence of long-term efficacy16.
The active-control condition is central to the interpretation of these findings. Music appreciation matched the PME intervention with respect to session duration, facilitator contact, group setting, weekly schedule, and music exposure while excluding instrument handling, synchronized performance, leadership rotation, improvisation, and co-creation. This design reduces the likelihood that the observed differences can be attributed solely to attention, group attendance, or passive music exposure17. Because participant blinding is inherently difficult in educational and behavioral interventions, maintaining comparator integrity, standardized intervention scripts, and transparent reporting is essential to avoid overstating causal inferences18.
The proposed intervention pathway is reflected in the structured design of each PME session. The rhythm circle establishes a shared pulse, joint attention, and coordinated action; rotating leadership promotes agency and peer responsiveness; improvisation requires continuous adaptation to other participants; co-creation transforms individual contributions into a collective musical product; and structured reflection encourages participants to identify and reflect on affective and social experiences arising from the activity. Together, these components provide a plausible mechanism through which coordinated musical engagement may enhance social bonding and affective regulation, consistent with evidence linking interpersonal synchrony and shared group activities with affiliation and prosocial behavior19. Previous studies of group music-making similarly suggest that active musical participation can influence social and well-being-related outcomes beyond those associated with passive listening alone20. Because the present protocol was not designed to isolate the effects of individual intervention components, future studies should evaluate rhythm, improvisation, co-creation, and structured reflection using dismantling, dose-response, or factorial study designs.
Implementation fidelity represents a core component of the protocol rather than a secondary administrative procedure. The revised delivery system documents block timing, pause-point use, low-fidelity sessions, facilitator-related deviations, participant-related deviations, active-control boundary violations, corrective actions, and facilitator retraining. This comprehensive monitoring framework makes it possible to distinguish diminished intervention effects from poor attendance, delivery drift, comparator contamination, or inconsistent facilitation. Such documentation is particularly important for complex behavioral interventions, in which reproducibility depends not only on describing the intended intervention but also on documenting how it was delivered in practice21. Although the representative dataset demonstrated only a small number of fidelity deviations, the standardized fidelity audit itself represents an important methodological contribution for future replication studies.
The analytical framework was selected to match the repeated-measures, group-based design of the protocol. Linear mixed-effects models account for within-participant correlation across T0, T1, and T2, while adjustment for recent 7-day stressor status and any meaningfully imbalanced baseline covariates helps reduce residual confounding. Multiple-imputation sensitivity analyses address missing follow-up data, recognizing that complete-case analyses may introduce bias when missingness is not negligible22. Session-level clustering assessments further acknowledge that participants attending the same intervention session may share unmeasured influences. Future multicenter studies should therefore consider incorporating both session-level and facilitator-level clustering into the study design and statistical analysis, particularly when implementing the protocol across multiple classrooms, campuses, or facilitators23.
Several limitations should be acknowledged. All outcomes were based on self-reported measures; therefore, demand characteristics, social desirability, and participant expectancy may have influenced responses despite the inclusion of an active comparator24. The follow-up period was limited to 4 weeks and therefore does not establish the durability of intervention effects across an academic semester or year. In addition, physiological and behavioral outcomes, including cortisol, heart-rate variability, sleep, academic engagement, academic performance, and help-seeking behavior, were not assessed, limiting interpretation of whether self-reported improvements correspond to broader functional or biological changes25. The large Hedges’ g values observed in this representative dataset should be interpreted as protocol-derived estimates rather than stable population effect sizes until replicated in larger and more diverse samples. Overall, this standardized protocol provides a practical, reproducible framework for investigating campus-based participatory music education. Future studies should preserve active-control integrity, rigorous fidelity monitoring, standardized safety procedures, longer follow-up periods, multi-facilitator implementation, and multi-site replication to strengthen the evidence base for participatory music education as a scalable university well-being intervention26.
Disclosures
The authors declare no competing financial interests or personal relationships that could have appeared to influence the work reported in this protocol.
Acknowledgements
We thank all student participants for their time and engagement. We also thank the facilitators and research assistants who supported session delivery, participant coordination, and data collection.
Materials
| Name | Company | Catalog Number | Comments |
|---|---|---|---|
| Active-control music appreciation guide | Study team | Supplementary File 2 / AC-GUIDE-v1.0 | Standardized active-control guide specifying weekly listening themes, music excerpt categories, listening duration, structured discussion prompts, prohibited activities, boundary wording, and playlist audit requirements. |
| Adverse event log | Study team | Supplementary File 5 / AE-LOG-v1.0 | Standardized safety form for recording participant code, event date, study arm, session or assessment point, activity block, event level, action taken, referral offered, return status, study relatedness, and principal investigator review. |
| Attendance sheet | Study team | ATT-SHEET-v1.0 | Session attendance form used to record attendance status, including on-time arrival, late arrival, incomplete attendance, absence, early departure, and protocol adherence. |
| Chair | Institution-provided | Not applicable | Movable classroom or rehearsal-room chair arranged in a closed circle for 10–15 participants. Use the same seating layout across participatory music education and active-control sessions. |
| Claves | NINO Percussion / MEINL | NINO502 | Small Siam oak wood claves used for pulse, call-and-response practice, and simple rhythm activities. Equivalent instruments may be used if they are hand-held wooden claves or rhythm sticks approximately 18–25 cm long and produce a moderate classroom sound level. |
| Computer | Institution-provided | Institutional asset number or equivalent | Password-protected computer used for allocation sequence generation, music playback, data entry, de-identified data storage, R analysis, table generation, and file archiving. Record the institutional asset number if required by institutional policy. |
| Consent form | Study team | CONSENT-v1.0 | Ethics-approved written informed consent form covering study purpose, random assignment, voluntary participation, withdrawal without academic penalty, confidentiality, data storage, de-identification, and campus support referral information. |
| Curated music library | Study team / public-domain, institutionally licensed, or copyright-cleared source | AC-PLAYLIST-v1.0 | Recorded music excerpts for the active-control group. Each excerpt is documented by week number, excerpt ID, source type, source record, duration, listening category, reason for inclusion, substitution status, and playlist audit status. |
| Data storage system | Institution-provided | Institutional secure storage system | Secure, access-controlled institutional storage for de-identified screening data, outcome data, scored datasets, fidelity logs, safety logs, analysis scripts, figure-source data, and statistical outputs. |
| Electronic survey platform | REDCap Consortium or institutional electronic survey platform | REDCap web application or institutional equivalent | Secure electronic survey and database platform used for online screening, questionnaire administration, follow-up assessment, and data export. If REDCap is not available, replace with the institutional platform used. |
| Encrypted storage system | Institution-provided | Institutional encrypted drive or encrypted folder system | Encrypted storage location for the participant code-to-contact key, consent records, and other identifiable information. Store separately from de-identified research data. |
| Participant identification code sheet | Study team | PID-SHEET-v1.0 | Participant code allocation sheet stored separately from de-identified datasets. Contains participant codes and contact-key linkage only when permitted by the approved protocol. |
| Participant tracking sheet | Study team | TRACK-SHEET-v1.0 | Tracking sheet for eligibility, consent, allocation, attendance, outside-session activity log completion, baseline assessment, post-intervention assessment, follow-up assessment, withdrawal status, and voluntarily provided withdrawal reason. |
| Participatory music education facilitator script | Study team | Supplementary File 1 / PME-SCRIPT-v1.0 | Standardized six-session facilitator script specifying timing, activity blocks, transition wording, verbal prompts, rhythm-circle procedures, same-room subgroup improvisation, co-creation prompts, reflection questions, pause-point wording, and fidelity checkpoints. |
| Playlist audit log | Study team | AC-PLAYLIST-LOG-v1.0 | Log documenting active-control music excerpts, including week number, excerpt ID, listening category, source type, source record, duration, vocal content, listening feature, reason for inclusion, use status, substitution status, and substitution reason. |
| Portable classroom speaker | JBL / Harman International | JBL Flip 6 (JBLFLIP6BLKAM) or regional equivalent | Portable Bluetooth speaker used for standardized music playback during active-control sessions. Use one speaker at a consistent classroom volume and record the volume setting and any substitutions in the playlist audit log. |
| Positive and Negative Affect Schedule | Original scale source: Watson, Clark, and Tellegen; permitted study copy prepared by the study team | PANAS (20-item scale); J Pers Soc Psychol. 1988;54(6):1063–1070 | Outcome questionnaire measuring positive and negative affect. Each subscale contains 10 items scored from 1 to 5, yielding subscale scores ranging from 10 to 50. Score according to Supplementary Table 2. |
| Printed questionnaires (optional) | Study team | PRINT-Q-v1.0 | Paper versions of the screening questionnaire, PANAS, PSS-10, Social Connectedness Scale–Revised, weekly outside-session music activity log, and follow-up forms for use when electronic administration is unavailable. Use participant codes only. |
| R | R Foundation for Statistical Computing | Version 4.5.2 | Statistical software used for allocation sequence generation, variable scoring, missing-data processing, mixed-effects modelling, estimated marginal means, session-level clustering sensitivity analysis, multiple imputation, Hedges' g calculation, figure-source data generation, and table generation. |
| Randomization R script | Study team | Supplementary File 4 / RAND-R-v1.0 | Archived R script implementing 1:1:1 block randomization with sex stratification, fixed block size of 6, random seed 20260302, masked group labels, allocation quality checks, restricted allocation-key output, and session information output. |
| Rehearsal room or classroom | Institution-provided | Not applicable | Quiet classroom, rehearsal room, or multipurpose activity space accommodating 10–15 participants for standardized 90-min sessions, with adequate ventilation, stable lighting, minimal external noise, and no scheduled interruptions. |
| Screening questionnaire | Study team | Supplementary File 3 / SCREEN-v1.0 | Standardized screening questionnaire covering age, full-time enrollment, attendance feasibility, consent readiness, music background, current organized group music-making, hearing-related participation limitations, group-participation safety, psychiatric medication stability, recent stressor status, and scheduling availability. |
| Shaker | NINO Percussion / MEINL | NINOSET540-2 | Egg shaker assortment (4 pieces) used for pulse, texture, and subgroup improvisation. Equivalent instruments may be used if they are hand-held shakers approximately 15–25 cm long, safe for repeated group use, and suitable for moderate classroom sound levels. |
| Social Connectedness Scale–Revised | Original scale source: Lee, Draper, and Lee; permitted study copy prepared by the study team | SCS-R (20-item scale); J Couns Psychol. 2001;48(3):310–318 | Outcome questionnaire measuring perceived social connectedness. The scale contains 20 items, with total scores typically ranging from 20 to 120 after reverse scoring according to the original scoring rules. Higher scores indicate greater social connectedness. Score according to Supplementary Table 2. |
| Statistical analysis scripts | Study team | ANALYSIS-R-v1.0 | Archived R scripts for variable scoring, range checks, missing-data processing, mixed-effects modelling, session-level clustering sensitivity analysis, multiple imputation, estimated marginal means, Hedges' g calculation, and table generation. |
| Supplementary Table 1 | Study team | SUPP-TABLE-1-v1.0 | Fidelity thresholds and deviation-coding table used to classify timing deviations, missed components, late attendance, early departure, participant refusal, facilitator-related deviations, participant-related deviations, active-control boundary violations, contamination events, safety events, and corrective actions. |
| Supplementary Table 2 | Study team | SUPP-TABLE-2-v1.0 | Variable dictionary and scoring rules for participant descriptors, attendance, adherence, contamination, adverse-event coding, PANAS scores, PSS-10 total score, Social Connectedness Scale–Revised total score, change scores, missingness indicators, imputation flags, and analysis inclusion. |
| Ten-item Perceived Stress Scale | Original scale source: Cohen, Kamarck, and Mermelstein; permitted study copy prepared by the study team | PSS-10; J Health Soc Behav. 1983;24(4):385–396 | Outcome questionnaire measuring perceived stress. The PSS-10 contains 10 items scored from 0 to 4. Items 4, 5, 7, and 8 are reverse scored before summation, yielding total scores ranging from 0 to 40. Score according to Supplementary Table 2. |
| Weekly outside-session music activity log | Study team | MUSIC-LOG-v1.0 | Weekly log used to record personal music listening, informal singing or instrument use, organized group music-making, new music-related course or club participation, and potential contamination during the intervention and follow-up periods. |
References
- Khatri P, et al. Student well-being in higher education: Scale development and validation with implications for management education. Int J Manag Educ. 2024;22:100933.
- Ahmed I, et al. A systematic review and meta-analysis of studies exploring the prevalence of non-specific anxiety in undergraduate university students. BMC Psychiatry. 2023;23:240.
- Perkins R, et al. How participatory music engagement supports mental well-being: A meta-ethnography. Qual Health Res. 2020;30:1924–1940.
- Tarr B, Launay J, Dunbar RIM. Music and social bonding: Self-other merging and neurohormonal mechanisms. Front Psychol. 2014;5:1096.
- Fancourt D, et al. Effects of group drumming interventions on anxiety, depression, social resilience, and inflammatory immune response among mental health service users. PLoS One. 2016;11:e0151136.
- He Q, et al. Evaluating music education interventions for mental health in Chinese university students: A dual fuzzy analytic method. Sci Rep. 2024;14:19727.
- Liu G, Hu J, Kostikova I. Music therapy and its impact on anxiety and mental well-being of Chinese students: An experimental comparison of traditional and VR approaches. Acta Psychol (Amst). 2025;255:104898.
- Yao X, et al. Research on the intervention effect of Five-Element Music combined with Eight-Section Brocade on depression among medical students in higher vocational colleges. Front Psychol. 2024;15:1439713.
- Song L, et al. Effect of group impromptu music therapy on improving test anxiety and emotional regulation ability in medical students. Front Psychol. 2024;15:1467830.
- Rodwin AH, et al. A systematic review of music-based interventions to improve treatment engagement and mental health outcomes for adolescents and young adults. Child Adolesc Soc Work J. 2023;40:537–566.
- Freedland KE, Mohr DC, Davidson KW, Schwartz JE. Usual and unusual care: Existing practice control groups in randomized controlled trials of behavioral interventions. Psychosom Med. 2011;73:323–335.
- Gómez-Gallego M, Gómez-Gallego JC, Gallego-Mellado M, García-García J. Comparative efficacy of active group music intervention versus group music listening in Alzheimer’s disease. Int J Environ Res Public Health. 2021;18:8067.
- Watson D, Clark LA, Tellegen A. Development and validation of brief measures of positive and negative affect: The PANAS scales. J Pers Soc Psychol. 1988;54:1063–1070.
- Cohen S, Kamarck T, Mermelstein R. A global measure of perceived stress. J Health Soc Behav. 1983;24:385–396.
- Lee RM, Draper M, Lee S. Social connectedness, dysfunctional interpersonal behaviors, and psychological distress: Testing a mediator model. J Couns Psychol. 2001;48:310–318.
- Gee KA, Hawes V, Cox NA. Blue Notes: Using songwriting to improve student mental health and wellbeing: A pilot randomized controlled trial. Front Psychol. 2019;10:423.
- Gold SM, et al. Control conditions for randomized trials of behavioural interventions in psychiatry: A decision framework. Lancet Psychiatry. 2017;4:725–732.
- Boutron I, et al. Extending the CONSORT statement to randomized trials of nonpharmacologic treatment: Explanation and elaboration. Ann Intern Med. 2008;148:295–309.
- Hove MJ, Risen JL. It’s all in the timing: Interpersonal synchrony increases affiliation. Soc Cogn. 2009;27:949–960.
- Pearce E, Launay J, Dunbar RIM. The ice-breaker effect: Singing mediates fast social bonding. R Soc Open Sci. 2015;2:150221.
- Hoffmann TC, et al. Better reporting of interventions: Template for Intervention Description and Replication (TIDieR) checklist and guide. BMJ. 2014;348:g1687.
- Little RJ, et al. The prevention and treatment of missing data in clinical trials. N Engl J Med. 2012;367:1355–1360.
- Roberts C, Roberts SA. Design and analysis of clinical trials with clustering effects due to treatment. Clin Trials. 2005;2:152–162.
- Podsakoff PM, MacKenzie SB, Lee JY, Podsakoff NP. Common method biases in behavioral research: A critical review of the literature and recommended remedies. J Appl Psychol. 2003;88:879–903.
- Thoma MV, et al. The effect of music on the human stress response. PLoS One. 2013;8:e70156.
- Proctor E, et al. Outcomes for implementation research: Conceptual distinctions, measurement challenges, and research agenda. Adm Policy Ment Health. 2011;38:65–76.