This systematic review evaluated the validity and reliability of inertial measurement units (IMUs) for assessing pelvic orientation. IMUs showed the strongest validity in controlled tasks, particularly with sacrum-based placement, but performance was more variable for pelvic obliquity and rotation, during high-speed movements, and in clinical populations.
Research Article
Validity And Reliability Of Inertial Measurement Units For Pelvic Orientation Assessment: A Systematic Review
In This Article
Summary
Abstract
Pelvic orientation assessment is fundamental for gait, posture, and sport biomechanics; however, using laboratory-based motion-capture systems is costly and restricted to controlled environments. Inertial measurement units (IMUs) offer a portable alternative to traditional laboratories but differ in placement, calibration, and sensor-fusion settings/protocols, which could complicate interpretation in clinical practice. Therefore, this systematic review examined the validity and reliability of IMU-based pelvic orientation during functional and sport-specific tasks. PubMed, Web of Science, and IEEE Xplore were searched for relevant studies that assessed pelvic orientation (e.g., tilt, obliquity, or rotation) using IMUs, and the findings were reported using PRISMA guidelines. Eligible studies included those reporting data from human participants and reporting either the validity or reliability of IMUs against optical motion-capture systems. Twelve studies met the inclusion criteria and were checked using a 12-item methodological quality tool. Our IMU validity findings varied across the included studies; pelvic tilt demonstrated the highest accuracy, with root-mean-square error (RMSE) values typically between 0.2° and 4.9° and minimal mean differences in recent studies. Obliquity and rotation showed greater variability, with RMSE values reaching 6°–11° during high-speed running. Our IMU reliability findings indicated good-to-excellent repeatability even during continuous functional activity (intraclass correlation coefficient (ICC) 0.87–1.00). Conversely, reliability was poor for pelvic tilt in individuals following total hip arthroplasty (ICC = 0.08). IMUs appear to provide useful pelvic orientation measurements, particularly in controlled tasks and when sacrum-based placement is used. However, validity is more variable for pelvic obliquity and rotation, during high-speed or complex movements, and in clinical populations. Further research is required to standardize protocols, improve reporting, and clarify performance across different applications.
Introduction
Accurate assessment of pelvic orientation is essential for understanding human movement patterns to make accurate clinical decisions and identify subtle conditions that could affect healthy and athletic individuals with musculoskeletal disorders1. Pelvic orientation is commonly described using three components: tilt, rotation, and obliquity2. Abnormal pelvic orientation influences joint loading and muscle and movement efficiency and has been associated with musculoskeletal disorders such as low back pain and hip osteoarthritis3,4,5,6,7. In sports populations, this has also been linked to performance limitations and increased injury risk8. Consequently, clinically accessible methods for measuring pelvic orientation are essential for evaluation, rehabilitation monitoring, and sports-performance research2,6.
Optical motion-capture systems are widely used as laboratory-based reference methods for quantifying pelvic orientation; however, their use is often restricted to controlled environments and may be less practical in routine clinical or sport settings9,10. Inertial measurement units (IMUs), which typically include tri-axial accelerometers, gyroscopes, and magnetometers, have increasingly been used as a portable approach for pelvic orientation assessment outside laboratory11,12,13,14,15,16. IMU sensor-fusion algorithms (e.g., Madgwick, Mahony, and Kalman filters) are used to estimate three-dimensional pelvic orientation, although differences in processing methods may influence measurement performance across17,18.
However, using IMUs to evaluate pelvic orientation is affected by multiple methodological factors reported in previous studies, including the sensor placement (e.g., sacrum, and lumbar vertebra), calibration procedure, sampling frequency, and fusion algorithm19. These variations across studies may contribute to inconsistent findings regarding the accuracy and repeatability of IMU-based pelvic orientation assessment14,20,21. While IMUs have been validated for lower limb kinematics and lumbar spine motion14,21,22, evidence focusing specifically on pelvic tilt, rotation, or obliquity remains limited and methodologically inconsistent.
Therefore, this systematic review aimed to evaluate the available evidence on IMU-based assessment of pelvic orientation. The primary aim was to examine the validity and reliability of IMUs for measuring pelvic orientation. A secondary aim was to summarize the methodological characteristics reported across studies, including sensor placement, calibration procedures, and sensor-fusion approaches, and to identify evidence gaps that limit direct comparison across studies.
Protocol
This systematic review was conducted following the Preferred Reporting Items for Systematic Reviews and Meta-Analyses (PRISMA 2020) guidelines23. The systematic review protocol was registered in the International Prospective Register of Systematic Reviews (PROSPERO) under the registration number CRD420251179585. Full protocol details are available at:
(https://www.crd.york.ac.uk/PROSPERO/view/CRD420251179585)
Search strategy
PubMed, Web of Science, and IEEE Xplore were searched on 1st of November 2025, to identify original research articles assessing pelvic orientation using IMUs among humans. The included articles were restricted to English-language publications, and searches were date-limited to 2005–2025. The search date restriction was due to the fast growth of IMU technology in recent years and ensured that only modern measurement methods were included. No supplementary search methods, such as reference-list screening, citation tracking, or manual searching, were performed. Table 1 presents the search details and search strings used for each database.
| Database | ||||
| PubMed | (inertial measurement unit*[Title/Abstract] OR IMU*[Title/Abstract] OR acceleromet*[Title/Abstract] OR gyroscop*[Title/Abstract] OR wearable*[Title/Abstract]) AND (pelvis[Title/Abstract] OR pelvic[Title/Abstract] OR "pelvic tilt"[Title/Abstract] OR "pelvic rotation"[Title/Abstract] OR "pelvic obliquity"[Title/Abstract] OR "pelvic orientation"[Title/Abstract] OR "anterior pelvic tilt"[Title/Abstract] OR "posterior pelvic tilt"[Title/Abstract]) AND( valid*[Title/Abstract] OR accurac*[Title/Abstract] OR agreement[Title/Abstract] OR "Bland-Altman"[Title/Abstract] OR reliab*[Title/Abstract] OR repeatab*[Title/Abstract] OR reproduc*[Title/Abstract] OR ICC[Title/Abstract] OR SEM[Title/Abstract] OR MDC[Title/Abstract]) | |||
| Web of Science | ("inertial measurement unit*" OR IMU* OR acceleromet* OR gyroscop* OR wearable*) AND (pelvis OR pelvic OR "pelvic tilt" OR "pelvic rotation" OR "pelvic obliquity" OR "pelvic orientation" OR "anterior pelvic tilt" OR "posterior pelvic tilt") AND (valid* OR accurac* OR agreement OR "Bland-Altman" OR reliab* OR repeatab* OR reproduc* OR ICC OR SEM OR MDC) | |||
| IEEE Xplore | (("inertial measurement unit" OR "inertial measurement units" OR IMU OR IMUs OR accelerometer OR accelerometers OR gyroscope OR gyroscopes OR wearable) AND ("pelvis" OR "pelvic" OR "pelvic tilt" OR "pelvic rotation" OR "pelvic obliquity" OR "pelvic orientation" OR "anterior pelvic tilt" OR "posterior pelvic tilt") AND (validity OR validation OR accuracy OR agreement OR "Bland-Altman" OR reliability OR repeatability OR reproducibility OR ICC OR SEM OR MDC)) | |||
Table 1: Search strings utilized for each database. Search strings used in PubMed, Web of Science, and IEEE Xplore to identify studies evaluating the validity and/or reliability of inertial measurement units (IMUs) for pelvic orientation assessment. Please click here to download this Table.
Eligibility criteria
Studies were eligible if they involved human participants; used IMUs to measure pelvic tilt, rotation, or obliquity; and reported data on either the validity or reliability of IMUs compared to optical motion capture. The included studies were original experimental research reporting quantitative validity (e.g., RMSE, bias, correlation, Bland–Altman) and reliability metrics (ICC, standard error of measurement [SEM], and minimal detectable change [MDC]). Studies were excluded if they involved animals, simulations, or focused on non-pelvic segments assessment, or if they lacked a comparator measure (reporting only descriptive outcomes) or were non-original research such as reviews, protocols, abstracts, or case reports.
Study screening and selection
The author, with assistance from two acknowledged non-author assessors, screened titles and abstracts for relevance, conducted full-text reviews to determine final inclusion, and summarized the articles in a PRISMA 2020 flow diagram. All retrieved records were checked for duplication, and duplicate records were removed.
Data extraction
Extracted data included bibliographic details (author, year), participant characteristics, IMUs (placement, brand, model, number of sensors, sampling rate, sensor fusion/orientation algorithm), test tasks (standing, walking, squatting, running), and reported outcomes (RMSE, bias, correlation, ICC, SEM, MDC). The extracted data were cross-checked twice using a standardized Excel spreadsheet.
Risk of bias and quality assessment
Methodological quality of the included studies was evaluated using the Critical Appraisal of Study Design for Psychometric Articles24, which has previously been used for studies examining the psychometric properties of wearable sensors14. This quality assessment included 12 items with a possible maximum total score of 24, which was converted to a percentage. Each item was scored as 2 (satisfactory), 1 (partially satisfactory), or 0 (unsatisfactory) across five categories: study question, study design, measurements, analyses, and recommendations. To improve consistency, this quality assessment was performed by two non-author assessors acknowledged in the manuscript, and any differences were resolved through discussion. Studies were classified according to their total quality score as follows: high quality, 85–100%; moderate quality, 70–84%; low quality, 50–69%; or very low quality, <50%. The full 12-item tool and scoring criteria are provided in Supplemental Table S1.
Data synthesis
The findings were synthesized narratively by grouping studies according to validity and reliability outcomes, pelvic motion plane, task type, and key methodological characteristics. Methodological quality was considered during interpretation of the findings; no studies were excluded based on quality score alone, but lower-quality studies were interpreted with greater caution.
Results
Study selection
The initial database search identified 714 potential studies (PubMed = 190, Web of Science = 482, and IEEE Xplore = 42). After duplicate removal and title–abstract screening, 63 full-text articles were evaluated for eligibility, and 12 studies met the inclusion and exclusion criteria and were included in this systematic review (Figure 1).
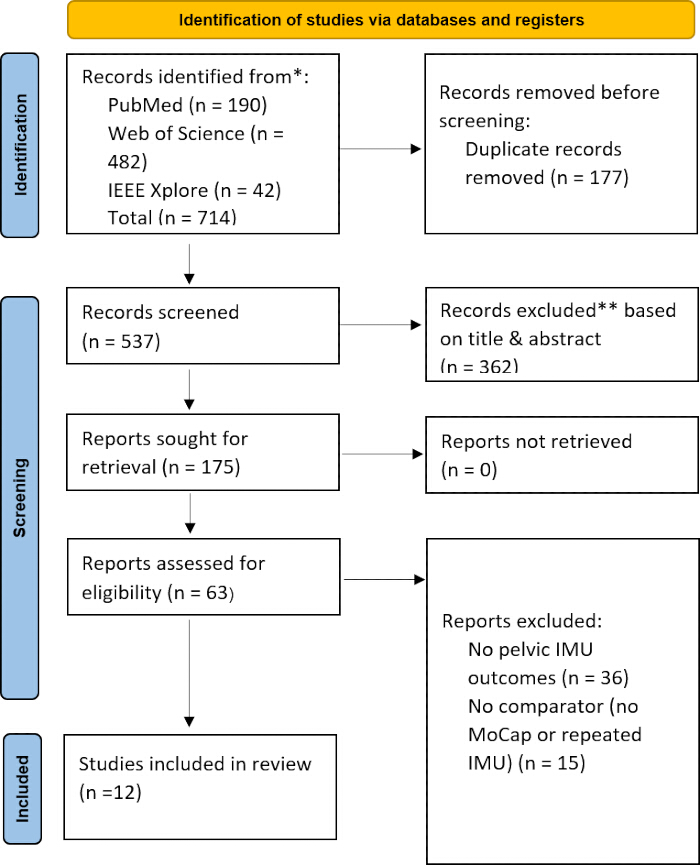
Figure 1: PRISMA 2020 flow diagram of study selection. Flow diagram showing the process of study identification, screening, eligibility assessment, and final inclusion in this systematic review, in accordance with PRISMA 2020. Please click here to view a larger version of this figure.
Quality of the included studies
All included studies were peer-reviewed experimental research articles published between 2014 and 2025. Based on the methodological quality assessment, three studies were rated as high quality (85–100%)22,25,26, 7 as moderate quality (70%–84%) and 2 as low quality (50%–69%). The high-quality studies demonstrated methodological strengths including the use of reference systems (e.g., Vicon, Optotrak, Qualisys) for validation, clear reporting of outcomes, and appropriate statistical analyses (e.g., RMSE, ICC, Bland–Altman). Typical limitations across the included studies were small sample sizes and incomplete descriptions of IMU–segment calibration (Table 2).
| Author | Q1 | Q2 | Q3 | Q4 | Q5 | Q6 | Q7 | Q8 | Q9 | Q10 | Q11 | Q12 | Total | % | Quality |
| Buganè et al. 30 | 2 | 0 | 1 | 2 | 0 | N/A | 1 | 2 | 2 | 2 | 2 | 1 | 15 | 68% | LQ |
| Bolink et al. 22 | 2 | 2 | 1 | 2 | 1 | N/A | 2 | 2 | 2 | 2 | 1 | 2 | 19 | 86% | HQ |
| Ekdahl et al. 31 | 2 | 1 | 1 | 2 | 0 | N/A | 2 | 2 | 2 | 0 | 1 | 1 | 14 | 64% | LQ |
| Perpiñá-Martínez et al. 32 | 2 | 2 | 1 | 2 | 1 | N/A | 1 | 2 | 2 | 1 | 1 | 1 | 16 | 73% | MQ |
| Lebleu et al. 35 | 2 | 1 | 1 | 2 | 0 | N/A | 1 | 2 | 2 | 2 | 2 | 1 | 16 | 73% | MQ |
| Lin et al. 25 | 2 | 2 | 2 | 2 | 1 | N/A | 2 | 2 | 2 | 2 | 2 | 1 | 20 | 90% | HQ |
| Brice et al. 29 | 2 | 0 | 1 | 2 | 2 | N/A | 2 | 2 | 2 | 2 | 2 | 1 | 18 | 82% | MQ |
| Asgari & Heller 27 | 2 | 1 | 1 | 2 | 0 | N/A | 2 | 2 | 2 | 2 | 2 | 1 | 17 | 77% | MQ |
| Bessone et al. 28 | 2 | 1 | 2 | 2 | 0 | N/A | 2 | 2 | 2 | 2 | 1 | 1 | 17 | 77% | MQ |
| Kim et al. 26 | 2 | 1 | 2 | 2 | 2 | N/A | 2 | 2 | 2 | 2 | 1 | 1 | 19 | 86% | HQ |
| Ruiz-Malagón et al.33 | 2 | 2 | 1 | 2 | 0 | N/A | 1 | 2 | 2 | 2 | 2 | 1 | 17 | 77% | MQ |
| Zügner et al.34 | 2 | 2 | 2 | 2 | 0 | N/A | 1 | 2 | 2 | 2 | 2 | 1 | 18 | 82% | MQ |
Table 2: Methodological quality assessment of the 12 included studies. Methodological quality scores of the included studies based on the modified 12-item Critical Appraisal of Study Design for Psychometric Articles used in this review. Each item was scored as 2 = satisfactory, 1 = partially satisfactory, or 0 = unsatisfactory. Q1–Q12 correspond to the modified methodological quality items listed in Supplemental Table S1. Abbreviations: HQ = high quality; MQ = moderate quality; LQ = low quality; N/A = not applicable. Please click here to download this Table.
Characteristics of the included studies
Participants
The 12 included studies had a total of 232 participants aged 18–80. Most of these studies evaluated healthy, recreational, or competitive runners and golfers, whereas only two studies included clinical populations, specifically individuals following total hip arthroplasty (THA) and individuals with knee or hip osteoarthritis.
IMU system, placement, and sensor-fusion algorithms
Most included studies collected pelvic data using IMUs placed over the sacrum, making sacrum-based placement the most commonly reported approach across studies25,27,28,29,30,31,32,33,34. Commercial systems included Xsens, Delsys, MicroStrain, BTS G-Sensor, IMeasureU, APDM-Opal, aktos-t, RunScribe, and TuringSense. Table 3 provides a complete summary of the IMU placement, system, and number for each study.
| Study | NO of participants | Task | IMU system | Sensor Placement | No. of IMUs | Sampling Rate | Filtering Methods | Sensor-Fusion / Orientation Algorithm |
| Buganè et al.30 | 16 healthy | Walking | F4A IMU | Sacrum | 1 | 100 Hz | fourth-order Butterworth low-pass filter with a cutoff frequency of 8 Hz | using the function ‘detrend’ in Matlab |
| Bolink et al.22 | 17 patients with hip or knee OA | Walking, sit-to-stand and block step-up | MicroStrain Inertia-Link | Lower back (between PSIS) | 1 | 100 Hz | N/R | algorithms in MATLAB |
| Lebleu et al.35 | 7 healthy | Walking | x-IMU x-io Technologies | Pelvis (Lumbar 5), thighs, shanks, feet | 7 | 128 Hz | N/R | Mahony’s AHRS algorithm |
| Perpiñá-Martínez et al.32 | 29 runners | Running | BTS G-Sensor | S1 (sacrum) | 1 | 100 Hz | N/R | N/R |
| Ekdahl et al.31 | 11 healthy | Walking and sport activities | Delsys Trigno Avanti | Sacrum, thighs, shanks, feet | 7 | 240 Hz | Low-pass fourth- order Butterworth filter (5 Hz) | N/R |
| Brice et al.29 | 8 elite female rowers | Rowing | IMeasureU IMUs v2.0 | T1, T7, L2, second sacral S2 | 4 | 500 Hz | N/R | Kalman filter |
| Lin et al.25 | 20 runners | Running | Xsens MVN Awinda | Sacrum, thighs, shanks, feet | 7 | 100 Hz | fourth-order, zero-lag, low-pass Butterworth filter with a cutoff frequency of 8 Hz | built-in algorithm provided by Xsens MVN Analyze |
| Asgari & Heller.27 | 6 runners | Running | APDM Opal | Sacrum | 1 | 128 Hz | high-pass and low-pass filters | Kalman filter vs complementary fusion |
| Bessone et al.28 | 14 healthy | Walking | aktos-t IMU system | Pelvis, feet, shanks, thighs, C7 vertebra, chest, forearms, upper arms, hands and head | 16 | 143 Hz | Low-pass filtered (10 Hz, 2nd order Butterworth filter | Custom fusion (The algorithm of iSen 3.08) |
| Kim et al.26 | 36 golfers | Golf swing | TuringSense Pivot | L4 and T1 (pelvis from L4) | 2 | 100 Hz | Butterworth filter with a cutoff frequency of 12 Hz | Madgwick filter |
| Ruiz-Malagón et al.33 | 16 healthy | Walking and running | RunScribe Sacral Gait Lab | Sacrum and feet | 3 | 500 Hz | N/R | N/R |
| Zügner et al.34 | 49 patients with THA | Walking | GaitSmart™ | 2 at the Pelvis (under iliac crest), thighs and shanks | 6 | 102.4 Hz | N/R | N/R |
Table 3: Characteristics of IMU systems, sensor placement, sampling rate, filtering methods, and sensor-fusion approaches across the included studies. Summary of the main study characteristics, including participant population, movement task, IMU system, sensor placement, number of sensors, sampling rate, and reference system where reported. Abbreviations: IMU= inertial measurement unit; OA = osteoarthritis; PSIS = posterior superior iliac spines; THA = total hip arthroplasty; N/R = not reported. Please click here to download this Table.
The analysis of filtering and sensor-fusion performance across the included studies was limited by methodological variation and incomplete reporting. Only four studies described their fusion methods clearly; two used Kalman27,29, one used the Madgwick algorithm26, and one applied Mahony’s AHRS algorithm35. Due to insufficient methodological detail, direct comparison of fusion algorithms or their independent contributions to accuracy was not possible. This variability complicated the determination of whether differences in pelvic orientation accuracy stemmed from task demands, sensor placement, or the underlying fusion strategy.
Validity of IMUs for pelvic orientation assessment
Across the included studies evaluating IMUs for pelvic tilt, obliquity, and rotation22,25,26,27,28,29,30,31,33,34,35, validity appeared to be plane- and task-specific rather than uniform across all conditions when compared with optical motion-capture systems (Table 4). The included studies examined a range of movement tasks, including walking22,28,30,31,33,34,35, running25,27,32,33, and sport-specific actions26,29,31, providing a broad overview of IMU performance across functional contexts.
Reported RMSE values ranged from 0.69° to 4.90° for pelvic tilt22,25,27,28,30,33,35 and from 0.77° to 4.75° for pelvic obliquity22,25,27,28,33,35. Pelvic rotation showed the highest variability, with RMSE values ranging from 1.22° to 7.77° during high-speed running and other demanding movements25,27,28,30,33,35.
Bias values for pelvic orientation were reported in eight studies as the mean systematic difference between IMU-measured values and optical motion capture (OMC)25,26,27,28,29,30,33,34. Buganè et al.30 reported relatively large negative bias values of pelvic tilt (−9.9° to −5.7°), smaller obliquity biases (−1.2° to −1.4°), and slight overestimation of pelvic rotation (+0.7° to +1.5°). Brice et al.29 reported small sagittal pelvic biases S2 level ranging from −2.7 to −0.09° during rowing. Asgari and Heller27 observed minimal biases across all pelvic planes (−0.50° to −0.10°), and Bessone et al.28 reported similarly low biases (−0.7° to −1.7°). Lin et al.25 also reported small pelvic tilts biases (−0.18° to +1.5°) and rotation biases (−1.1° to +0.99°) across running speeds, although in the same study IMUs underestimated the pelvic obliquity relative to the OMC system (−3.3° to −4.1°).
In contrast, Ruiz-Malagón et al.33 reported larger bias values during walking and high-speed running, with pelvic tilt biases of up to +4.6° and pelvic rotation biases reaching −11.2°. In patients, Zügner et al.34 found that pelvic tilt showed a small mean error of −0.5° compared with OMC. Reported correlation coefficients for pelvic orientation varied substantially across studies, ranging from poor or negative values in some tasks to strong agreement in others, depending on the movement plane and task demands22,26,27,30.
Lower and more variable correlation coefficients were reported by Lin et al.25 during high-speed running (0.44–0.89), whereas Ruiz-Malagón et al.33 reported weaker correlations overall, including negative values (−0.48 to 0.76). Overall, validity appeared stronger in controlled tasks, while high-speed movements were associated with greater error and weaker agreement. Although lower RMSE values were often reported for pelvic tilt, agreement across pelvic variables was not uniform across studies, and weaker performance was particularly evident under more demanding running conditions. Better performance was more commonly reported in studies using sacrum-based IMU placement and standardized calibration procedures, although incomplete methodological reporting limited direct comparison across studies.
Reliability of IMUs for pelvic orientation assessment
Reliability was assessed in four studies (Table 4). Most studies reported good-to-excellent ICC values for pelvic orientation, with values ranging from 0.81 to 0.99 in healthy and athletic populations 26,32,35. However, reliability was not consistently high across all populations, as poor pelvic-tilt reliability was reported in individuals following THA (ICC = 0.08)34. Lebleu et al.35 found high inter-session reliability for pelvic range of motion (ROM) during walking, although reliability varied by movement plane and calibration method. Perpiñá-Martínez et al.32 also reported ICC values > 0.80 for pelvic tilt, obliquity, and rotation during running at different speeds. These findings suggest consistent measurements during continuous functional activity. Kim et al.26 reported ICC values of 0.91 to 0.99 for pelvic rotation and obliquity during golf swings, indicating high repeatability in this sport-specific task.
| Study | Pelvic Variables | RMSE (°) | Bias / Mean Diff (°) | r | ICC | SEM (°) | MDC (°) |
| Buganè et al. 30 | Tilt, Obliquity, Rotation | Tilt = 0.73; Obliquity = 1.22; Rotation = 2.66 | Bias: Tilt −9.9 to −5.7; Obliquity −1.24 to −1.41; Rotation +0.71 to +1.5 | 0.88–0.95 | N/R | N/R | N/R |
| Bolink et al. 22 | Tilt, Obliquity | Tilt = 2.7; Obliquity = 2.68 | N/R | 0.86–0.94 | 0.94 -1.00 | N/R | N/R |
| Lebleu et al. 35 | Tilt, Obliquity, Rotation | Tilt = 0.9 to 1.0; Obliquity = 1.1 to 1.2; Rotation = 1.5 | N/R | N/R | 0.81–0.93 | 0.5–2.2 | N/R |
| Perpiñá-Martínez et al. 32 | Tilt, Obliquity, Rotation | N/R | N/R | N/R | tilt 0.868; obliquity 0.963; rotation 0.922 | N/R | N/R |
| Ekdahl et al. 31 | Pelvic sagittal, coronal, and transverse ROM | N/R | Mean diff: sagittal tilt: 0.67° to 2.13°; coronal obliquity: −0.46° to 0.61°; transverse rotation: −0.72° to −0.87° | N/R | N/R | N/R | N/R |
| Brice et al. 29 | Sagittal tilt at S2 (rowing) | Tilt = 2.43 to 4.90 | Bias: Tilt −2.70 to −0.09 | N/R | N/R | N/R | N/R |
| Lin et al. 25 | Tilt, Obliquity, Rotation (running) | Tilt = 4.31 to 4.59; Obliquity = 4.29 to 4.75; Rotation = 6.47 to 7.77 | Bias: Tilt −0.18 to +1.5; Obliquity −3.3 to −4.1; Rotation −1.1 to +0.99 | 0.44–0.89 | N/R | N/R | N/R |
| Asgari & Heller 27 | Tilt, Obliquity, Rotation | Tilt = 0.69; Obliquity = 0.77; Rotation ≈ 1.22. | Bias: Tilt −0.10; Obliquity −0.50; Rotation −0.49 | N/R | N/R | N/R | N/R |
| Bessone et al. 28 | Tilt, Obliquity, Rotation | Tilt = 2.5; Obliquity = 2.4; Rotation = 2.9 | Bias: Tilt −0.7; Obliquity −1.7; Rotation −1.3 | Tilt = -0.011; Obliquity = 0.82; Rotation = 0.83 | N/R | N/R | N/R |
| Kim et al. 26 | Obliquity, Rotation | N/R | Mean diff: Obliquity 1.65 | Obliquity = 0.92 | 0.91–0.99 | N/R | N/R |
| Rotation 0.76 | Rotation = 0.99 | ||||||
| Ruiz-Malagón et al. 33 | ROM: Tilt, Obliquity, Rotation (walk/run) | N/R | Bias: Tilt +0.2 to +4.6; Obliquity −1.1 to −6.1; Rotation +0.7 to −11.2 | −0.48 to 0.76 | −1.62 to 0.83 | N/R | N/R |
| Zügner et al. 34 | Tilt (THA patients) | N/R | Mean diff: Tilt −0.5 | N/R | 0.08 | N/R | N/R |
Table 4: Summary of validity and reliability outcomes for IMU-based pelvic orientation assessment. Summary of reported outcomes for pelvic tilt, obliquity, and rotation, including validity metrics such as RMSE, bias or mean difference, and correlation coefficients, as well as reliability metrics such as ICC, SEM, and MDC where available. Abbreviations: RMSE = root-mean-square error; r = Pearson correlation coefficient; ICC = intraclass correlation coefficient; SEM = standard error of measurement; MDC = minimal detectable change; ROM = range of motion; THA = total hip arthroplasty; N/R = not reported. Please click here to download this Table.
Data Availability
All data included in this systematic review have been provided as supplemental files.
Supplemental Table S1: Critical appraisal of study design for psychometric articles. Please click here to download this file.
Supplemental Table S2: Raw extracted data for the 12 included studies.Please click here to download this file.
Supplemental Table S3: Methodological quality assessment of included studies.Please click here to download this file.
Discussion
This systematic review examined the validity and reliability of IMUs for measuring pelvic orientation (tilt, obliquity, and rotation) across various functional tasks, sensor systems, and healthy and clinical populations. The findings suggest that IMUs are a feasible and reasonably accurate approach for assessing pelvic orientation, particularly during walking and other controlled tasks. Across the included studies, most IMU systems demonstrated good-to-excellent agreement with optical motion capture during walking and moderate-speed activities. Reported RMSE values for pelvic tilt were generally low, ranging from 0.69° to 4.90°. Pelvic obliquity and rotation showed greater variability and posed more challenges for estimating frontal- and transverse-plane pelvic orientation from IMUs. Reported RMSE values ranged from 0.77° to 4.75° for pelvic obliquity and from 1.22° to 7.77° for pelvic rotation, with the largest errors observed during more demanding tasks such as high-speed running25.
One possible explanation for the better results for pelvic tilt compared with pelvic rotation is that sagittal-plane motion may be less sensitive to cumulative drift, soft-tissue artifacts, and alignment-related errors than transverse-plane estimation. In contrast, pelvic rotation and, to a lesser extent, obliquity may be more affected by rapid changes in movement, sensor alignment, and methodological differences across studies. Task complexity also appears relevant, as lower error was more often reported during walking and other controlled tasks, whereas higher-speed running introduced greater variability. In addition, sacrum-based placement was the most commonly used approach across studies and may offer a more stable approximation of pelvic motion, although the influence of placement could not be compared directly across all studies because of incomplete methodological reporting. Finally, the more limited results in clinical or postoperative populations suggest that altered movement patterns and measurement conditions may influence performance, although this remains insufficiently studied.
The bias results also support the accuracy of IMUs among the included studies. However, an early study by Buganè et al.30 displayed a large systematic bias and underestimated pelvic tilts (−9.9° to −5.7°), whereas more recent studies with improved sensor-fusion and calibration procedures consistently reported low bias (<2°) across all planes27,28,29. Lin et al.25 similarly reported minimal tilt and rotation bias but identified a systematic underestimation in pelvic obliquity. One possible interpretation is that frontal-plane accuracy may be more sensitive to factors such as magnetometer drift or coordinate-frame alignment, although this was not directly evaluated in the included studies.
Task intensity appeared to influence validity, as higher error and bias were reported during high-speed running, particularly for pelvic rotation33. However, the specific contribution of filtering and sensor-fusion methods could not be determined because these details were incompletely reported. In addition, sacral IMU attachment via the waistband may have contributed to signal disturbance during high-acceleration tasks, although this should be considered an interpretive explanation rather than a directly demonstrated cause. Overall, these findings suggest that IMU performance may vary according to task demands and measurement conditions, with lower errors more often reported during steady-state gait, controlled athletic motions, and other less demanding tasks.
Generally, high repeatability of IMU-based pelvic measures was reported in the included studies. Bolink et al.22 and Perpiñá-Martínez et al.32 reported ICC values exceeding 0.90 across pelvic planes during walking and treadmill running, indicating excellent short-term repeatability and high consistency even during continuous functional activity. Lebleu et al.35 observed high inter-session reliability with ICC values of ≥0.98, with SEM values typically below 2.2°, supporting the suitability of IMUs for longitudinal monitoring. Kim et al.26 also found ICC values of 0.91-0.99 during golf-swing analysis, suggesting strong repeatability, even under complex sport-specific movement conditions. Very low reliability was observed for pelvic tilts in patients following THA. In that study, two IMUs were used on the pelvis, and their mean value was used34. This setup may have contributed to challenges in achieving consistent sensor placement in postoperative patients; however, this remains interpretive because the effect of this approach was not directly evaluated.
Implications for clinical and sports applications
The reviewed evidence suggests that IMUs can be used to assess pelvic orientation during functional and sport-specific tasks, particularly in controlled settings. However, because most included studies involved healthy or athletic participants, the applicability of these findings to clinical gait assessment, rehabilitation monitoring, and postoperative populations should be interpreted cautiously. Their portability may make them a practical option for repeated pelvic assessment and task-specific motion monitoring outside laboratory settings. However, caution is also warranted when applying IMUs to high-speed tasks such as running or in patients with altered pelvic mechanics, where accuracy and reliability may be reduced. Standardization of IMUs placement, calibration, and processing procedures remains critical for improving reproducibility across different tasks and settings.
For practical interpretation, lower RMSE and bias values indicate closer agreement between IMU-derived and reference measurements, whereas higher ICC values indicate greater repeatability. However, the practical significance of these metrics depends on the intended application. For example, smaller errors may be required for clinical decision-making or longitudinal monitoring than for broader movement screening in controlled sport or gait tasks. Because standardized thresholds for acceptable pelvic-orientation error were not consistently defined across the included studies, the findings of this review are best interpreted comparatively, with better results generally observed in controlled tasks and less consistent performance in high-speed or clinical contexts.
Future research directions
Future research on IMU-based pelvic orientation should aim to address several methodological and clinical gaps. Although IMUs have demonstrated good validity and reliability for pelvic orientation during controlled and sport-specific tasks, variability exists across studies in IMU placement, calibration strategies, fusion algorithms, and filtering procedures. Therefore, the development of standardized international guidelines for IMU-based pelvic assessment would markedly improve research and accelerate clinical translation. A priority for future work is expanding validation and reliability studies into clinical populations. Most of the included studies were conducted in healthy or athletic populations, limiting the generalizability to patients with low back pain, hip pathology, neurological disorders, or postsurgical movement impairments. Pathological movement patterns may introduce additional soft-tissue artifacts, altered pelvic coordination, and sensor alignment challenges not captured in the current review. Further validation in these populations is needed before broader clinical application can be recommended.
Finally, future studies should aim to strengthen reporting standards and statistical analysis by routinely presenting confidence intervals, effect sizes, validity metrics, and detailed descriptions of sensor-fusion and calibration procedures. Trials with standardized protocols will be essential to establish normative benchmarks and define best-practice thresholds for acceptable pelvic IMU accuracy across different movement tasks and populations.
Potential limitations
Several limitations of this systematic review should be considered when interpreting its findings. First, the total number of eligible studies was relatively small, with only 12 studies meeting the inclusion/exclusion criteria. Although these studies had moderate-to-high methodological quality, the limited evidence base limits the conclusions and may underestimate variability in IMU performance across different movement contexts. Second, most of the studies included were conducted in healthy young adults or athletic populations. Third, high methodological variability was evident across studies, including sampling frequency, sensor-fusion algorithms, calibration procedures, and coordinate system definitions. These inconsistencies limit cross-study comparability. In addition, incomplete and inconsistent reporting of these methodological characteristics restricted our ability to compare studies directly and limited the strength of any inferences regarding factors that may influence IMU performance. Finally, the reliability evidence remains limited. Some studies reported test–retest reliability, and only one study reported SEM values. No study reported MDC, which limited our ability to interpret whether observed longitudinal changes exceed measurement noise and are clinically meaningful, particularly in rehabilitation and return-to-sport contexts.
This systematic review shows that IMUs can provide useful measurements of pelvic orientation, with strong evidence for controlled tasks and studies using sacrum-based placement. Validity appeared more consistent for pelvic tilt, whereas greater variability and uncertainty were observed for pelvic obliquity and rotation, particularly during high-speed tasks. The available reliability evidence was generally favorable in functional and sport-specific tasks but remained limited in clinical populations. Overall, incomplete methodological reporting and heterogeneity across studies limit direct comparisons and broader conclusions. Further research with standardized protocols and more robust evaluation in clinical populations is needed to strengthen the evidence base.
Disclosures
The author has no conflicts of interest to declare.
Acknowledgements
The author extends the appreciation to the Deanship of Postgraduate Studies and Scientific Research at Majmaah University for funding this research work through the project number (R-2026-168). The author gratefully acknowledges Dr. Abdulaziz Alkathiry and Dr. Naif Alrashdi for their assistance in the method section.
Materials
| Name | Company | Catalog Number | Comments |
|---|---|---|---|
| Critical Appraisal of Study Design for Psychometric Articles | Slack Inc. | N/A | Methodological quality assessment tool used to evaluate the included studies. |
| IEEE Xplore | IEEE | N/A | Electronic database searched on 1 Nov 2025 for eligible studies. |
| Microsoft Excel | Microsoft Corporation | N/A | Standardized spreadsheet used for data extraction and cross-checking. |
| PROSPERO | Centre for Reviews and Dissemination, University of York | CRD420251179585 | International prospective register used for protocol registration. |
| PubMed | National Center for Biotechnology Information (NCBI) | N/A | Electronic database searched on 1 Nov 2025 for eligible studies. |
| Web of Science | Clarivate | N/A | Electronic database searched on 1 Nov 2025 for eligible studies. |