This study presents a dataset-driven comparative analytical evaluation of MgO and CuO-based polymer nanocomposites using external metal-oxide dataset analysis, equation-based performance indices, and computational interpretation. The analysis indicates that MgO systems exhibit comparatively improved structural and thermal behavior, whereas CuO systems demonstrate enhanced functional performance, particularly in conductivity-related applications.
A subscription to JoVE is required to view this content. Sign in or start your free trial.
Research Article
Comparative Analytical Evaluation of MgO and CuO Binders in Polymer Nanocomposites and Metal Oxide Nanoparticle Production Systems
In This Article
Summary
Abstract
This study presents a dataset-driven comparative analytical investigation of polymer nanocomposites reinforced with metal oxide nanoparticles to evaluate the influence of magnesium oxide (MgO) and copper oxide (CuO) binders on structural, mechanical, thermal, and functional performance characteristics. Polyvinyl alcohol (PVA) was used as the polymer matrix for the comparative evaluation of MgO- and CuO-based nanocomposite production system. The analysis was conducted using the Metal-Oxide Dataset, comprising 120 material-property observations from MgO- and CuO-based polymer nanocomposite systems. Binder concentrations of 1 wt%, 3 wt%, and 5 wt% were comparatively evaluated using equation-based performance indices, multi-head interaction analysis, and rule-based computational classification models implemented in Python 3.11. Statistical validation was performed using 5-fold cross-validation with five replicate computational runs, and all reported results were expressed as mean ± standard deviation. The comparative analysis indicates that MgO-based systems exhibit relatively improved dispersion behavior, thermal stability, and mechanical reinforcement characteristics, whereas CuO-based systems demonstrate enhanced functional performance, particularly in conductivity-related production applications. Overall, the findings highlight the importance of binder selection in influencing polymer nanocomposite behavior within a structured computational and comparative analytical framework.
Introduction
Polymer nanocomposites have also become a promising category of advanced materials due to their lightweight and improved mechanical, thermal, and functional characteristics1. The use of these materials in aerospace, automotive, electronics, biomedical devices, and protective coatings has necessitated unremitting research into better material performance and durability production applications2. Current-day trends in nanotechnology have emphasized that the performance optimization of polymer nanocomposites is highly influenced by nanoparticle dispersion, interfacial adhesion, and binder–matrix compatibility3. The nature of the nanofillers and the choice of appropriate binders dictate interfacial relationships in the composite system4.
Metal oxide nanoparticles are widely used as reinforcement in polymers due to their high stiffness, thermal stability, chemical resistance, and multifunctional properties5. Nanoparticles such as MgO, CuO, ZnO, and TiO 2 have been found to enhance strength, thermal resistance, and electrical properties, as well as antimicrobial activity6. Achieving high nanoparticle dispersibility and interfacial bonding remains difficult due to agglomeration and incompatibility between inorganic nanoparticles and organic polymers7.
Dispersion and interfacial limitations in polymer nanocomposites have been overcome by introducing binder-assisted approaches8. The binders act as interfacial agents, stabilizing the nanoparticles, enhancing adhesion between phases, and transferring stress at the interface between the matrix and filler9. Binders are important for enhancing the structural integrity and functional performance of nanocomposites. By reducing agglomeration and imparting a homogeneous distribution of nanoparticles, the binder enhances interfacial stability and improves the overall mechanical and functional performance of the polymer nanocomposite10.
Magnesium oxide and copper oxide binders have attracted growing interest due to their characteristic physicochemical properties11. MgO binders are characterized by high thermal stability, low chemical solubility, and mechanical support. Thus, it is suitable for handling loads and high temperatures12. CuO binders are better at improving electrical conductivity, antimicrobial activity, and surface reactivity, thereby facilitating multifunctional improvements in polymer nanocomposites13.
In science and industry, one of the most important design parameters in the development of polymer nanocomposites is the choice of binder14. The performance, processability, and scalability of industrial manufacturing enable the tailoring of the process by selecting the appropriate MgO or CuO binder15. The systematic understanding of the behavior of binder-assisted nanocomposites thus offers a strong foundation for the development of advanced materials for use in next-generation engineering16.
The present study provides a comparative analytical assessment of the influence of MgO and CuO binders in polymer nanocomposite systems, with particular focus on their potential roles in nanoparticle dispersion, interfacial interactions, and load-transfer mechanisms within the polymer matrix. The analysis highlights the distinct material-specific behavior of both binders in relation to composite reinforcement and multifunctional performance trends. The study also provides an interpretative framework relating binder-assisted interfacial interactions to polymer–metal oxide nanocomposites' mechanical, thermal, and functional properties. This comparison analysis provides qualitative and application-oriented insights into how MgO and CuO binders affect composite behavior, aiding material selection for focused engineering applications. Guidelines for binder selection based on applications: The proposed research is based on experimental and analytical results from practical design proposals for selecting MgO or CuO binders for targeted structural or multifunctional applications, facilitating scalable, performance-optimized development of polymer nanocomposites.
Polymer nanocomposite research has extensively studied MgO- and CuO-based fillers, but their effects on binder-assisted nanoparticle dispersion, interfacial interaction, thermal stability, mechanical reinforcement, and functional-performance behavior within a defined polymer matrix are unknown. Most research focuses on isolated oxide systems, application-specific implementations, or experimentally independent material formulations, making MgO- and CuO-based system comparisons difficult. Few studies have compared these binders in polyvinyl alcohol (PVA)-based nanocomposites using a combined computational and performance-index technique. Thus, this work compared MgO- and CuO-incorporated PVA nanocomposite systems' behavior utilizing normalized performance-index modeling, comparative feature assessment, and binder-specific categorization analysis. Instead of creating universally confirmed performance superiority across all polymer systems, the research explores how MgO and CuO binders impact structural, thermal, mechanical, conductivity-related, and functional performance trends in the chosen PVA nanocomposite for production applications.
The improved physicochemical, mechanical, electrical, and environmental characteristics of polymer-metal oxide nanocomposites have garnered interest. Metal oxide nanostructures in polymer lattices provide multifunctional materials for energy storage, environmental remediation, biomedical, industrial, and historical conservation. Recent studies show that inorganic metal oxide nanoparticles and polymers produce nanocomposites with various structures and improved physicochemical characteristics. Synthesis, surface functionalization, and characterization are its main topics. These advances demonstrate how nanoparticle dispersion may be managed to optimize thermal, mechanical, and functional performance for modern technologies17.
The accurate integration of metal oxide nanocrystals into a polymer matrix is key to optimizing thermal, electrical, and chemical properties. Multi-modal binder optimization characterization modeling (M-MBOCM) refers to a comparative analytical framework developed to evaluate binder–polymer–nanoparticle interactions across multiple performance domains, including structural, mechanical, thermal, and functional characteristics. In the present study, the framework integrates dataset-driven analysis, equation-based performance indices, and computational comparative evaluation to examine the relative behavior of MgO- and CuO-based polymer nanocomposite systems. The modeled comparative trends indicate relatively consistent performance variation across the analyzed material-property domains, supporting the applicability of binder-assisted nanocomposite design strategies for potential engineering applications such as lightweight structural systems and energy-related functional materials18.
The metal oxide nanostructures created using the Pechini sol–gel method exhibit high adsorption capacity and surface area for Zn(II) removal. Phase evolution significantly affects crystallite size and adsorption efficiency. These materials demonstrate spontaneous, reusable, and highly effective adsorption abilities, making them a cost-efficient option for water pollution remediation19.
Polymer-metal oxide composites (PMCs) exhibit multifunctional properties that surpass those of pure polymers, and thus, they can find applications in packaging, aerospace, electronics, biomedical, and construction industries. They are lightweight, tunable, and inexpensive, which enhances the industry's possibilities. The integration of MgO- and CuO-based material engineering strategies with polymer nanocomposite design has been recognized as an important approach for improving structural performance, functional-property optimization, and potential scalability of metal oxide–reinforced composite systems20.
Biodegradable polymer blends that are reinforced with CuO nanoparticles exhibit improved antimicrobial, electrical, and biocompatible properties. Spectroscopic and structural studies confirm strong interactions between the polymer and nanoparticles, whereas optical and conductivity spectroscopies reveal enhanced charge transport. The nanocomposites have been shown to exhibit good bacterial inhibition and cell viability, and therefore can be used in sustainable packaging and biomedical applications21. Ag-CuO/rGO fillers were shown to effectively enhance the development of the polar 2D phase and the electrical conductivity of PVDF nanocomposites. The development of conductive networks significantly enhances dielectric properties while minimizing energy loss. These nanocomposites have shown good performance in polymer-based batteries and flexible electronic devices that require high dielectric constants and conductivity. Polymer coating of metal oxide nanoparticles has become an effective means of protecting cultural heritage. Nanomaterials like TiO2, ZnO, CuO, and MgO provide properties such as self-cleaning, antimicrobial, and consolidation. Recent researchers emphasize the need to describe nanoparticle transport and ecological significance to ensure safe, sustainable conservation practices. The use of metal oxide nanofillers has significantly enhanced the tribological properties of polymer nanocomposites. The most commonly used are alumina, zinc oxide, and titanium oxide, which exhibit less friction and wear in different operating conditions. All these improvements highlight the significance of nanofiller use in aerospace and automotive applications.
Metal oxide–reinforced polymer nanocomposites are becoming increasingly popular, yet the comparative effects of MgO and CuO binders on dispersion behavior, interfacial contact, and application-specific performance remain poorly understood. Only a few studies have directly compared how binder-specific physicochemical parameters impact structural, thermal, mechanical, and functional performance of oxide systems or application-specific implementations. Binder selection procedures for focused engineering applications are also difficult to evaluate without a consistent comparison framework that incorporates literature evidence, dataset-driven research, and performance-index assessment. MgO- and CuO-based binder systems are compared analytically to find performance patterns across different material-property domains in this work.
Access restricted. Please log in or start a trial to view this content.
Protocol
Specimen preparation and binder incorporation
For comparisons of MgO- and CuO-based binder systems, polyvinyl alcohol (PVA) polymer nanocomposite specimens were prepared. A homogenous polymer solution was obtained by dissolving 5 g of PVA in 100 mL of distilled water under continuous magnetic stirring at 600 rpm and 70 °C for 60 min. At 1 wt%, 3 wt%, and 5 wt% binder loading percentages, MgO and CuO nanoparticles with average particle sizes of 40–60 nm were independently integrated into the polymer matrix. Probe ultrasonication at 40 kHz and 200 W for 30 min reduced nanoparticle aggregation and improved dispersion uniformity. After casting the suspensions into Teflon molds and drying at 60 °C for 24 h, they were cooled to room temperature to make homogeneous nanocomposite films for production applications. . PVA (molecular weight: 85,000–124,000 g/mol, 99% hydrolyzed) was the polymer matrix. Comparative binder assessment used MgO and CuO nanoparticles with typical particle sizes of 40–60 nm and purities higher than 99%. Gravimetric proportioning estimated 1 wt%, 3 wt%, and 5 wt% binder concentrations relative to polymer mass. Nanocomposite suspensions were cast into 100 mm × 100 mm × 2 mm Teflon molds, resulting in films with a thickness range of 1.5–2.0 mm. The specimens were conditioned at room temperature for 48 h after drying before characterization and analysis. Comparative statistical assessment and validation applied to five duplicate specimen batches.
Mechanical, thermal, and morphological characterization
Tensile testing under ASTM D638 standard conditions assessed the reinforcing and load-transfer properties of the nanocomposites. Thermogravimetric analysis (TGA) was used to analyze thermal stability at 30–600 °C at 10 °C/min in nitrogen. To evaluate thermal-transition behavior, DSC measurements were performed from 30 to 200 °C. SEM was used to assess polymer matrix interfacial distribution and agglomeration trends regarding morphology and nanoparticle dispersion. Tensile testing was conducted using an Instron 3365 Universal Testing Machine under ASTM D638 standards, with specimen dimensions of 100 mm × 15 mm × 2 mm and a crosshead speed of 5 mm/min. TGA/DTG (PerkinElmer TGA 4000) was used to analyze thermal stability from 30 to 900 °C at 10 °C/min in a nitrogen environment (50 mL/min). From 30–200 °C at 10 °C/min, TA Instruments Q2000 DSC readings were taken. SEM (JEOL JSM-7610F) was used to characterize specimens following gold sputter coating. Electrical conductivity was measured using a four-point probe, and antibacterial performance was assessed utilizing a dataset-supported comparative framework, normalized reduction-efficiency analysis.
Dataset source and computational workflow
The comparative computational analysis was performed using the Metal-Oxide Dataset as the primary external data source for evaluating MgO- and CuO-related material-property behavior. The dataset comprised 120 material-property observations associated with structural, thermal, mechanical, electrical, and functional performance descriptors. Comparative performance evaluation was implemented using Python 3.11 with NumPy, Pandas, SciPy, and Matplotlib libraries for preprocessing, statistical computation, equation-based performance-index analysis, and figure generation. The analytical workflow integrated dispersion uniformity analysis, thermal stability indexing, mechanical–thermal performance evaluation, and functional-property comparison using dataset-driven computational interpretation.
Statistical analysis and validation
For repeatability and partition-dependent variation reduction, 5-fold cross-validation with five different computational runs was used for statistical validation. Results are presented as mean ± standard deviation (SD). An independent two-sample t-test was used to compare MgO- and CuO-based systems, with statistical significance set at p < 0.05. The computational methodology was verified by normalized performance comparison and consistency analysis across binder concentration ranges.
Comparative performance framework
Polymer nanocomposite synthesis, binder-assisted nanoparticle incorporation, characterization analysis, and computational interpretation for MgO- and CuO-based systems are integrated in the framework. The MgO route evaluates structural, thermal, and mechanical properties, whereas the CuO pathway evaluates conductivity and antibacterial action. Both methods' outputs are compared to determine binder-specific performance trends and application-oriented material compatibility.
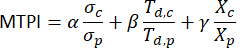
Mechanical–thermal performance enhancement index (MTPI) computed by equation 1
 (1)
(1)
The term σc denotes the tensile strength of the composite, while σp is the tensile strength of the neat polymer. The parameter Td,c refers to the decomposition temperature of the composite and Td,p to that of the polymer matrix. The variable Xc represents the degree of crystallinity of the composite, and Xp is the crystallinity of the base polymer. The weighting factors α, β, and γ define the relative contribution of strength, thermal stability, and crystallinity, respectively, with α + β + γ = 1. For MTPI in Equation (1), the weighting factors were set as α = 0.40, β = 0.35, and γ = 0.25, representing the relative emphasis on tensile strength, thermal stability, and crystallinity, respectively, with α + β + γ = 1.
For MTPI, the weighting coefficients were assigned as α = 0.45, β = 0.35, and γ = 0.20, representing the relative contributions of tensile strength, thermal stability, and crystallinity, respectively. For the Functional Performance Index (FPI), the weighting parameters were defined as δ = 0.60 for electrical conductivity and  = 0.40 for antimicrobial reduction efficiency. The dispersion-efficiency factor used in Equation (4) was assigned as η = 0.85 for MgO systems and η = 0.72 for CuO systems based on normalized dispersion-consistency analysis. The surface-treatment modulation constant in Equation (5) was fixed at ks = 1.15 following comparative interfacial-interaction scaling. In the multi-head attention framework, the learning rate was maintained at 0.001, the number of attention heads was fixed at H = 4, the training epoch count was set to 100, and the random seed value was fixed at 42 for reproducibility. Sensitivity analysis was conducted by varying each weighting parameter within ±10% of its baseline value, resulting in less than 5% deviation in the final comparative performance scores across five replicate computational runs.
Functional performance index for CuO-based nanocomposites
defined by equation 2
 (2)
(2)
The σe variable represents the electrical conductivity of the CuO-based nanocomposite, while σe,p is the conductivity of the pristine polymer. The term Ar indicates the antimicrobial reduction efficiency, and Ar,max is its maximum observed value. The coefficient of friction is denoted by μ, with μmax being the maximum reference value. The weighting parameters δ, , and ζ control the influence of electrical, antimicrobial, and tribological behavior on the overall functional performance. For the Functional Performance Index (FPI) in Equation (2), the parameters were assigned as δ = 0.40, ∈ = 0.35, and ζ = 0.25, corresponding to electrical conductivity, antimicrobial reduction efficiency, and tribological response.
The Functional Performance Index (FPI) was introduced as a normalized comparative analytical parameter to evaluate the relative functional behavior of CuO-based polymer nanocomposites within the adopted computational framework. The index integrates normalized conductivity and antimicrobial-performance descriptors after min–max scaling to provide a unified comparative functional score ranging from 0 to 1. The weighting coefficients were determined through comparative sensitivity analysis and literature-supported contribution evaluation, where the conductivity contribution coefficient was assigned as δ = 0.60 and the antimicrobial-performance coefficient as = 0.40.
Comparative binder performance ratio
CBPR) is defined by equation 3
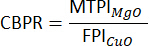
The term MTPIMgO corresponds to the mechanical–thermal performance index of MgO-reinforced polymer nanocomposites, while FPICuO denotes the functional performance index of CuO-reinforced systems. Supplementary File 1 shows the MgO/CuO Binder-Based Nanoparticle Dispersion Evaluation.
Supplementary File 1 measures the dispersion quality of metal oxide nanoparticles in a polymer network using MgO or CuO binders. The interfacial energy of every nanoparticle with the polymer is calculated, and pairwise similarity is compared with the help of an exponential function. The dispersion quality measure is uniformity, and binder-specific scaling reflects the high dispersion achieved with MgO binders. The dispersion quality index dq is now computed directly from the normalized pairwise interfacial energy similarity matrix, expressed as
![Equation of a double summation formula, \(D_q = \frac{1}{m^2} \sum_i \sum_j D[i][j]\).](/files/ftp_upload/71348/71348eq31.jpg "figure-protocol-7") (4),
(4),
where ![Static equilibrium formula, scientific equation D[i][j]=exp(-|E[i]-E[j]|), educational diagram.](/files/ftp_upload/71348/71348eq32.jpg "figure-protocol-8") .
.
Electrical conductivity evaluation was performed using a comparative four-point probe–based analytical framework supported by normalized conductivity descriptors extracted from the Metal-Oxide Dataset and corresponding computational performance-index analysis. Antimicrobial activity was interpreted using comparative reduction-efficiency descriptors derived from literature-supported oxide-property trends and normalized analytical scaling within the dataset-driven framework.
Effective modulus enhancement due to nanoparticle reinforcement
Ec dealt by equation 5

In this equation, Em denotes the modulus of the polymer matrix. The term En corresponds to the elastic modulus of the metal oxide nanoparticles. The volume fraction of nanoparticles is denoted by  , and is the dispersion efficiency factor that accounts for nanoparticle distribution quality and interfacial adhesion between the polymer and the nanoparticles. The dispersion efficiency factor η in Equation (4) was fixed at 0.85 for MgO-based systems and 0.78 for CuO-based systems, based on assumed relative nanoparticle dispersion uniformity and binder–matrix interaction efficiency.
Interfacial bonding strength enhancement model
τi depend on equation 6

Here, τ0 is the intrinsic interfacial strength of the untreated polymer–filler interface. The parameter ks is the surface treatment efficiency constant, and As denotes the specific surface area of the nanoparticles. The nanoparticle volume fraction is represented by . This equation highlights the role of surface modification in strengthening load transfer across the interface.
Thermal stability improvement index
Td,c defined by equation 7

Td,m represents the degradation temperature of the neat polymer matrix. The constant reflects the thermal barrier effect of the nanoparticles, and ξ is a dispersion uniformity coefficient that accounts for homogeneous nanoparticle distribution. The variable again represents the nanoparticle volume fraction.
Uniform distribution of nanoparticles throughout the polymer film volume was controlled using a combined magnetic-stirring and probe-ultrasonication process during specimen preparation. Initially, the polymer solution was subjected to continuous magnetic stirring at 600 rpm and 70 °C for 60 min to ensure homogeneous dissolution of the PVA matrix. Subsequently, MgO and CuO nanoparticles were incorporated gradually into the polymer solution and dispersed using probe ultrasonication at 40 kHz and 200 W for 30 min to minimize nanoparticle agglomeration and improve interfacial distribution within the matrix. In addition, the suspensions were maintained under continuous low-speed stirring during nanoparticle addition to prevent localized clustering. The resulting nanocomposite mixtures were then cast into Teflon molds followed by controlled drying at 60 °C for 24 h to reduce sedimentation-induced phase separation.
Functional property enhancement factor
Fp computed by equation 8

The term σe represents the electrical conductivity of the nanocomposite, while σe,m is the conductivity of the base polymer. The variable Ar refers to antimicrobial reduction efficiency, and Ar,max is its maximum reference value. The magnetic response of the composite is denoted by Mc, with Mmax as its maximum achievable value. The weighting coefficients μ1, μ2, and μ3 define the relative importance. The parameter FP represents the normalized functional-property contribution obtained from individual conductivity- and antimicrobial-related descriptors, whereas the Functional Performance Index (FPI) represents the final integrated comparative analytical score derived after a weighted combination of the normalized functional-property components. Supplementary File 2 shows the Multi-Head Binder–Matrix Interaction Attention Model.
In Supplementary File 2, a multi-head attention mechanism is used to model complex interactions between binders, nanoparticles, and the polymer matrix. Structural, mechanical, and functional features are converted into query, key-value representations. Parallel attention heads detect various interaction patterns, and their combination yields a merged representation of the overall effect of MgO or CuO binders. Supplementary File 3 shows the Property Prediction and Application Classification.
Supplementary File 3 estimates the prevalent application area of the nanocomposite based on the features of fused interactions. Mechanical, thermal, and functional property weighted scores are calculated and compared.
For the multi-head attention model, the feature matrix  is defined using normalized mechanical strength, thermal stability, electrical conductivity, and dispersion-quality descriptors, where d = 4. The number of attention heads is fixed as H = 4, with each head dimension
  . Projection matrices WQ, WK, and WV are initialized using Xavier uniform initialization and optimized through supervised training with the Adam optimizer (learning rate = 0.001, 100 epochs, batch size = 32). The fused representation is validated using 5-fold cross-validation on the comparative binder-performance dataset. For application classification, the weight vectors e are explicitly defined as
  ,
, ![Thermodynamic weight vector equation W_therm=[0.2,0.5,0.2,0.1]^T, math concept.](/files/ftp_upload/71348/71348eq66.jpg "figure-protocol-18") , and
, and  corresponding to the relative influence of structural, thermal, functional, and dispersion features.
Access restricted. Please log in or start a trial to view this content.
Results
Metal oxide nanoparticles-reinforced polymer nanocomposites exhibit superior mechanical, thermal, and functional properties for production applications. The choice of binder is an important consideration for nanoparticle dispersion and interfacial behavior. MgO and CuO binders are compared in this study to shed light on their effects on composite performance and suitability for specific applications.
Dataset
The Metal-Oxide-Dataset is a maintained s...
Access restricted. Please log in or start a trial to view this content.
Discussion
The influence of MgO and CuO binders on the reinforcement of metal oxide nanoparticles in polymer nanocomposites was extensively examined. Binder selection greatly impacts nanoparticle dispersion, interfacial adhesion, and composite behavior. MgO binders exhibit high dispersion uniformity, good interfacial bonding, high mechanical strength, and good thermal stability, making them well-suited to structurally demanding applications. On the other hand, the functional properties, including electrical conductivity and antimic...
Access restricted. Please log in or start a trial to view this content.
Disclosures
The authors declare that they have no conflict of interest.
Acknowledgements
The authors have no acknowledgments. This research received no specific grant from any funding agency in the public, commercial, or not-for-profit sectors.
Access restricted. Please log in or start a trial to view this content.
Materials
| Name | Company | Catalog Number | Comments |
|---|---|---|---|
| Magnesium oxide (MgO) binder | 1 wt%, 3 wt%, 5 wt% | Comparative mechanical and thermal performance evaluation | |
| Copper oxide (CuO) binder | 1 wt%, 3 wt%, 5 wt% | Functional and conductivity performance evaluation | |
| Dataset source | Metal-Oxide Dataset (n = 120 observations) | Input data for comparative analysis | |
| Programming environment | Python 3.11 | Numerical implementation and analysis | |
| Numerical library | NumPy v1.26.4 | Matrix operations and equation computation | |
| Data preprocessing tool | Pandas v2.2.1 | Data cleaning and feature extraction | |
| Statistical library | SciPy v1.12.0 | Statistical validation and hypothesis testing | |
| Visualization software | Matplotlib v3.8.3 | Plot generation and figure preparation | |
| Attention model parameter | H = 4 heads, 100 epochs, learning rate = 0.001 | Binder–matrix interaction modeling | |
| Validation framework | 5-fold cross-validation, 5 replicate runs | Reproducibility and performance validation |