Here, we present a harmonized workflow for the flow cytometry quantification of tissue factor-positive platelets in multicenter studies. The protocol describes standardized procedures for blood collection, whole blood fixation, staining, and instrument harmonization, allowing analysis to be performed either locally or centrally, depending on laboratory capabilities.
Method Article
Whole Blood Flow Cytometric Quantification of Tissue Factor-Positive Platelets: A Harmonized Multicenter Workflow
In This Article
Summary
Abstract
Tissue Factor (TF)pos-platelets represent a subset of the platelet population. Recently, this subset has been shown to predict cardiovascular mortality in patients with coronary artery disease, establishing it as a biomarker useful for thrombotic risk stratification. Accurate quantification of TFpos-platelets by flow cytometry requires strict standardization of pre-analytical handling, staining procedures, and instrument settings, particularly in multicenter studies where technical variability may affect their measurement. This protocol describes a harmonized workflow for whole-blood flow cytometry assessment of circulating TFpos-platelets, designed to ensure reproducibility across laboratories with different technical infrastructures. The procedure includes standardized blood collection and whole-blood fixation to preserve the in vivo platelet phenotype. Two different methods for sample preparation are provided according to local laboratory capabilities: shipment of fixed samples to the Core Laboratory for centralized staining, acquisition, and analysis for centers without flow cytometry facilities, or local staining and acquisition for centers equipped with flow cytometry instrumentation and trained personnel. The assessment of the percentage of TFpos-platelets is achieved by direct labeling with anti-TF Star Fluor 488 and anti-CD41 PerCP-Cy5.5 antibodies to identify the target protein and the platelet population marker, respectively. Flow cytometer harmonization is achieved either through a shared acquisition template for identical cytometer models or through bead-based alignment for different platforms. The workflow further incorporates a standardized gating approach and centralized data analysis to enable reliable comparison of TFpos-platelet measurements across sites. Representative results demonstrated that this workflow supports reproducible quantification of TFpos-platelets across the validated multicenter acquisition settings. This protocol may facilitate broader application of TFpos-platelet assessment in thrombotic risk stratification and support wider standardization of platelet flow cytometry in translational and clinical research.
Introduction
Tissue Factor (TF) is the main initiator of the blood coagulation cascade and a key determinant of thrombin generation. Beyond its classical expression by subendothelial cells and leukocytes, TF is also associated with circulating platelets1,2,3,4,5. During thrombopoiesis, megakaryocytes transfer TF to a subset of platelets6. Under physiological conditions, approximately 20–30% of circulating platelets contain TF stored within the open canalicular system, spatially segregated from plasma factor VII7. In this compartmentalized state, TF is functionally shielded from circulating coagulation factors and remains inactive. Accordingly, only a small fraction of platelets displays detectable surface TF when whole blood from healthy individuals is analyzed by flow cytometry, reflecting physiological homeostasis2,8. Pathological conditions characterized by platelet activation and thrombo-inflammatory imbalance can disrupt this equilibrium, leading to increased surface exposure of TF. Elevated proportions of TF-positive (TFpos) platelets have been reported in several thrombotic disorders9,10,11,12,13,14,15. Notably, in coronary artery disease, TFpos-platelet levels exceeding 4% independently predict cardiovascular mortality at 5-year follow-up, establishing the percentage of TFpos-platelets as a clinically relevant biomarker of thrombotic risk16.
Accurate and reproducible quantification of TFpos-platelets is therefore essential for both translational and clinical research applications. A previously published platelet flow-cytometry workflow for TFpos-platelets assessment has improved the study of this protein in single-center settings17 providing advice on optimizing selected pre-analytical or analytical steps. However, that approach was not specifically designed to address the additional logistical and analytical challenges of multicenter studies, including shipment procedures, standardized sample processing, and considering also the need to harmonize sample acquisition across different flow cytometer platforms. Furthermore, the different infrastructures and levels of technical expertise of the participating centers must also be considered.
In this context, the added value of the present protocol lies in providing a detailed workflow that combines standardized blood collection and whole-blood fixation, flexible sample-processing protocols, cross-platform acquisition harmonization, and direct staining and centralized quality control through data analysis.
The aim of this work is therefore to provide an operational framework for harmonized multicenter implementation of TFpos-platelet analysis in whole blood by flow cytometry. This integrated design reduces pre-analytical, analytical, and inter-instrument variability, thereby setting the condition for the consistent assessment of TFpos-platelets in multicenter settings.
Protocol
All blood donors provided written informed consent approved by the Ethical Committee of the Institution (no.70/24, CE 18.06.24).
The multicenter workflow for whole-blood flow cytometry quantification of TFpos-platelets is summarized in Figure 1. The protocol detailed below will guide the user through five main steps.
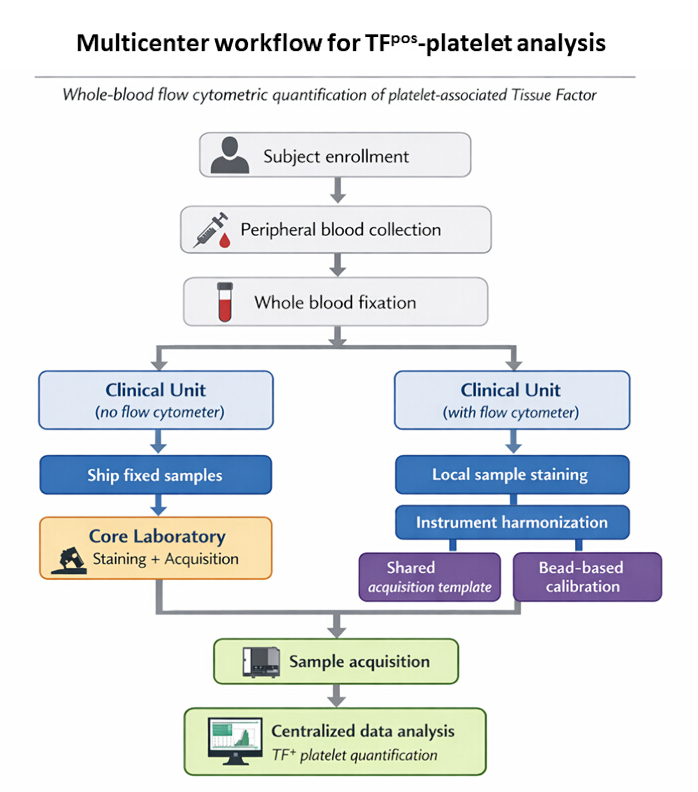
Figure 1: Multicenter workflow for TFpos-platelet analysis. Schematic representation of the analytical pipeline for multicenter assessment of circulating TFpos-platelets by whole-blood flow cytometry. Following subject enrollment and blood withdrawal, samples are fixed and processed according to the technical resources available at each Clinical Unit. Centers without flow cytometry facilities ship fixed samples to the Core Laboratory for staining, acquisition, and analysis. Centers equipped with flow cytometers may perform on-site staining and acquisition using standardized acquisition templates. Instrument harmonization is achieved either through shared templates (same instrument model), templates generated at the Core Laboratory (different model available for alignment), or calibration with fluorescent beads when direct template harmonization is not feasible. Data analysis is performed centrally using a standardized gating workflow. The diagram was created using ChatGPT (OpenAI). Please click here to view a larger version of this figure.
1. Blood collection
NOTE: The TFpos-platelets assessment requires a maximum of 50 µL of whole blood.
- Collect peripheral venous blood from the antecubital vein using a 19-gauge butterfly needle. Apply the tourniquet only for venipuncture and release it immediately after needle placement to minimize ex vivo platelet activation.
- Discard the first EDTA tube. Then collect blood into a 0.129 M sodium citrate vacutainer, filling the tube to the manufacturer's mark to preserve the correct blood-to-anticoagulant ratio.
- Gently invert 5 times to mix blood and anticoagulant thoroughly.
- Keep the tube upright at room temperature, avoiding agitation, refrigeration, or pneumatic transport.
- Process the sample within 3 h after collection.
2. Sample preparation
NOTE: All antibodies must be purchased by the Core Laboratory and must all come from the same batch. If a batch change becomes necessary during the ongoing study, the new reagent batch should be bridged directly to the in-use batch through parallel testing under the same assay conditions and adopted only if comparable performance is confirmed. Commonly used reagents (e.g., PBS – phosphate-buffered saline – and PFA – paraformaldehyde) may be purchased by each participating center; however, the product codes must match those used by the Core Laboratory, and batch consistency must be maintained throughout the study.
- Fix the sample.
NOTE: Before starting blood processing, prepare 1% PFA by diluting 4% PFA with PBS at room temperature.
CAUTION: PFA is toxic and should be handled in a chemical hood while wearing appropriate personal protective equipment (lab coat, gloves, and eye protection). Avoid inhalation and contact with skin or eyes. WASTE DISPOSAL: Collect all PFA-containing solutions, fixed samples, and contaminated consumables into properly labeled, closed hazardous-waste containers in accordance with institutional and local regulations.- Gently invert the vacutainer 5 times to mix blood and anticoagulant.
- Transfer 50 µL of blood into a 2 mL tube containing 950 µL of 1% PFA.
- Gently mix the sample and incubate for 1 h and 30 min at room temperature.
- Add 500 µL of PBS.
- Centrifuge at 1500 x g for 5 min at room temperature.
- Remove the supernatant and resuspend the pellet in 1 mL of PBS.
NOTE: Technical checkpoint: After centrifugation, confirm that the pellet is visible before removing the supernatant. Carefully remove the supernatant without disturbing the pellet. After resuspension, verify that the sample is homogeneous and free of visible clumps or aggregates. - Ship the fixed sample to the Core Laboratory in temperature-controlled packaging maintained at 2-8 °C within 24 h after fixation. Do not freeze. Document collection time, fixation time, and shipment time.
- Sample labeling for flow cytometry analysis.
NOTE: Anti-TF Star Fluor 488 (clone HTF1; anti-CD142) is directed against Tissue Factor, whereas anti-CD41 PerCP-Cy5.5 recognizes platelet integrin alphaIIb. Before starting the staining procedure, centrifuge antibodies at 17000 x g for 5 min at +4 °C to remove any aggregate18. Dilute anti-TF Star Fluor 488 antibody (1:100) with PBS. Anti-CD41 PerCP-Cy5.5 does not require intermediate dilution and should be used at the volume recommended by the manufacturer.- Prepare four 2 mL polypropylene tubes.
- Dispense 80 µL of fixed sample in each tube.
- Add to each tube the correct volume of PBS and anti-TF Star Fluor 488 antibody as indicated in Table 1 (Day 1).
- Gently mix the samples.
- Incubate O/N at 4 °C in the dark.
- The following day (Day 2), add anti-CD41 PerCP-Cy5.5 to tubes 3 and 4 as indicated in Table 1.
- Gently mix the samples.
- Incubate for 15 min at room temperature in the dark.
- Dilute each tube with 300 µL of PBS.
- Store stained samples in the dark until flow cytometry acquisition.
NOTE: Samples can be stored at 4 °C for up to three days17. Longer storage results in progressive signal decay and should be avoided.
| Day 1 | Day 2 | |||
| No. | Tube ID | 1X PBS (µL) | Anti-TF Star Fluor 488 (µL) | Anti-CD41 PerCP-Cy5.5 (µL) |
| 1 | Unstained | 20 | 0 | 0 |
| 2 | TF | 12.5 | 7.5 | 0 |
| 3 | CD41 | 15 | 0 | 5 |
| 4 | TF/CD41 | 7.5 | 7.5 | 5 |
Table 1: Staining protocol for TFpos-platelet evaluation.
3. Standardization of flow cytometer acquisition
- Setting of an acquisition template (by the Core Laboratory).
- Template set up for Flow Cytometer A.
- Open the software A v2.6.
- Create FSC-A/SSC-A dot plot [All Events] in log-scale to visualize cell populations (Figure 2A).
- Create a CD41 PerCP-Cy5.5-A/SSC-A dot plot [All Events] in log-scale to identify platelets within a [Platelets] gate (Figure 2B).
- Create a PerCP-Cy5.5-A/Star Fluor 488-A pseudocolor plot [All Events] to check for spillover/compensation (Figure 2C).
- Create a FSC-A/FSC-H dot plot in [Platelets] gate and define a region to identify singlets ([Singlets]; Figure 2D).
- Create a CD41 PerCP-Cy5.5-A/TF Star Fluor 488-A dot plot in [Singlets] gate to identify TFpos-platelets (Figure 2E).
- Set threshold to 1000 on SSC-H.
- Set the flow rate to “Slow”.
- Set the B525 gain to 315 to ensure optimal discrimination between positive and negative events; adjust if needed according to the instrument used.
- Set the B690 gain according to daily QC. Acquisition is acceptable only if the CD41pos- platelet population is fully resolved from the negative background and remains within the predefined reference gate established in the template during acquisition.
- Export the template using the “Export Experiment Template”.
- Download: The acquisition template for TFpos-platelet analysis on the Flow Cytometer A is available for download as Supplementary File 1 and Supplementary Figure 1.
NOTE: A plot to check for spillover/compensation (Figure 2C), although not required for this multiparametric analysis, is included. It should nevertheless be considered whether a combination of fluorochromes different from those proposed in this protocol will be used.
- Create a template for Flow Cytometer B.
- Create a protocol file that includes the entire acquisition setup as described in 3.1.1.
- Export the template using the “Export Protocol” function in software B v1.6, generating a protocol file.
- On the receiving instrument, import the protocol file using the “Import Protocol” function within software.
- Template creation for Flow Cytometer C.
- Create a workspace file that includes the entire acquisition setup as described in 3.1.1. and export it.
- On the receiving instrument, import the workspace file using the "Copy" function of the software C v3.1.
- Template set up for Flow Cytometer A.
- Flow cytometers’ harmonization using calibration beads.
NOTE: Use 6-peak Rainbow calibration beads.- Target Value Definition.
NOTE: Use the following formula to define the Median Fluorescence Intensity (MdFI) of the first peak in the B525 fluorescence channel:
MdFI_CU =
where CU: Clinical Unit instruments and RI: Reference Instrument. - Sample Preparation.
- Vortex the bead vial.
- Add 5 drops of beads to a sample tube.
- Add 1 mL of PBS.
- Vortex for 5-10 s.
- Bead acquisition.
- Create an FSC-A/SSC-A dot plot in log-scale displaying [All Events], and define a region called [Beads] (Figure 3A).
- Create a FSC-A/FSC-H dot plot in [Beads] gate and define a region to identify singlets [Singlet] (Figure 3B).
- Create a histogram plot for the Star Fluor 488 fluorescence channel (B525).
- Display only [Singlet] on the histogram.
- Draw a gate across the entire width of the first peak (region B in Figure 3C).
- In the Statistics ribbon, display X Median (X-Med) values.
- Remove any existing compensation.
- Set the flow rate to “Slow”.
- Start acquisition in “Run” mode.
- From “Acquisition setting”, modify the B525 voltage/gain to reach the X-Med target calculated according to the target value.
- Record a data file of 10,000 events in the [Singlet] gate only after that acceptance criterion has been reached. Do not acquire study samples until the target range is met.
- Target Value Definition.
Supplementary File 1: Acquisition template for TFpos-platelet analysis on the Flow Cytometer A available for download. Please click here to download this file.
Supplementary Figure 1: Screenshot of the acquisition template for TFpos-platelet analysis on Flow Cytometer A. (A) The FSC-A vs SSC-A dot plot provides a visual representation of the overall event distribution. (B) Platelets are identified in a CD41 vs SSC-A plot and gated as [Platelets]. (C) A PerCP-Cy5.5 vs Star Fluor 488 plot is included to evaluate potential spillover. (D) Doublets are excluded within the [Platelets] gate using an FSC-A vs FSC-H plot, defining the [Singlets] population. (E) TFpos -platelets are identified within the [Singlets] gate based on PerCP-Cy5.5 and Star Fluor 488 fluorescence. (F-H) The acquisition settings, including sample flow rate (Slow), primary threshold (SSC), and detector gains (B525 and B690), as implemented in the template, are shown. Full details of the acquisition setup and workflow are provided in section 3.1. Please click here to download this file.
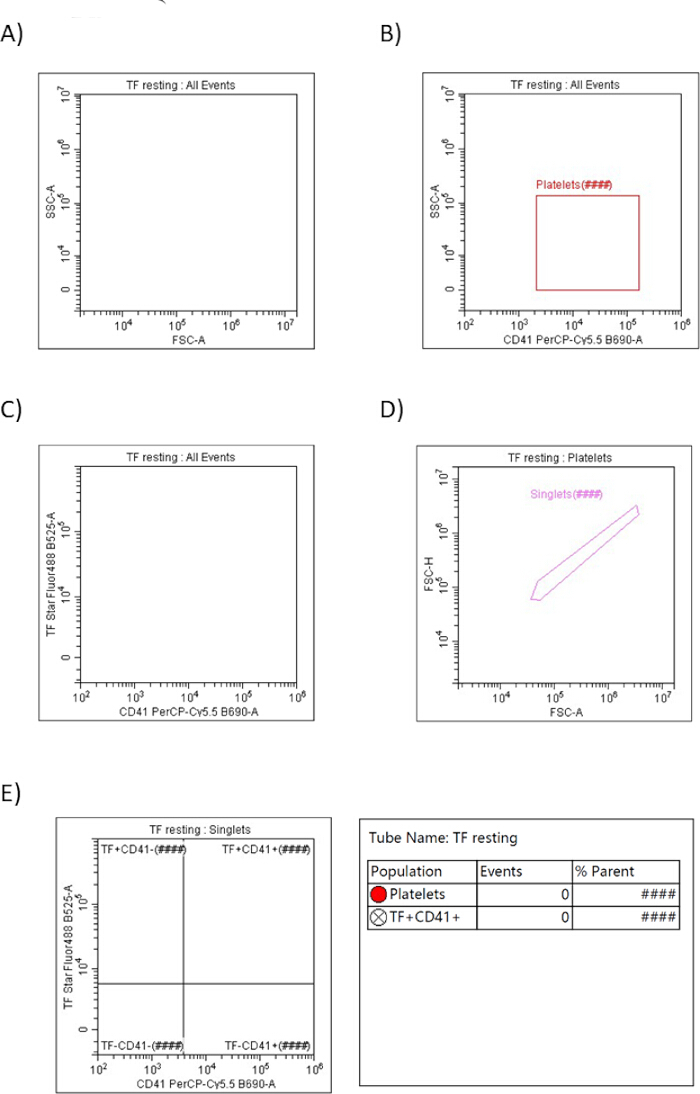
Figure 2: Acquisition template and gating strategy for identification of TFpos-platelets. (A) FSC-A/SSC-A dot plot (log scale) showing all detected events. (B) CD41-A/SSC-A dot plot used to identify the platelet population. (C) PerCP-Cy5.5/Star Fluor 488 pseudocolor plot used to evaluate spectral spillover and compensation requirements. (D) FSC-A/FSC-H plot in [Platelets] gate used to exclude doublets and define singlets. (E) PerCP-Cy5.5/Star Fluor 488 dot plot in [Singlets] used to identify TFpos-platelets. The statistics fields displayed in parentheses are automatically populated with sample-specific values when the template is applied during sample acquisition. Please click here to view a larger version of this figure.
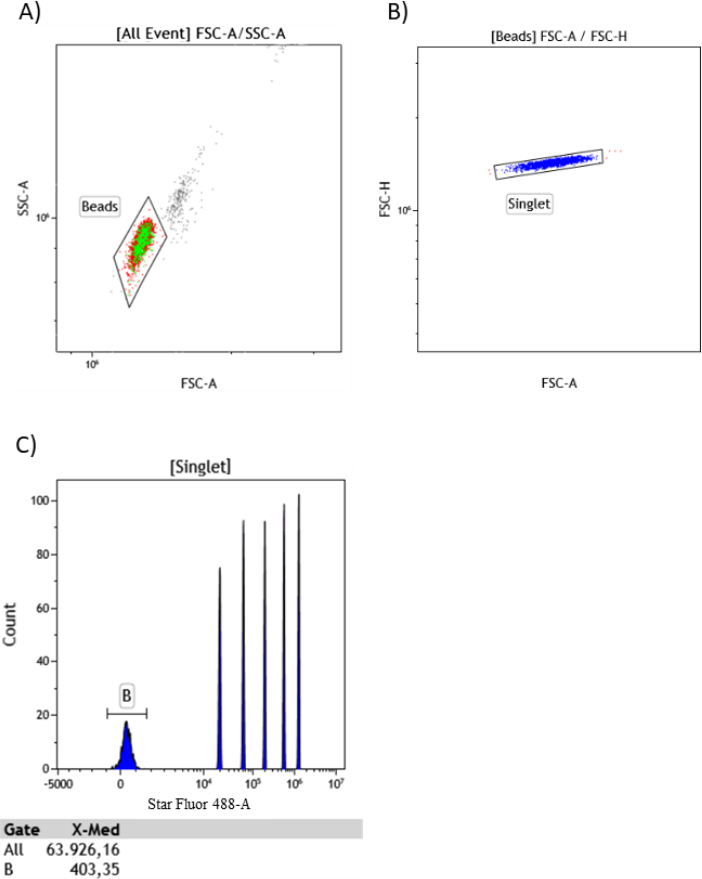
Figure 3: Bead-based instrument calibration procedure. (A) FSC-A/SSC-A plot used to identify bead events. (B) FSC-A/FSC-H plot within bead events used to exclude aggregates and define singlets. (C) Histogram of Star Fluor 488 fluorescence displaying bead peaks with gating applied to the first bead peak for median fluorescence intensity determination. The visualized statistics are to be considered as representative. Please click here to view a larger version of this figure.
4. Flow cytometry sample acquisition for TFpos-platelet analysis
- Acquire using a FCM template.
- Import the acquisition template using the “Import Template” function within software A.
- Acquire the samples prepared in step 2.
- Verify that platelet and singlet gates match the reference plot geometry before data recording. Adjust gates if needed.
- Start recording after 5–10 s of stable flow. Record a data file of 20,000 events within the [Singlets] gate (refer to Figure 2D). Save uncompensated .fcs files and forward them to the Core Laboratory.
- Acquisition without a FCM template.
- Recreate an acquisition worksheet as reported in section 3.1, including the five plots described and the gate hierarchy: All Events > Platelets > Singlets > TF/CD41 quadrants.
- Set threshold to 1000 on SSC-H.
- Set the flow rate to “Slow”.
- Set B525 voltage/gain as defined in 3.2.3.
- Acquire the sample prepared in step 2. Start recording after 5–10 s of stable flow; acquire 20,000 events within the [Singlets] gate. Save uncompensated .fcs files, and forward them to the Core Laboratory.
NOTE: Acquisition is acceptable only if daily QC instrument is passed. If the target of 20,000 CD41pos– platelets cannot be reached, acquire a minimum of 10,000 CD41pos-platelet events.
5. Data analysis
NOTE: The analysis workflow described below is intended to support the activities of the Core Laboratory responsible for centralized data processing and quality control.
- Open a new analysis worksheet and load the .fcs files.
- For each sample, create an analysis template as shown in Figure 2. For non-identical platforms, use an equivalent platform-specific template with the same gate structure and statistical outputs.
- Verify that gating correctly identifies the platelet population according to the predefined scatter characteristics and singlet-discrimination strategy (Figure 4A,B,D).
- Check for spillover/compensation by means of a pseudocolor plot [All Events] (Figure 4C).
NOTE: The fluorochrome Star Fluor 488 has a spectral emission at 520 nm, compared to PerCP-Cy5.5, which has a spectral emission at 676 nm, explaining the lack of overlap and the need for no compensation. - Apply the following gating sequence in the Star Fluor 488 dot plot (Figure 5):
- Unstained: define quadrants using the unstained control so that background TFpos-events remain at or below 0.01% of platelet events, hereby excluding platelet autofluorescence (Figure 5A).
- TF: apply the quadrant coordinates defined in the unstained sample to identify TFpos-signal in single-stained samples (Figure 5B).
- CD41: define quadrants using the single stained CD41 sample to exclude the background fluorescence of platelets (Figure 5C).
- TF/CD41: apply the same quadrants coordinates to identify TFpos-signal in TF/CD41-stained samples (Figure 5D).
NOTE: The final TFpos-platelet percentage is obtained from the statistics generated by the analysis software and is reported as the percentage of CD41pos-events that fall within the TFpos-quadrant of the gated platelet population.
- Perform centralized quality control on file name identification, reagent batches, fixation-to-acquisition interval, shipping temperature, event count, and outlier fluorescence distributions. Files showing documented deviations in local handling, shipping, fixation timing, or acquisition settings should be flagged, reviewed centrally, and either excluded or repeated, as per the study-specific deviation management plan.
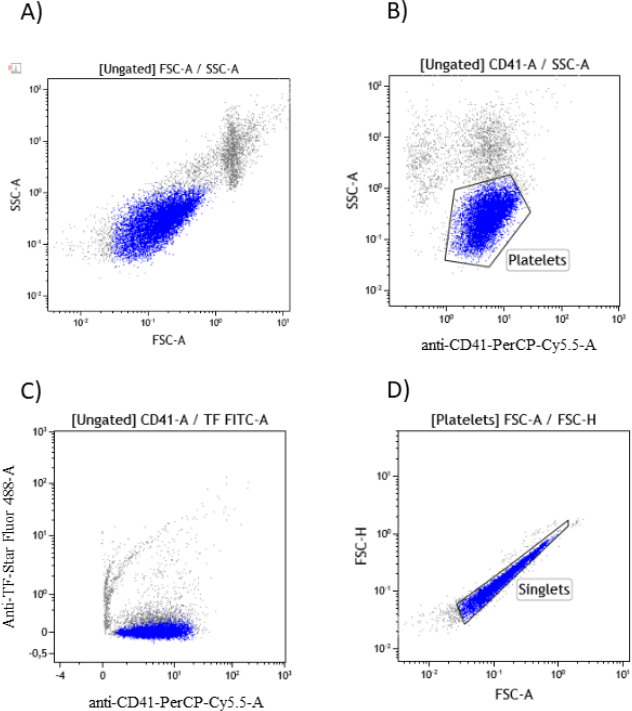
Figure 4: Sequential gating strategy for TFpos-platelet analysis. Representative analysis workflow illustrates the identification of platelet populations after loading .fcs files. (A-B) Dot plots confirming correct gating of platelet populations. (C) PerCP-Cy5.5/Star Fluor 488 pseudocolor plot used to assess spectral spillover. (D) FSC-A/FSC-H plot within the platelet gate used to exclude doublets and to define singlets. Please click here to view a larger version of this figure.
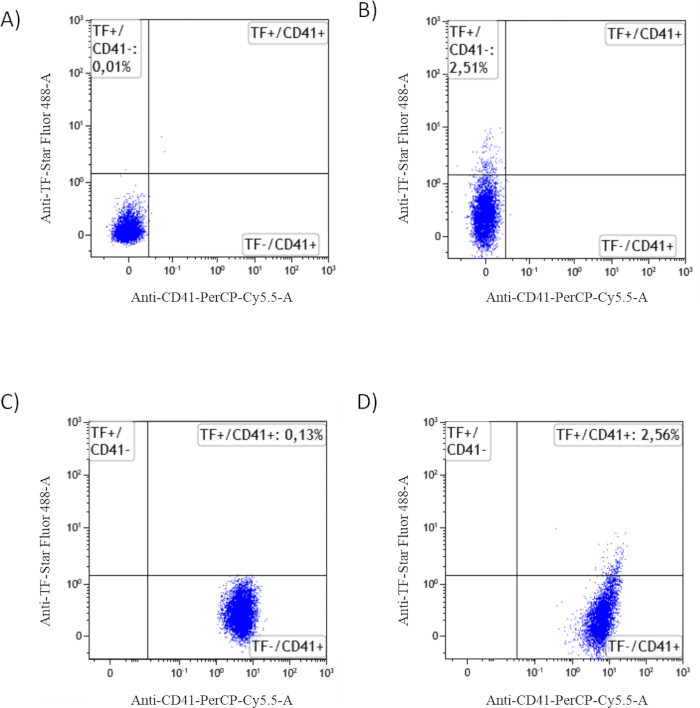
Figure 5: Template for data analysis. Representative dot plots of (A) unstained control used to define baseline autofluorescence and quadrant positioning. (B) TF single-stained sample; (C) CD41 single stained sample used to define quadrant positioning. (D) TF/CD41 double-stained sample used for TFpos-platelet analysis. Numbers indicate the percentage of TFpos-platelets in a representative sample. Please click here to view a larger version of this figure.
Results
This workflow was specifically designed to allow centers with heterogeneous technical infrastructures to participate in multicenter studies that require quantification of TFpos-platelets. Figure 1 illustrates the organizational workflow diagram designed to support multicenter studies aimed at measuring circulating TFpos-platelets by whole-blood flow cytometry. Different sample preparation procedures are implemented depending on the technical resources available at participating centers. Specifically, (i) when a Clinical Unit lacks a flow cytometry facility or trained personnel, whole-blood samples undergo fixation immediately after collection and are then shipped to the Core Laboratory for centralized staining, acquisition, and analysis. (ii) Alternatively, centers equipped with flow cytometry facilities may perform staining and acquisition locally. In these cases, data acquisition follows a harmonized workflow defined by the Core Laboratory. If the instrument model matches that used in the Core Laboratory, acquisition is performed using a standardized template provided by the Core Laboratory. When different instrument models are used, harmonization may be achieved either through template transfer -when instruments are available for alignment at the Core Laboratory- or through bead-based calibration procedures prior to sample acquisition. Samples can then be acquired and analyzed according to the standardized workflow.
The following representative results are intended to illustrate workflow feasibility and key harmonization steps, rather than to provide formal multicenter assay validation. To ensure reliable TF detection, the staining strategy was first evaluated for spectral compatibility and signal stability. Platelets were identified using anti-CD41 PerCP-Cy5.5, while TF detection relied on an anti-TF monoclonal antibody conjugated to Star Fluor 488. Single-stained controls were used to verify the absence of fluorescence spillover between detection channels. As shown in Figure 6A, CD41 PerCP-Cy5.5 single-stained samples produced no detectable signal in the Star Fluor 488 channel. Consistently, the percentage of TFpos-platelets measured in double-stained samples was comparable to that obtained in TF single-stained samples (Figure 6B).
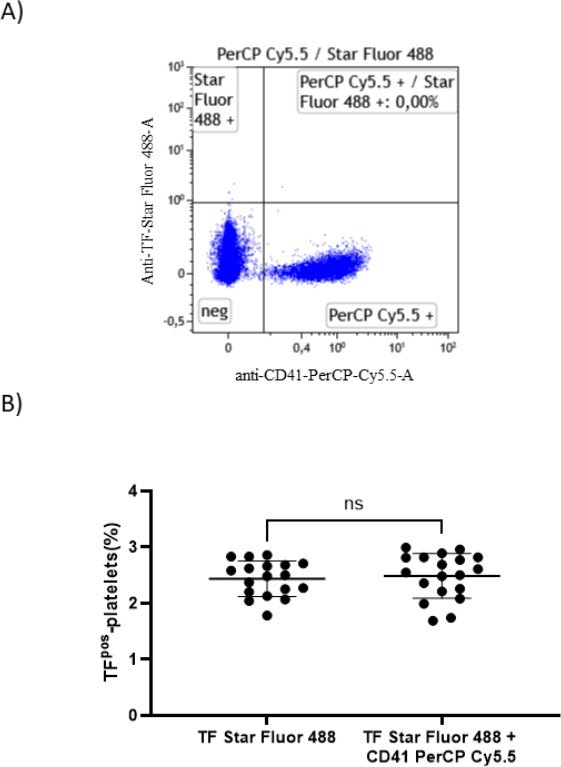
Figure 6: Validation of staining specificity. (A) Single-stained anti-CD41 PerCP-Cy5.5 sample analyzed in a PerCP-Cy5.5/Star Fluor 488 dot plot to verify signal specificity. (B) Percentages of TFpos-platelets measured in TF single-stained versus TF/CD41 double-stained samples are shown as individual paired measurements (dots) and mean ± SD (n = 18 independent subjects). Data were analyzed by the Wilcoxon matched-pairs signed-rank test. Please click here to view a larger version of this figure.The analytical sensitivity of the proposed assay was evaluated on samples from n=200 healthy subjects. Using biologically blank samples, the calculated limit of blank (LoB) was 0.39%, the limit of detection (LoD) was 0.77%, and the limit of quantification (LoQ) was 1.12%, defined as the lowest level associated with a CV ≤ 20%. Inter-operator reproducibility of the gating strategy was assessed on 40 independent samples analyzed by 6 operators using the predefined analysis template, yielding an ICC of 0.985 (95% CI: 0.978-0.990).
The stability of TF detection after whole-blood fixation was then evaluated by staining fixed samples longitudinally. Compared to baseline samples stained on the day of fixation (D0), TFpos-platelet levels remained stable for up to four days after fixation (D3-D4), showing only a non-significant decrease of approximately 22% at D3-D4 (77.8 ± 7.2% - relative percentage in TFpos-platelet) compared to the D0 level. When the staining was performed at D5-D6, TFpos-platelet detection decreased significantly to 53.8% ± 20.7 % (relative percentage in TFpos-platelet; p< 0.0001; Figure 7). These results indicate that fixed samples can be reliably analyzed within four days after fixation with only a modest loss of signal.
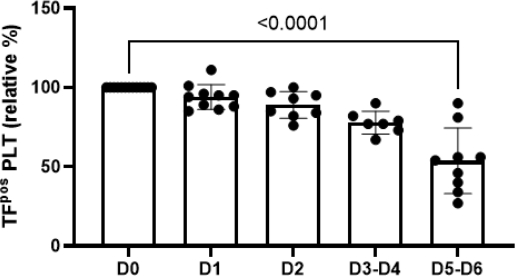
Figure 7: Time-course analysis after sample fixation. Quantification of TFpos-platelets measured at different time points after fixation indicated in the x-axis as follows: D0 = day of blood collection; D1 = day 1; D2 = day 2; D3-4 = day 3 or 4; D5-6 = day 5 or 6. Data are expressed as mean ± SD relative percentage compared to D0 (n = 7-10 healthy subjects, evaluated across the indicated post-fixation time points). Data were analyzed using Anova followed by Dunnett’s multiple comparison test. Please click here to view a larger version of this figure.
The performance of the harmonized acquisition workflow was subsequently evaluated across different flow cytometry platforms. Template-based harmonization was first evaluated using FACSLyric and MACSQuant instruments as reference cytometers. Additional instruments of the same models located at external facilities were used as test platforms. Whole-blood samples containing resting platelets were acquired on both reference and test instruments using the standardized acquisition template. As shown in Figure 8A,B, comparable TFpos-platelet percentages were obtained across reference and test cytometers, confirming the reproducibility of the shared-template approach.
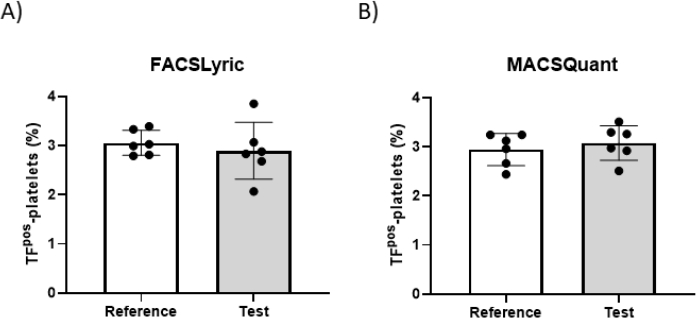
Figure 8: Cross-instrument reproducibility using shared acquisition templates. Percentages of TFpos-platelets measured in whole-blood from n=6 healthy subjects acquired on reference and test FACSLyric (A) or MACSQuant (B) instruments by means of a shared acquisition template applied across instruments. Data are expressed as individual determinations (dots) and mean ± SD. Data were analyzed by a paired t-test. Please click here to view a larger version of this figure.
Finally, bead-based harmonization was evaluated to align instruments of different configurations. Cytometer A was used as the reference instrument, and a FACSymphony as the test instrument. Alignment was performed using 6-peak Rainbow calibration beads by adjusting the FACSymphony 488 nm detector voltage until the beads' fluorescence intensity fell within the predefined target range. Histogram profiles illustrating bead peak distributions before and after alignment are shown in Figure 9A. Whole-blood samples were then acquired on the test instrument before and after calibration. Prior to harmonization, TFpos-platelet percentages differed between the two platforms. Following bead-based alignment, values closely matched those obtained on the reference cytometer (Figure 9B), demonstrating successful cross-platform harmonization and reproducible TF quantification.
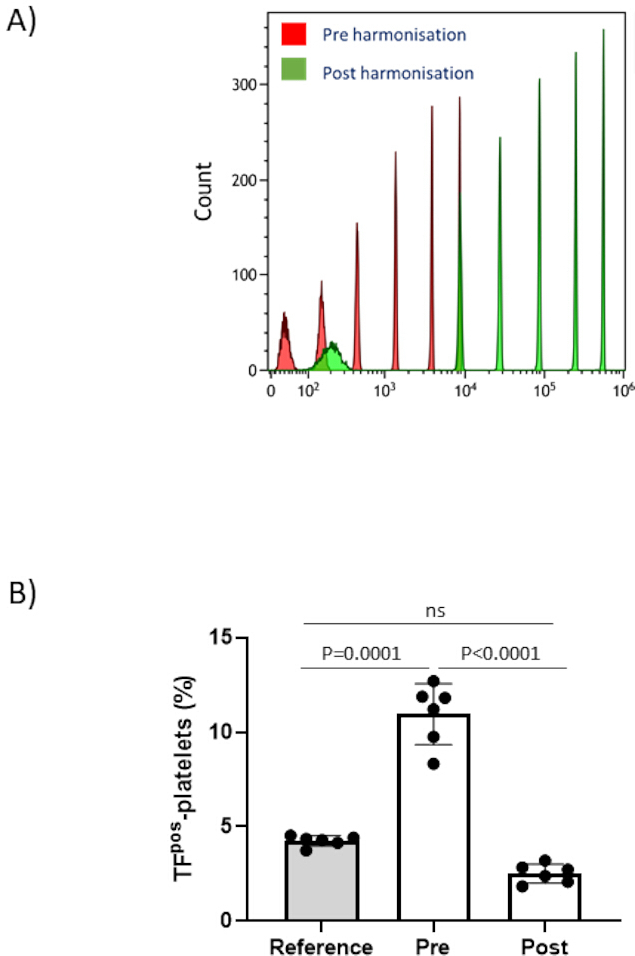
Figure 9: Bead-based instrument harmonization. (A) Representative fluorescence histogram of 6-peak Rainbow calibration beads acquired before (red peaks) and after (green peaks) instrument alignment. (B) Percentages of TFpos-platelets measured in resting samples prepared from n=6 healthy subjects acquired on the test instrument before (Pre) and after (Post) harmonization. Measurements obtained on the reference instrument are shown for comparison. Data were analyzed by a paired t-test. Please click here to view a larger version of this figure.
Discussion
This protocol provides a step-by-step workflow for whole-blood flow cytometry quantification of TFpos-platelets, specifically designed for a multicenter implementation. Its main methodological advantage over conventional workflows based on platelet flow cytometry analysis is that it standardizes the entire analytical process, from blood collection and whole-blood fixation to sample labeling, instrument harmonization prior to sample acquisition, and centralized analysis and data quality control. This allows centers without the capability to sample processing to participate in multicenter studies, if they can provide blood samples. The present workflow addresses the practical sources of between-center variability that are most relevant, considering that only a minor proportion of platelets exhibits detectable surface-associated TF under physiological conditions7,8. These sources include differences in local sample handling, access to flow cytometry facilities, instrument configuration, and operator-dependent data analysis.
To overcome these issues, whole blood is fixed shortly after collection, stabilizing the in vivo platelet phenotype and avoiding the need for immediate labeling and sample acquisition. Representative results indicate that this fixed-sample approach allows for delayed centralized processing within the validated post-fixation interval. This expands the potential for study participation to centers without on-site flow cytometry facilities, while maintaining a consistent pre-analytical workflow. A second advantage of the protocol is the use of a simplified direct staining strategy with a simple two-color panel, which reduces the complexity of the procedure.
In the panel, we used the well-characterized anti-TF monoclonal antibody clone HTF1, which recognizes the catalytic site of TF and competes with factor VII binding, making it one of the most reliable reagents available for TF detection, also in platelets14,16,17. The antibody was conjugated to Star Fluor 488, a bright, photostable fluorochrome spectrally similar to FITC but with improved signal stability. Importantly, excitation at 488 nm allows sample detection with the blue laser configuration available on virtually all conventional flow cytometers, including entry-level instruments. This combination of epitope specificity and straightforward fluorochrome detection improves analytical sensitivity and scalability across multiple sites. In this assay, positivity thresholds were defined using unstained and FMO controls as a better option compared to the isotype control for threshold placement in low-frequency populations18.
The use of different flow cytometers may represent a source of variability in multicenter flow cytometry studies19,20,21. We have previously provided advice on pre-analytical handling, staining set up and local instrument optimization17. But these measures do not ensure consistent fluorescence signals across different platforms. The present workflow addresses this issue by combining centralized analysis with prospective acquisition harmonization. Shared acquisition templates can be used when identical cytometers are available, whereas bead-based alignment can be applied when different platforms must be included. This dual strategy offers a practical advantage over multicenter analytical models that rely solely on centralized analysis after heterogeneous local acquisition by reducing the variability of data analysis ab initio and supporting more reproducible gate application across sites.
The generalizability of the workflow should not be overstated. The protocol was validated using specified whole-blood fixation conditions, the anti-TF-Star Fluor 488 and anti-CD41 PerCP-Cy5.5 reagent combination, harmonization procedures, and a limited set of flow cytometer configurations. If other anti-TF clones, fluorochrome combinations, fixation timings, or fixative concentrations, or flow cytometers with substantially different optics are used, the analytical performance of the workflow should be checked. Overall, any protocol failures should be managed through the suggested predefined deviation rules. Depending on the severity of the deviation, data may be flagged, repeated, or excluded according to the study-specific deviation plan. Within these boundaries, the present protocol should be considered as an operational framework for multicenter implementation of TFpos-platelet analysis. Formal analytical validation, including broader inter-laboratory performance assessment, shipment validation, and assay repeatability, is currently being addressed in a dedicated international standardization study from the International Society of Thrombosis and Hemostasis. The clinical relevance of accurate TFpos-platelet quantification is underscored by evidence demonstrating its prognostic value in coronary artery disease, where levels of TFpos-platelets exceeding 4% independently predict long-term cardiovascular mortality at five-year follow-up16. Reliable multicenter measurement is therefore essential for validating TFpos-platelets as a biomarker and for extending its application to prospective clinical trials and real-world registries. Future implementation of automated normalization algorithms and autogating strategies may further reduce operator bias and support decentralized analysis while maintaining cross-site comparability22,23.
In conclusion this harmonized workflow provides a practical and reproducible approach for the quantification of TFpos-platelets by whole-blood flow cytometry in multicenter settings. By combining standardized pre-analytical procedures, simplified sample processing, and instrument harmonization strategies, the protocol enables reliable cross-site comparison of TFpos-platelets measurements. Beyond supporting the assessment of TFpos-platelets as a biomarker of thrombotic risk, the principles described here may contribute to broader efforts to standardize platelet flow cytometry for translational and clinical research applications.
Disclosures
The Authors declare no conflict of interest. Figure 1 was created using ChatGPT (OpenAI). All AI-generated content was critically reviewed and edited by the authors. AI use was limited to Figure 1 preparation and did not involve data generation, analysis, or interpretation.
Acknowledgements
This study was supported by research funding from the Italian Ministry of Health, Ricerca Corrente to Centro Cardiologico Monzino IRCCS and by funds from the University of Milan - Piano di Sostegno alla Ricerca 2025-Linea 2 (to M.C.).
Materials
| Name | Company | Catalog Number | Comments |
|---|---|---|---|
| 1X PBS w/o Calcium and Magnesium | Gibco | 10010-015 | For antibodies and sample dilution |
| Anti-CD41 PerCP-Cy5.5 (clone HIP8) | BD | 333148 | Anti human CD41a monoclonal antibody used as platelet population marker; should be provided by the Core Laboratory |
| Anti-TF Star Fluor 488 (clone HTF1) | Cyanagen | CR304 | Anti human Tissue Factor (CD142) monoclonal antibody; should be provided by the Core Laboratory |
| BD FACSLyric Flow Cytometer | BD | non catalog item | In the text, Flow Cytometer B |
| BD FACSuite software v1.6 | BD | non catalog item | In the text, software B |
| Butterfly Needle G19 | PIKDARE | 02044019030010 | For blood withdrawal |
| CytExpert Software | Beckman Coulter | non catalog item | In the text, software A |
| CytoFLEX S flow cytometer | Beckman Coulter | non catalog item | In the text, Flow Cytometer A |
| MACSQuant Flow Cytometer | Miltenyi Biotec | non catalog item | In the text, Flow Cytometer C |
| MACSQuantify software v3.1 | Miltenyi Biotec | non catalog item | In the text, software C |
| Eppendorf tubes 2 mL | Eppendorf | 120094 | For whole blood fixation |
| Paraformaldehyde | Antibioticos – Divisione Carlo Erba Reagenti | 387507 | To fix samples |
| Pipet tips 10 µL | Gilson | F161630 | To transfer blood samples |
| Pipet tips 1000 µL | Gilson | F161670 | To transfer blood samples |
| Pipet tips 200 µL | Gilson | F161930 | To transfer blood samples |
| Polystyrene Round-Bottom Tube 5 mL | Corning | 352052 | Needed for flow cytometer acquisition |
| Rainbow calibration beads (6 peaks) | Spherotech (BD) | 556286 | For flow cytometer harmonization |
| Vacutainer EDTA | BD | 368857 | To collect the first 3ml of blood |
| Vacutainer multiple sample luer adapter | BD | 367300 | For blood withdrawal |
| Vacutainer one use holder | BD | 364815 | For blood withdrawal |
| Vacutainer with 0,129 M sodium citrate | BD | 363079 | To collect blood |
References
- Siddiqui FA, Desai H, Amirkhosravi A, Amaya M, Francis JL. The presence and release of Tissue Factor from human platelets. Platelets. 2002;13:247–253
- Camera M et al. Platelet activation induces cell-surface immunoreactive Tissue Factor expression, which is modulated differently by antiplatelet drugs. Arterioscler. Thromb. Vasc. Biol. 2003;23:1690–1696
- Muller I et al. Intravascular Tissue Factor initiates coagulation via circulating microvesicles and platelets. FASEB J. 2003;17:476–478
- Schwertz H et al. Signal-dependent splicing of Tissue Factor pre-mRNA modulates the thrombogenicity of human platelets. J Exp. Med. 2006;203:2433–2440
- Panes O et al. Human platelets synthesize and express functional Tissue Factor. Blood. 2007;109:5242–5250
- Brambilla M et al. Human megakaryocytes confer Tissue Factor to a subset of shed platelets to stimulate thrombin generation. Thromb. Haemost. 2015;114:579–592
- Brambilla M et al. Cell surface platelet Tissue Factor expression: Regulation by P2Y12 and link to residual platelet reactivity. Arterioscler. Thromb. Vasc. Biol. 2023;43:2042–2057
- Brambilla M et al. Do methodological differences account for the current controversy on Tissue Factor expression in platelets? Platelets. 2018;29:406–414
- Brambilla M et al. Tissue Factor in patients with acute coronary syndromes: expression in platelets, leukocytes, and platelet-leukocyte aggregates. Arterioscler. Thromb. Vasc. Biol. 2008;28:947–953
- Tilley RE, Holscher T, Belani R, Nieva J, Mackman N. Tissue Factor activity is increased in a combined platelet and microparticle sample from cancer patients. Thromb Res. 2008;122:604–609
- Gerrits AJ, Koekman CA, van Haeften TW, Akkerman JW. Platelet Tissue Factor synthesis in type 2 diabetic patients is resistant to inhibition by insulin. Diabetes. 2010;59:1487–1495
- Manfredi AA et al. Anti-TNFalpha agents curb platelet activation in patients with rheumatoid arthritis. Ann Rheum Dis. 2016;75:1511–1520
- Canzano P et al. Platelet and endothelial activation as potential mechanisms behind the thrombotic complications of Covid-19 patients. JACC Basic Transl Sci. 2021;6:202–218
- Trabattoni D et al. Migraine in patients undergoing PFO closure: Characterization of a platelet-associated pathophysiological mechanism: The LEARNER study. JACC Basic Transl Sci. 2022;7:525–540
- Camera M et al. Mechanisms sensitive to different drugs mediate a pro-adhesive and pro-thrombotic platelet phenotype in antiphospholipid syndrome. Haematologica. 2026;111:219–229
- Camera M et al. Tissue Factor, a membrane-associated marker of platelet activation, predicts 5-year cardiovascular mortality in coronary artery disease patients. Thromb Haemost. 2025. TH-25-08-0472. Online ahead of print.
- Brambilla M, Becchetti A, Nallio K, Camera M. Flow cytometry analysis of Tissue Factor expression in human platelets. J Vis Exp. 2024; 22;(213).
- Aass HC et al.. Fluorescent particles in the antibody solution result in false TF- and CD14-positive microparticles in flow cytometric analysis. Cytometry A. 2011;79:990–999
- Kalina T. Reproducibility of flow cytometry through standardization: Opportunities and challenges. Cytometry A. 2020;97:137–147
- Westera L et al. Centrally determined standardization of flow cytometry methods reduces interlaboratory variation in a prospective multicenter study. Clin Transl Gastroenterol. 2017;8:e126
- Le Lann L et al. Standardization procedure for flow cytometry data harmonization in prospective multicenter studies. Sci Rep. 2020;10:11567
- Monaco G et al. Flowai: Automatic and interactive anomaly discerning tools for flow cytometry data. Bioinformatics. 2016;32:2473–2480
- Montante S, Brinkman RR. Flow cytometry data analysis: Recent tools and algorithms. Int J Lab Hematol. 2019;41 Suppl 1:56–62
Reprints and Permissions
This article has been published
Video Coming Soon