This protocol presents a reliable and reproducible protocol for designing, preparing, and evaluating an electrocatalyst for the hydrogen evolution reaction (HER). It enables undergraduate, postgraduate, and Ph.D. students to connect synthetic chemistry, electrode fabrication, and the application of electrode fabrication in catalytic electrochemical hydrogen production in a neutral aqueous medium.
Method Article
Thiocarbohydrazone-Derived Metal-Free Electrocatalyst for Hydrogen Evolution In An Aqueous Medium
In This Article
Summary
Abstract
Most electrocatalysts reported for the hydrogen evolution reaction (HER) are based on transition-metal composites, nanoparticles, metal–organic frameworks, alloys, sulfides, and metal–nitrogen–carbon frameworks. These materials often require harsh synthetic conditions and generally perform optimally in acidic or alkaline media. In contrast, organic electrocatalysts for HER are relatively rare and are predominantly reported to function under acidic conditions. Thiocarbohydrazones (TCHs) constitute an important class of compounds with applications in coordination and bioinorganic chemistry. The presence of proton-donating and proton-accepting sites, such as NH, SH, and C=N groups, enables them to act as proton relays. Consequently, TCH derivatives can be considered promising candidates for electrocatalytic hydrogen evolution. This work reports the three-step synthesis and characterization of a thiocarbohydrazone derivative, P3. The synthetic procedure is straightforward, affords high yields, and does not require expensive reagents, making it well-suited for educational demonstrations. All compounds were characterized by 1H-NMR, HRMS, UV-Visible, fluorescence, and FTIR spectroscopy. The HER activity of P3 was evaluated by immobilizing it on a 3 mm glassy carbon electrode (GCE) at a loading of 0.4 mgcm⁻2 using perfluorosulfonic acid ionomer binder. Electrochemical measurements were carried out in 100 mM phosphate buffer (pH 7.4) using an Ag/AgCl reference electrode. Linear sweep voltammetry of the P3-modified GCE displayed a pronounced cathodic response at −1.5 V, corresponding to hydrogen evolution, which was confirmed by gas chromatographic analysis. Chronoamperometric measurements performed for more than 2 h showed a stable current response, confirming the stability of P3 on the GCE surface. These results demonstrate the potential of organic thiocarbohydrazone derivatives as promising electrocatalysts for HER in a neutral aqueous medium.
Introduction
The continuous growth in global energy demand has intensified the need for sustainable, renewable energy technologies to reduce dependence on fossil fuels and mitigate their environmental impact1. Consequently, significant research efforts are being directed toward the development of environmentally benign energy sources and efficient energy storage technologies2,3. Among the various alternatives, hydrogen (H₂) has emerged as one of the most promising sustainable energy sources due to its high energy density and pollution-free combustion, which produces only water as a by-product4,5. Hydrogen can be generated through electrocatalytic or photocatalytic processes, both of which require efficient catalysts to lower activation barriers and enhance the overall rate of hydrogen production6.
Nature provides an excellent blueprint for hydrogen evolution catalysis via hydrogenase enzymes, which contain either [NiFe] or [FeFe] active sites; [FeFe]-hydrogenases exhibit exceptional catalytic activity for the hydrogen evolution reaction (HER) at remarkably low overpotentials7,8,9. Structural studies based on X-ray crystallography have provided valuable insights into the origin of this high catalytic efficiency under ambient conditions10,11. It has been established that the diiron active site is connected to a 4Fe-4S cluster through a cysteine thiolate bridge. During H₂ generation, the 4Fe-4S cluster serves both as an electron reservoir and as a source of electrons required for catalysis. Furthermore, the dithiolate bridge linking the two iron centers contains an amine functionality that promotes rapid proton-coupled electron transfer (PCET)7,8,9, resulting in high turnover frequencies ranging from 6000–21,000 s⁻1. Inspired by these structural and functional features, numerous synthetic mimics of the hydrogenase active site have been developed following the elucidation of the H-cluster structure12,13,14. The importance of proton relays in facilitating efficient HER has also been demonstrated in several synthetic molecular catalysts. DuBois and co-workers15 established the critical role of pendant amine groups in achieving high catalytic turnover frequencies in a family of Ni(II)-based HER catalysts. Similarly, Sakai and co-workers16 reported that the [Ni(dcpdt)2]2⁻ catalyst contains four nitrogen donor atoms that function as proton relay sites, lowering the HER overpotential to 330–400 mV at pH 4–6. These proton-relay functionalities complement electron-storage features in a manner analogous to the proton-transfer and electron-reservoir components found in hydrogenase enzymes10,11. These studies have demonstrated that HER overpotentials can be systematically lowered by modulating PCET-driven ligand reduction potentials in a series of Ni(II) complexes17.
Most HER electrocatalysts reported to date are based on noble metals such as platinum, palladium, ruthenium, rhodium, and iridium, as well as non-noble transition metals possessing favorable hydrogen adsorption energies. These catalysts have been developed in various forms, including nanoparticles, alloys, metal–organic frameworks, composites, selenides, nitrides, carbides, sulfides, phosphides, and metal–nitrogen–carbon materials18,19,20. Although many of these systems exhibit excellent electrocatalytic activity, their widespread application is often limited by high cost, complex synthetic procedures, and restricted operational stability. Moreover, their performance is generally optimized in strongly acidic or alkaline media, whereas HER under neutral conditions remains comparatively less explored. These limitations have stimulated interest in the development of metal-free organic electrocatalysts, which offer advantages such as structural tunability, mild synthetic procedures, lower cost, and environmental compatibility.
Among metal-free systems, organic hydrides have attracted considerable attention as potential electrocatalysts for hydrogen generation. It has been proposed that hydrogen atoms capable of exhibiting hydride-donor character under suitable conditions may facilitate HER through heterogeneous pathways. Natural redox processes frequently employ organic hydride donors such as flavin adenine dinucleotide (FADH₂) and nicotinamide adenine dinucleotide phosphate (NADPH)21, providing inspiration for the development of metal-free HER catalysts. More recently, frustrated Lewis pairs comprising sterically hindered proton and hydride acceptors have emerged as a new class of organic systems capable of activating hydrogen22.
Several classes of metal-free organic materials have been investigated for HER, including an organic hydride of 4,4′-dihydropyridine-1,1′-(2,6-dimethyl-1,4-dihydropyridine-3,5-diyl)bis(ethan-1-one)23, hydrogen-bonded organic frameworks (HOFs)24,25 and covalent organic frameworks (COFs)26. In addition, a variety of small organic molecules, such as benzothiadiazole27, benzodithiazole-caffeine28, benzoselenonates29, 9-phenyl-10-methylacridinium iodide30, 2,4,6-triphenylpyridine derivatives31, phosphorus-based corrole complexes32, 2,2′-bipyridyl33, 4,4′-bipyridyl34, phenanthroline35, and bis-imidazolium-embedded heterohelicene36 have been explored as homogeneous HER catalysts. While these systems demonstrate catalytic activity under acidic or basic conditions, reports of immobilized metal-free organic electrocatalysts operating efficiently in neutral aqueous media without the addition of external acids or bases remain scarce.
The design of new organic electrocatalysts can benefit from structure-activity relationships established for existing HER systems, particularly regarding the presence of protonatable and deprotonatable functional groups that facilitate proton transfer and PCET processes. Thiocarbohydrazide (TCH), thiosemicarbazide (TSC), and their derivatives represent a promising class of compounds in this context (Figure 1).
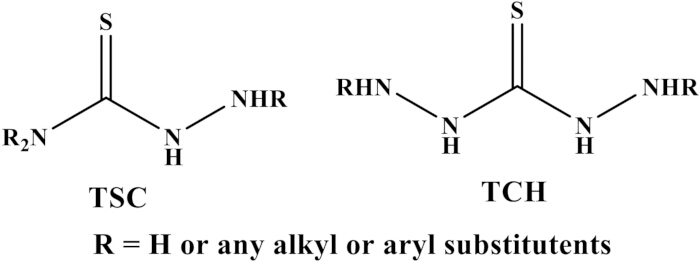
Figure 1: Basic structures of thiosemicarbazone (TSC) and thiocarbohydrazone (TCH). Representative structures of TSC and TCH frameworks showing schematic sites for protonation and deprotonation. Please click here to view a larger version of this figure.
These molecules contain, C=N, S-H and multiple N-H functionalities that can participate in proton-transfer reactions and proton-relay mechanisms17,37. Furthermore, the free amino groups present in TCH and TSC enable facile structural modification, allowing the introduction of additional proton-donating and proton-accepting sites. Such modifications may influence ligand-centered reduction processes and provide a means to tune HER overpotentials.
To date, TSC-based complexes of Co(II), Ni(II), Cu(II), Zn(II), and Pd(II) have been investigated as HER catalysts primarily in non-aqueous media and generally require the addition of external acids or bases38,39,40,41,42. In contrast, studies exploring metal-free thiocarbohydrazone derivatives as electrocatalysts for HER under neutral aqueous conditions, particularly in immobilized form, remain largely unexplored.
In the present work, the synthesis and characterization of the thiocarbohydrazone derivative P3 are reported. The intrinsic electrochemical behavior of P3 was investigated using cyclic and linear sweep voltammetry, revealing distinct redox processes. To evaluate its catalytic potential toward HER, P3 was immobilized in a perfluorosulfonic acid ionomer binder and deposited onto a glassy carbon electrode surface to enable heterogeneous electrocatalysis under neutral aqueous conditions. The observed catalytic activity and stability of P3 in the absence of an external proton source demonstrate the potential of thiocarbohydrazone derivatives as a promising class of metal-free organic electrocatalysts for hydrogen evolution.
Protocol
1. Synthesis of thiocarbohydrazone derivative P3
- Perform the synthesis of thiocarbohydrazone derivative P3 in a laboratory safety hood. Arrange the experimental setup as shown in Figure 2.
- Synthesis of (E)-N′-(pyridine-2-ylmethylene) hydrazinecarbothiohydrazide (P1)
- Weigh about 100.00 mg thiocarbohydrazide in a clean 50 mL beaker and dissolve it in 10 mL of distilled ethanol.
- Weigh 100.90 mg 2-pyridyl carboxaldehyde, transfer it to a 100 mL round-bottom flask, and dissolve it completely in 5 mL of distilled ethanol.
- Add one drop of concentrated hydrochloric acid to the above ethanolic solution and stir it for one min using a magnetic stir bar.
- Carefully add the previously prepared ethanolic solution of thiocarbohydrazide to the solution prepared in step 1.2.3 using a glass dropper and reflux the reaction mixture for 3 h in an oil bath. Cool it to room temperature.
- Filter the pale-yellow solid obtained through qualitative filter paper, Grade 1, wash twice with 5–7 mL distilled ethanol and once with diethyl ether. Recrystallize the crude product from methanol and dry under vacuum. Yield: 90%
- Synthesis of (E)-N′-((E)-2-hydroxybenzylidene)-2-(pyridine-2-ylmethylene) hydrazine-1-carbothiohydrazide (P2)
- Weigh about 100.00 mg of the recrystallized dry P1 in a clean 50 mL beaker and dissolve it in 10 mL of distilled ethanol.
- Take 62.50 mg salicylaldehyde in a 100 mL round-bottom flask equipped with a stir bar and dissolve it in 5 mL of distilled ethanol with continuous stirring on a magnetic stirrer.
- Add one drop of concentrated hydrochloric acid to the solution in a round-bottom flask and stir it for 1 min.
- Carefully add the solution of P1 to the acidified solution of salicylaldehyde in the round-bottom flask using a glass dropper and reflux the reaction mixture for 3 h.
- Separate the lemon-yellow precipitate from the reaction mixture by filtration through qualitative filter paper, Grade 1. Wash the precipitate twice with 5–7 mL of distilled ethanol and once with diethyl ether. Recrystallize the crude product from methanol and dry under vacuum. Yield: 80%
- Synthesis of (E)-N′-((E)-2-((4-nitrobenzyl)oxy)benzylidene)-2-(pyridine-2-ylmethylene) hydrazine-1-carbothiohydrazide (P3)
- Weigh 100.00 mg of the recrystallized, dry P2 and dissolve it in 50 mL dry acetone. Add 46.15 mg potassium carbonate to it and stir the solution for 10 min at room temperature.
- Subsequently, add 25.00 mg sodium iodide to the above stirring solution, followed by 72.15 mg p-nitrobenzyl bromide (PNB).
- Reflux the above reaction mixture for 4 h. Bring it to room temperature, then filter the reaction mixture to remove the potassium carbonate precipitate. Collect the filtrate in a round-bottom flask and concentrate under reduced pressure to obtain crude P3.
- Purify the crude product by column chromatography using silica gel as a stationary phase and n-hexane:ethyl acetate (1:1; v/v) as a mobile phase. Collect 10 mL fractions eluted from the column into 15 mL test tubes.
- Concentrate the solution from each test tube to approximately 2 mL and place a small drop from each test tube on a precoated silica gel plate with a capillary, along with the spots of P2 and PNB (Figure 3). After spotting, carefully place the TLC plate in a TLC chamber containing n-hexane/ethyl acetate (1:1, v/v) as the mobile phase, holding it with tweezers. Cover the chamber. Allow the solvent to rise to three-quarters of the height of the TLC plate. Mark the solvent front with a pencil, dry the plate with a hot-air gun, and visualize under the UV visualization chamber.
- Combine all the fractions containing only the product and concentrate under vacuum to obtain a pale-yellow pure product. Yield: 70%.
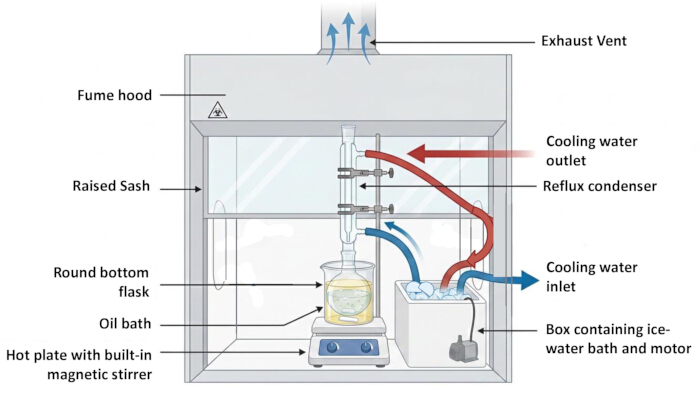
Figure 2: Reaction setup in a safety hood. Schematic representation of the reaction arrangement inside a safety hood used for synthetic reactions. Please click here to view a larger version of this figure.
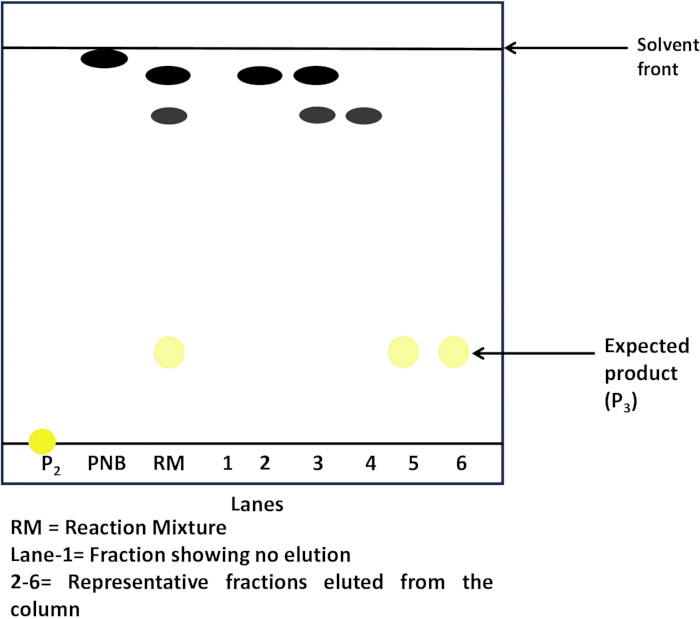
Figure 3: Illustration of a TLC plate. Schematic representation of a TLC plate showing the separation of P3 from impurities formed during the reaction. Please click here to view a larger version of this figure.
2. Investigating solution-state electrochemical behavior of P3 in dry DMSO solvent
- For electrochemical measurements, keep the following items ready as suggested.
- A clean glassy carbon electrode as a working electrode, Ag/AgCl as the reference electrode, platinum wire as the counter electrode, and O-rings to hold electrodes.
- An electrochemical cell with a fitting lid having holes for holding electrodes and purging with N2 gas. Fix the cell to a stand with a clamp.
- A nitrogen cylinder with a regulator, glass dropper, and silicone tubing.
- Prepare a potentiostat and connecting wires with crocodile clips.
- A supporting electrolyte solution
- Weigh 3.87 g of tetrabutylammonium hexafluoro phosphate (TBAPF6) and transfer it to a clean 100 mL volumetric flask with a stopper.
- Carefully add about 50 mL dry DMSO to this volumetric flask. Mix well to dissolve all particles of TBAPF6 and make the volume up to the mark to obtain a 0.1 M solution. Label this volumetric flask as 0.1 M TBAPF6 in dry DMSO and keep it aside.
- Solution of P3
- Weigh 4.34 mg P3 and transfer it to a 10 mL clean volumetric flask with a stopper.
- Add 0.1 M TBAPF6 in dry DMSO and make the volume up to the mark. This produces a 1 mM (i.e., 0.001 M) solution of P3.
- 100 mM (i.e., 0.1 M) phosphate buffer, pH 7.443
- Weigh 1.74 g K2HPO4 in a clean 50 mL beaker and add 10 mL deionized water (DIW) or 18.2 MΩ·cm water to it. Label this as ‘Solution A’.
- Weigh 1.36 g KH2PO4 in another clean 50 mL beaker and add 10 mL deionized water. Label this as ‘Solution B’.
- Using a 10 mL serological pipette, transfer 8 mL of ‘Solution A’ and 2 mL of ‘Solution B’ into a 100 mL clean volumetric flask and make the volume up to the mark with DI water. Use separate pipettes for each solution.
- Check the pH of this solution on a pH meter and adjust the pH to 7.4 with careful addition of either 0.1 M HCl or 0.1 M NaOH solution as required. Once the pH is adjusted to 7.4, the phosphate buffer (0.1 M) is ready for use.
- Cyclic voltammetric measurements
- Switch on the potentiostat and wait for 10 min to stabilize the instrument. Open the cyclic voltammetry (CV) program.
- Set the potential limits from +1.0 V to −1.5 V; start and end potentials to 0 V; scan rate to 50 mV/s, and number of cycles to four.
- Organize the electrochemical assembly as shown in Figure 4.
- Add 10 mL 0.1 M TBAPF6 in dry DMSO solution (electrolyte) to an electrochemical cell and purge with N2 for 15 min. Record the voltammogram of the electrolyte (blank) in the potential range of +1.0 to −1.5 V at a scan rate of 50 mV/s. Clean the electrochemical cell and dry it after use.
- Similarly, in the cleaned, dry electrochemical cell, take 1 mM P3 solution (10 mL), purge N2 for 15 min, and record the voltammogram using the same parameters as those used above.
- Record the voltammogram of P3 at each scan rate separately, i.e., at 20, 50, 100, 150, 200, and 250 mV/s.
- Calculate the Epa, ipa and ipc for NO₂•–, as shown in equation (1), for each scan rate and prepare a table as shown in Table 1.
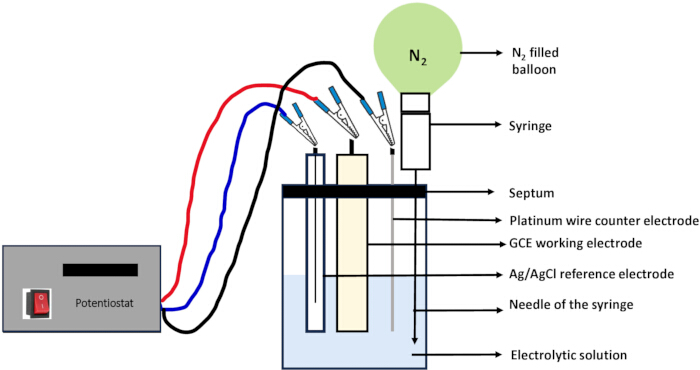
Figure 4: Electrochemical setup. Schematic illustration of a three-electrode system showing the potentiostat connections, nitrogen purging, and electrode arrangement. Please click here to view a larger version of this figure.
| Scan Rate (mV/s) | (scan rate)1/2 (υ1/2) | Epa (V) | Epc (V) | ipc (μA) | ipa (μA) |
| 20 | 4.47 | −1.13 | −1.23 | −0.4 | 0.45 |
| 50 | 7.07 | −1.13 | −1.23 | −0.59 | 0.72 |
| 100 | 10 | −1.13 | −1.23 | −0.81 | 1 |
| 150 | 12.24 | −1.13 | −1.23 | −0.99 | 1.24 |
| 200 | 14.14 | −1.12 | −1.24 | −1.13 | 1.38 |
| 250 | 15.81 | −1.12 | −1.24 | −1.28 | 1.62 |
Table 1: Peak potential and current values of P3 at different scan rates in dry DMSO solution. Epa, Epc, ipa and ipc values obtained from cyclic voltammogram of P3 in 0.1 M TBAPF6 in dry DMSO recorded at different scan rates.
3. Preparation of P3 modified glassy carbon electrode
- Weigh 1.00 mg P3 in a glass vial. Add 500 µL of DMSO/acetonitrile (1:1, v/v) to it. Gently heat the vial to obtain a clear solution. Only 10 µL of this solution is required for loading on the glassy carbon electrode (GCE).
- Polish a 3 mm glassy carbon electrode44. Place two drops of alumina paste on a polishing pad and trace a figure-of-eight motion on the pad for 1 min while firmly holding the electrode. Wipe the paste after polishing. Rinse it thoroughly with distilled water and dry it with a clean, lint-free tissue.
- First, carefully place 3 µL of P3 on the 3 mm area of GCE. Dry it with a hot-air gun. After drying the first layer, place 3 µL on top and dry with a hot-air gun. Repeat this one more time by adding 4 µL of P3 solution and drying with a hot-air gun.
- Then place 4 µL perfluorosulfonic acid ionomer binder (1%) solution on it. Allow the ionomer layer to dry at room temperature; the electrode is then ready for use.
4. Electrochemical hydrogen evolution studies using linear sweep voltammetry
- Open linear sweep voltammetry (LSV) program. In the LSV parameters, enter the start and end potentials as 0 and −1.5 V, respectively, and set the scan rate to 100 mV/s.
- Fill the electrolytic cell with 10 mL 0.1 M phosphate buffer (pH 7.4) and connect all three electrodes to the potentiostat using crocodile clips.
- Use P3-modified GCE, i.e., P3-GCE, as a working electrode; platinum wire as a counter electrode, and Ag/AgCl as a reference electrode.
- After connecting the electrodes, purge N2 for 15 min. Then seal the electrolytic cell using PTFE tape. Record a linear sweep voltammogram.
5. Stability and durability test of P3-GCE using chronoamperometry
- Open chronoamperometry program. Set the applied potential to −1.22 V (vs Ag/AgCl) and the time to 2 h.
- Use the same electrochemical setup for LSV measurements. Click the Start Measurement, and the measurement will stop automatically after 2 h.
Results
P3 was synthesized using a three-step procedure. In the first step, the reaction of TCH with 2-pyridyl carboxaldehyde in a 1:1 molar ratio gave compound P1 (Supplementary Figure 1). In the second step, the reaction between P1 and salicylaldehyde gave P2. Finally, the reaction of P2 with p-nitrobenzyl bromide yielded compound P3. Both P1 and P2 were purified by recrystallization from methanol and dried before proceeding to the next steps in synthesis. The final product, P3, was purified by column chromatography as described in the protocol section. After purification, P1, P2, and P3 were characterized by 1H-NMR (Supplementary Figure 2, Supplementary Figure 3, Supplementary Figure 4), FTIR (Supplementary Figure 5, Supplementary Figure 6, Supplementary Figure 7), HRMS (Supplementary Figure 8, Supplementary Figure 9, Supplementary Figure 10), UV-visible spectroscopy (Supplementary Figure 11), powder X-ray diffraction (Supplementary Figure 12), and field-emission scanning electron microscopy (FE-SEM, Supplementary Figure 13). 1H-NMR, FTIR, and HRMS are useful for identifying the compounds; details are provided in the Supplementary File 1. The PXRD of P3 showed sharp peaks between 2θ = 5° and 30°, indicating a crystalline nature, which was further confirmed by the FE-SEM image showing long crystalline needles. The crystallite size calculated using the Debye–Scherrer equation is 12.88 nm. The relatively small crystallite size of P3 is expected to expose more catalytically active sites, thereby facilitating charge transfer and enhancing interactions with the electrolyte. Furthermore, the porous morphology of P3 immobilized in a perfluorosulfonic acid ionomer binder provides a high surface area, promoting efficient proton adsorption, increasing the accessibility of active sites, and facilitating the release of generated H₂ gas from the electrode surface.
The inherent redox properties of P3 in solution were evaluated by cyclic voltammetry in dry DMSO containing 0.1 M TBAPF6 as the supporting electrolyte (Figure 5, Table 2) at a scan rate of 50 mV/s. The voltammogram of the electrolyte blank solution alone did not show any redox peaks (black line), whereas P3 (blue line) showed a redox couple with an anodic peak, A, appearing at Epa1 = −1.13 V and the corresponding cathodic peak, A’, at Epc = −1.23 V (Figure 5A). This redox couple is assigned to the reduction of the NO2 group in P3 to NO₂•⁻, as shown in equation (1)45,46,47,48 below. The peak-to-peak separation for this couple was calculated as ΔEp = Epa1 – Epc = 0.1 V, which is larger than 0.059 V, suggesting a quasi-reversible process49.
R - NO2 + e- → R - NO2- -------- (1)
| Epa (V) | Epc (V) | ΔE (V) | E1/2 (V) | |
| NO2/NO2.– | −1.13 | −1.23 | 0.1 | −1.18 |
| N-H | 0.8 | - | - | - |
Table 2: Peak potential values obtained from the cyclic voltammogram of P3 in dry DMSO solution. Peak potential values of P3 obtained from the cyclic voltammogram of the solution of P3 prepared in 0.1 M TBAPF6 as a supporting electrolyte in dry DMSO at a scan rate of 50 mV/s.
In addition an anodic peak at Epa2 = +0.80 V (denoted as B in Figure 5A) is attributed to the irreversible oxidation corresponding to proton-coupled electron transfer PCET, from the N–H in the thiocarbohydrazone moiety in P350,51,52. Further, the scan rate dependence of the NO2 redox couple (A/A’) and oxidation of TCH (B) was studied by scanning the CV at different scan rates between 50 mV/s and 250 mV/s (Figure 5B). From the plot of peak current (ipa and ipc) versus the square root of scan rate (ν1/2), the peak current for both the peaks varied linearly with the square root of the scan rate (Figure 5C,D), indicating the diffusion-controlled nature of both processes in P3.
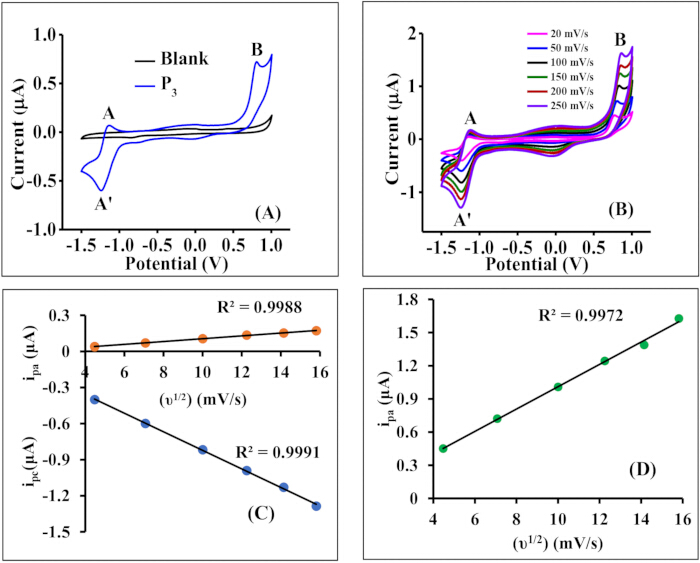
Figure 5: Electrochemical behavior of P3 in dry DMSO. (A) Cyclic voltammogram of 1 mM P3 recorded in 0.1 M TBAPF6 in dry DMSO at 50 mV/s scan rate; (B) Cyclic voltammogram of 1 mM P3 in 0.1 M TBAPF6 in dry DMSO at different scan rates; Plots of current vs. (ν1/2) for redox peaks (C) A–A’ and (D) B. Please click here to view a larger version of this figure.
P3 possesses several notable features that make it a candidate electrocatalyst for HER. It contains heteroatoms (N, O, and S), protonatable and deprotonatable basic pyridine nitrogen and -NH groups, a redox-active NO2 group, and several hydrogen-bond donor and acceptor functionalities. Since P3 is water-insoluble, the electrocatalytic behavior of P3 toward HER was evaluated in 0.1 M phosphate buffer (pH 7.4) and 0.1 M KNO3 (pH 7.2) in aqueous medium by immobilizing it on GCE using a perfluorosulfonic acid ionomer binder.
The quasi-reversible NO₂/NO₂•– redox couple, with ΔEp = +0.1 V vs Ag/AgCl electrode, is observed only in the solution-state cyclic voltammogram of P3 in dry DMSO. This couple is not observed in the solid-state voltammogram of P3 immobilized in a perfluorosulfonic acid ionomer binder (P3-GCE) in 0.1 M phosphate buffer at pH 7.4. In phosphate buffer, P3-GCE gives peak-to-peak separation of Epa = +0.277 V and Epc = −0.007 V, with a peak-to-peak separation of 0.284 V vs Ag/AgCl electrode. This is attributed to slow, heterogeneous electron-transfer kinetics, which require a larger overpotential to drive the redox process, indicating that the electron transfer is followed by a slow proton transfer that requires structural rearrangement. This is also seen in the Tafel slope (−370 mV/dec).
To gain further insight into the role of the NO₂ group in the proton-coupled electron transfer (PCET) process, the pH-dependent redox behavior of P3-GCE was investigated in phosphate buffer solutions over the pH range 5.0–9.0 (pH 5.0, 5.5, 6.0, 6.5, 7.0, 7.4, 8.0, 8.5, and 9.0). The corresponding Pourbaix diagram is presented in Figure 6. In the anodic region, a pH-independent one-electron oxidation process is observed at nearly constant potential, indicating that the oxidation is centered on the sulfur donor atoms of the thiocarbohydrazone framework53. In contrast, the reduction process exhibits a clear pH dependence. The slope of the first reduction peak potential versus pH plot is approximately +67 mV pH⁻1, which is close to the theoretical value expected for a one-electron/one-proton coupled process. This observation confirms that the reduction of P3 proceeds through a PCET mechanism involving the transfer of one electron and one proton. These results provide additional evidence for the participation of the NO₂ functionality in the electron-transfer process and further support the quasi-reversible redox behavior observed in the cyclic voltammetry studies.
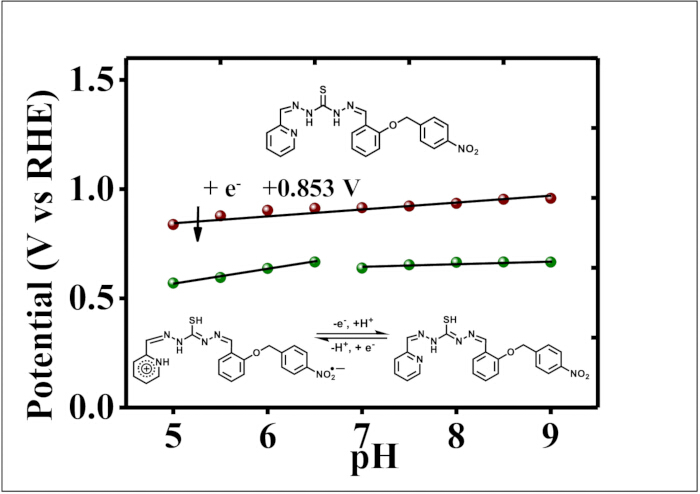
Figure 6: Pourbaix diagram of P3-GCE. Plots of the first oxidation and reduction potentials (vs RHE) of P3-GCE as a function of pH (Pourbaix diagram), where potentials were determined by observing cyclic voltammograms of P3-GCE in aqueous phosphate buffer solutions under various pH conditions (pH 5–9). Anodic potentials are presented as red circles with solid black lines, whereas cathodic potentials are presented as green circles with solid black lines. Please click here to view a larger version of this figure.
The linear sweep voltammograms (LSVs) of bare GCE, ionomer-coated GCE, and P3-GCE were recorded in 0.1 M phosphate buffer (pH 7.4) at 100 mV/s (Supplementary Figure 14). The LSVs of the bare GCE and perfluorosulfonic acid ionomer binder-coated GCE showed a linear response, whereas the P3-GCE showed a prominent cathodic current characteristic of HER. The onset potential (Figure 7A) for this cathodic current was −0.370 V (vs RHE), and an overpotential of −0.690 V (vs RHE) was required to reach a current density of 0.1 mA/cm2. The Tafel plot (Figure 7B) analysis yielded a slope of −370 mV/dec, indicating slow HER kinetics by P3-GCE at neutral pH 7.4. The band gap of 2.24 eV was calculated from the Tauc plot (Figure 7C).
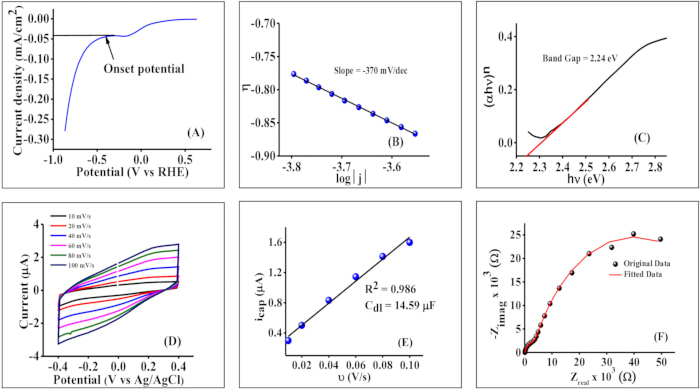
Figure 7: Electrocatalytic HER studies using P3-GCE in 0.1 M phosphate buffer of pH 7.4: (A) Linear sweep voltammogram of P3-GCE in 0.1 M phosphate buffer (pH 7.4) at a scan rate of 100 mV/s; (B) Tafel plot; (C) Tauc plot for estimation of optical band gap of P3; (D) Cyclic voltammogram of P3-GCE in non-Faradaic region (+0.4 to −0.4 V vs Ag/AgCl) at different scan rates; (E) Plot of capacitive current at 0 V (vs Ag/AgCl) versus scan rate, and (F) EIS Nyquist plot in 0.1 M phosphate buffer. Please click here to view a larger version of this figure.
The current is normalized to the geometric area of the working electrode (0.07 cm2) to compare the HER performance of P3-GCE in two different electrolytes. The double-layer capacitance (Cdl) was calculated from cyclic voltammograms recorded in the non-Faradaic region. The double-layer capacitance is directly proportional to the electrochemically active surface area for catalysis, and this is reflected in the Cdl values obtained in 0.1 M phosphate buffer (14.59 µF) and 0.1 M KNO3 in DIW (5.73 µF) (Figure 7D,E). The Cdl value in phosphate buffer is approximately 2.5 times that of 0.1 M KNO3 in DIW, as reflected in the ECSA. In addition, the electric double-layer enhances electrode–electrolyte interactions and may increase the availability of protons near the electrode surface.
The electrochemically active surface area of 0.029 cm2 was calculated assuming a specific capacitance of 35 µF/cm2, corresponding to six times the roughness of the bare electrode. The solution resistance and charge transfer resistance (Rct) of the catalyst film were calculated using electrochemical impedance spectroscopy (EIS). The EIS was fitted to a Nyquist plot (Figure 7F) using various equivalent circuit models, yielding a solution resistance of 113 Ω and Rct = 2492 Ω. These high values indicate, resistive nature of P3-GCE. The turnover frequency was 265.6 x 10⁻⁶ s-1, and an exchange current density of 986.5 x 10⁻⁶ A/cm2 was achieved at zero overpotential.
Additionally, the electrocatalytic behavior of P3-GCE was studied under identical conditions in an aqueous solution of 0.1 M KNO3 (pH 7.2) as an electrolyte (Figure 8A–F). Interestingly, in 0.1 M KNO3, P3-GCE produced a higher cathodic current for HER with an onset potential of −0.329 V (vs RHE; Figure 8A). An overpotential of −0.519 V (vs RHE) was required to reach a current density of 0.1 mA/cm2. The Tafel plot (Figure 8B) yielded a slope of −348 mV/dec. The charge transfer resistance, Rct, for this system was 5522.8 Ω, the turnover frequency was 409.6 (× 10−6) s-1, and the exchange current density was the same as that of the phosphate buffer.
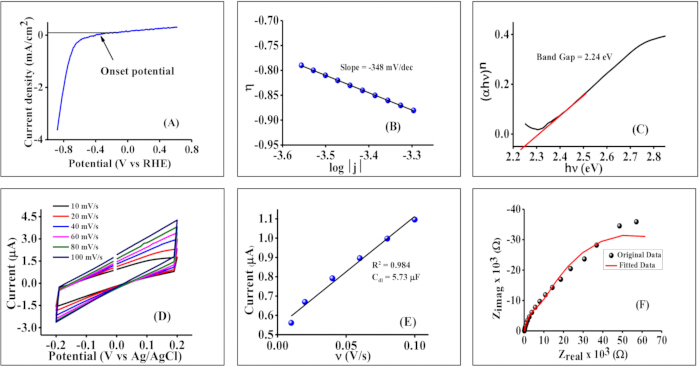
Figure 8: Electrocatalytic HER studies using P3-GCE in 0.1 M KNO3 in DIW: (A) Linear sweep voltammogram of P3-GCE in 0.1 M KNO3 in DIW at a scan rate of 100 mV/s; (B) Tafel plot; (C) Tauc plot for estimation of optical band gap of P3; (D) Cyclic voltammogram of P3-GCE in non-faradaic region (+0.2 to −0.2 V vs Ag/AgCl) at different scan rates; (E) Plot of capacitive current at 0 V (vs Ag/AgCl) versus scan rate, and (F) EIS Nyquist plot in 0.1 M KNO3. Please click here to view a larger version of this figure.
To study the stability of P3 film on the GCE surface, chronoamperometric measurements (Figure 9A) were carried out at −1.22 V (vs Ag/AgCl) for 2 h, and a stable current response was observed. In contrast, in the 0.1 M KNO3 solution, the cathodic current increased continuously up to 45 min and then began to decrease (Figure 9B), thereby limiting the measurement time to 1 h. The chronoamperometric measurements for the phosphate buffer system were also studied in short on-off catalytic cycles at 10 min intervals (Figure 9C), indicating a stable response of the catalyst.
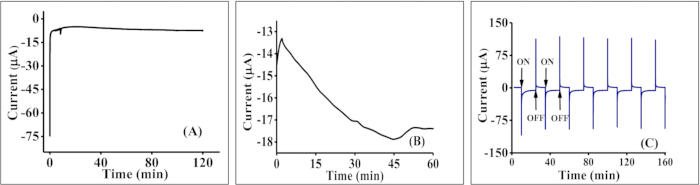
Figure 9: Stability and durability tests of P3-GCE. Chronoamperometry response of P3-GCE for 2 h at −1.22 V (vs Ag/AgCl) in (A) 0.1 M phosphate buffer (pH 7.4) and (B) 0.1 M KNO3. (C) Chronoamperometric recyclability response of P3-GCE at on- and off-potentials in 0.1 M phosphate buffer (pH 7.4) (on-potential = −1.22 V (vs Ag/AgCl), off-potential = 0 V (vs Ag/AgCl)). Please click here to view a larger version of this figure.
Gas chromatography (Figure 10A) analysis of the headspace after 2 h of chronoamperometry confirmed the presence of hydrogen, with a retention time matching that of the standard H2 gas sample analyzed under identical conditions. Bubble formation (Figure 10B) was noticed at the electrode-electrolyte interface during prolonged electrolysis. All electrochemical parameters for the performance of P3-GCE in both electrolyte systems are summarized in Table 3.
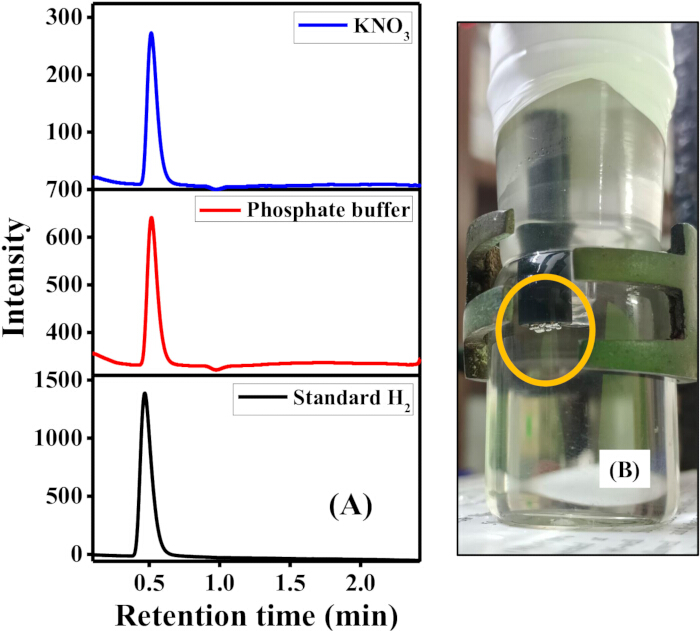
Figure 10: Detection of H2 formed by gas chromatography: (A) Gas chromatographic (GC) analysis of hydrogen generated during controlled potential electrolysis using P3-GCE in 0.1 M phosphate buffer and 0.1 M KNO3; (B) Image showing bubble formation at the P3-GCE electrode surface during chronoamperometric measurements. Please click here to view a larger version of this figure.
Supplementary Figure 1: Synthesis of P3. A scheme showing the steps involved in the synthesis of P3. Please click here to download this file.
Supplementary Figure 2: 1H-NMR spectrum of P1. 1H-NMR spectrum of P1 recorded in DMSO-d6 solvent. Please click here to download this file.
Supplementary Figure 3: 1H-NMR spectrum of P2. 1H-NMR spectrum of P2 recorded in DMSO-d6 solvent. Please click here to download this file.
Supplementary Figure 4: 1H-NMR spectrum of P3. 1H-NMR spectrum of P3 recorded in DMSO-d6 solvent. Please click here to download this file.
Supplementary Figure 5: Infrared spectrum of P1. FTIR spectrum of a finely powdered sample of P1. Please click here to download this file.
Supplementary Figure 6: Infrared spectrum of P2. FTIR spectrum of a finely powdered sample of P2. Please click here to download this file.
Supplementary Figure 7: Infrared spectrum of P3. FTIR spectrum of a finely powdered sample of P3. Please click here to download this file.
Supplementary Figure 8: HRMS spectrum of P1. HRMS spectrum of P1 recorded in positive ion mode showing m/z = 196.05 corresponding to [M+H]+ ion. Please click here to download this file.
Supplementary Figure 9: HRMS spectrum of P2. HRMS spectrum of P2 recorded in positive ion mode with m/z = 299.09 corresponding to [M+H]+ ion. Please click here to download this file.
Supplementary Figure 10: HRMS spectrum of P3. HRMS spectrum of P3 recorded in positive ion mode with m/z = 435.12 corresponding to [M+H]+ ion. Please click here to download this file.
Supplementary Figure 11: UV-visible spectra of P1, P2, and P3. UV-Visible spectra of P1 (black solid line), P2 (red line), and P3 (solid blue line) recorded at 10 µM concentration in neat DMSO. Please click here to download this file.
Supplementary Figure 12: Powder XRD pattern of P3. X-ray powder diffraction pattern of P3. Please click here to download this file.
Supplementary Figure 13: FE-SEM image of P3 and perfluorosulfonic acid ionomer binder-coated P3. FE-SEM images showing (A) Needle-like crystals of P3 (scale: 5 µm) and (B) perfluorosulfonic acid ionomer binder-coated P3 showing porous surface (scale: 1 µm). Please click here to download this file.
Supplementary Figure 14: LSV of P2 and P3 modified GCE. LSV of bare GCE (brown line with solid stars), GCE coated with perfluorosulfonic acid ionomer binder (green solid line), P2-GCE (blue line with crosses), and P3-GCE (red line with hollow squares) recorded in 0.1 M phosphate buffer (pH 7.4) at a scan rate of 100 mV/s. Please click here to download this file.
Supplementary Figure 15: Cyclic voltammogram of P3-GCE. Cyclic voltammogram of P3-GCE in (A) 0.1 M KNO3 in DIW and (B) 0.1 M phosphate buffer (pH 7.4) at a scan rate of 100 mV/s. Please click here to download this file.
Supplementary Figure 16: LSV profile of P3-GCE. LSV profile of P3-GCE in 0.1 M phosphate buffer (red line with hollow circles) and 0.1 M KNO3 (black solid line) in DIW at a scan rate of 100 mV/s. Please click here to download this file.
Supplementary Figure 17: Stability of P3-GCE. Performance of P3-GCE in 0.1 M phosphate buffer (pH 7.4) for 5 days. Please click here to download this file.
Supplementary File 1: Supplementary Experimental Details and Calculations. The details of the synthesis and instrumentation used for characterization of P1-P3; interpretation of HRMS, 1H-NMR, FTIR, UV-Visible spectra and electrochemical measurements along with the equations used for conversion of redox potential value from Ag/AgCl to RHE (eq. 1); overpotential (η, eq. 2); electrochemically active surface area (ECSA, eq. 3); turnover frequency (TOF, eq. 4 to 6); calculation of conductivity and film thickness (eq 7 to 10), Faradic efficiency (eq. 11-14) can be found in the supplementary file. Please click here to download this file.
Discussion
This protocol describes the three-step synthesis of a thiocarbohydrazone derivative, P3, and the preparation of a P3-modified glassy carbon electrode, P3-GCE, for investigating the hydrogen evolution reaction (HER) in a neutral aqueous medium. The straightforward synthesis and purification procedures, together with the use of readily available and inexpensive reagents, make P3 a suitable candidate for exploring HER in a typical laboratory setting and for educational demonstrations.
The electrochemical behavior of P3 was initially investigated under homogeneous conditions in DMSO to evaluate its intrinsic redox properties. The presence of a quasi-reversible redox couple associated with the nitro group and an irreversible oxidation process arising from the thiocarbohydrazone backbone indicates the existence of electroactive sites within P3. Catalytic studies were subsequently performed under heterogeneous conditions using P3-GCE. Electrochemical investigations were carried out in two electrolyte systems, namely 0.1 M phosphate buffer (pH 7.4) and 0.1 M KNO₃ (pH 7.2) (Supplementary Figure 15 and Supplementary Figure 16 ).
| S.No. | Parameters | Phosphate Buffer | KNO3 |
| 1 | Onset potential (vs RHE) (mV) | −376.3 | −329 |
| 2 | Overpotential (0.1 mA/cm2)(mV) | −690 | −519 |
| 3 | Tafel slope (mV/dec) | −370 | −348 |
| 4 | Exchange current density (mA/cm2) (X10-3) | 0.9865 | 0.9866 |
| 5 | Rct (Charge transfer resistance) (ohm) | 2492 | 5522.8 |
| 6 | Conductivity (x X10-4) | 9.85 | 4.43 |
| 7 | Band gap (eV) | 2.24 | |
| 8 | TOF (s-1) (X10-6) | 265.6 | 409.6 |
| 9 | ECSA (cm2) | 0.029 | 0.011 |
| 10 | Double layer capacitance (mF) (X10-3) | 14.59 | 5.73 |
| 11 | Faradaic efficiency (%) | 0.27 | 0.43 |
Table 3: Summary of electrochemical parameters of P3-GCE. Summary of all electrochemical parameters for the performance of P3-GCE in 0.1 M phosphate buffer (pH 7.4) and 0.1 M KNO3 electrolyte systems.
The electrochemical parameters presented in Table 3 reveal that the performance of P3-GCE is strongly influenced by the electrolyte medium. In 0.1 M KNO3, P3-GCE exhibits a lower onset potential (−329 mV vs. RHE) and a smaller overpotential (−519 mV at 0.1 mA/cm2) compared to those observed in 0.1 M phosphate buffer (−376.3 mV and -690 mV, respectively), indicating that hydrogen evolution is thermodynamically more favorable in the KNO₃ electrolyte. Furthermore, the slightly lower Tafel slope in KNO₃ (−348 mV/dec) relative to phosphate buffer (−370 mV/dec) suggests somewhat improved HER kinetics. The exchange current density values are nearly identical in both electrolytes (~0.99 × 10⁻³ mA/cm2), indicating similar intrinsic catalytic activity at the active sites. However, phosphate buffer exhibits significantly lower charge-transfer resistance (2492 Ω) and higher conductivity (9.85 × 10⁻⁴) than KNO₃ (5522.8 Ω and 4.43 × 10⁻4, respectively), demonstrating more efficient interfacial electron transport. This improved charge-transfer behavior is further supported by the larger electrochemically active surface area (0.029 cm2) and higher double-layer capacitance (14.59 µF) observed in phosphate buffer, suggesting greater accessibility of catalytic sites and enhanced electrode–electrolyte interaction. Despite the higher charge-transfer resistance in KNO₃, P3-GCE displays a higher turnover frequency (409.6 × 10⁻⁶ s-1) and Faradaic efficiency (0.43%) than in phosphate buffer (265.6 × 10⁻⁶ s-1 and 0.27%, respectively), indicating more efficient utilization of active sites for hydrogen generation once the reaction is initiated. These observations suggest that while phosphate buffer promotes favorable electrode kinetics and charge transfer, KNO3 is more effective at facilitating hydrogen evolution on the P3-GCE under the conditions investigated.
The electrocatalytic behavior of P3 was first examined in phosphate buffer. Analysis of the linear sweep voltammetry (LSV) profile revealed lower hydrogen generation than that of many organic electrocatalysts reported in the literature (Table 4). However, most reported organic electrocatalysts have been evaluated in homogeneous, non-aqueous media, whereas P3-GCE operates as a heterogeneous catalyst in a neutral aqueous environment. Furthermore, many reported organic electrocatalysts are sacrificial in nature23,24,25,26,27,28,29,30,31,32,33,34,35,36,37,38,39,40,41,42, which is a significant limitation. In contrast, P3-GCE exhibited excellent stability and reusability. Once prepared, the electrode delivered a consistent response in 0.1 M phosphate buffer over five days when used for at least 5 h each day (Supplementary Figure 17). Although the response of P3-GCE in 0.1 M KNO₃ was less stable, the current density was higher than that observed in phosphate buffer, reflecting the influence of electrolyte composition on catalytic performance.
| Sr. No. | Material | Type | Solvent | Acid/ Base used | Current range | Catalysis Mode | Reference | |
| 1 | Organic hydride (dihydropyridine) | Organic | Acetonitrile | CH3COOH, CF3COOH | μA | Homogeneous | 23 | |
| 2 | Benzothiadiazole (BTDN) | Organic | Acetonitrile | salicylic acid | μA | Homogeneous | 27 | |
| 3 | Benzothiadiazole–caffeine (BT-DCAF) | Organic | DMSO | CF3COOH | μA | Homogeneous | 28 | |
| 4 | 9-phenyl-10-methylacridinium iodide | Organic | Acetonitrile | HClO4 | μA | Homogeneous | 30 | |
| 5 | 2,4,6-Triphenylpyridine | Organic | Acetonitrile | CH3COOH | μA | Homogeneous | 31 | |
| 6 | Phosphorus corrole | Organic (non-metallic complex) | DMF | TFA | μA | Homogeneous | 32 | |
| 7 | 2,2`-Bypyridyine | Organic | Acetonitrile | CH3COOH | μA | Homogeneous | 33 | |
| 8 | 4,4`-Bypyridyine | Organic | Acetonitrile | HBF4, HClO4, TsOH, CF3COOH | μA | Homogenous | 34 | |
| 9 | 1,10-Phenanthroline | Organic | Acetonitrile | HClO4, CF3COOH | μA | Homogeneous | 35 | |
| 10 | Bis-imidazolium-embedded heterohelicene | Organic | Acetonitrile | CH3COOH | μA | Homogeneous | 36 | |
| 11 | P3-GCE | Organic | i) 0.1 M Phosphate buffer ii) 0.1 M KNO3 in DIW | pH 7.4 | μA | Heterogenous (immobilized on electrode) | This work | |
Table 4: Comparison of reported organic HER electrocatalysts with P3-GCE. The table provides a comparison of reported organic electrocatalysts for HER with P3-GCE.
Most previously reported organic HER systems, including acridinium salts, benzothiadiazole derivatives, triphenylpyridine, phosphorus corrole, bipyridine- and phenanthroline-based catalysts, NADPH-like heterohelicenes, organic hydrides, and benzothiadiazole-caffeine conjugates, operate as homogeneous molecular catalysts in organic solvents such as acetonitrile, DMF, or DMSO in the presence of strong proton sources including HClO4, trifluoroacetic acid (TFA), acetic acid, and HBF₄. These reaction conditions provide a high concentration of readily available protons, thereby facilitating efficient hydrogen evolution. In contrast, P3-GCE functions as a heterogeneous electrocatalyst immobilized on a glassy carbon electrode and operates in environmentally benign aqueous electrolytes, namely 0.1 M phosphate buffer (pH 7.4) and 0.1 M KNO3. The significantly reduced proton availability under these near-neutral conditions is expected to limit the HER rate, thereby reducing hydrogen generation. Nevertheless, the ability of P3-GCE to catalyze hydrogen evolution without corrosive acids, organic solvents, or dissolved molecular catalysts highlights its practical advantages in operational simplicity, catalyst recovery, and environmental sustainability. Therefore, although the hydrogen evolution performance is lower than that of many reported homogeneous organic electrocatalysts, P3-GCE demonstrates the feasibility of employing a metal-free organic molecule for HER under mild aqueous conditions.
The observed behavior can be rationalized using the HER mechanism illustrated in Figure 11. Hydrogen evolution generally involves two key processes: adsorption of water molecules or protons onto the cathode surface (Volmer step), followed by hydrogen desorption through either the Heyrovsky or Tafel step. Efficient HER requires an appropriate balance between these processes. As HER is a two-electron-transfer process, its kinetics are strongly influenced by the electrolyte pH. In acidic media, the high proton concentration facilitates rapid reaction kinetics. In contrast, under neutral or alkaline conditions, proton generation depends on the slower dissociation of water molecules, resulting in a higher kinetic barrier54,55. “Despite the measurable Tafel response of −370 mV/dec, which suggests relatively fast reaction kinetics, the HER performance of P3-GCE appears to be limited by charge-transfer resistance. Electrochemical impedance spectroscopy (EIS) revealed a charge-transfer resistance of 2492 Ω, indicating restricted electron transport to the catalyst surface. Additionally, P3 is likely stabilized within the ionomer matrix through hydrogen-bonding interactions. Upon exposure to water, this hydrogen-bonding network may become more extensive. Consequently, the strong interaction between P3 and its surroundings may hinder the desorption of hydrogen from the electrode surface after its formation. This effect contributes to the high overpotential observed for HER and partially explains the lower catalytic activity of P3-GCE compared with both organic and inorganic electrocatalysts reported in the literature.
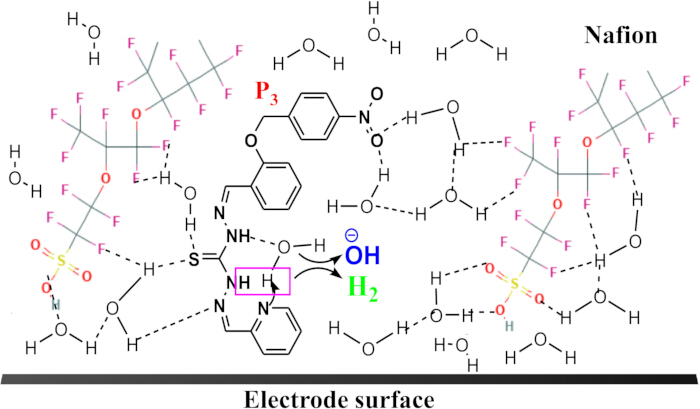
Figure 11: Hydrogen-bonding network at the P3-GCE through a hydrogen-bonding network involving water and the ionomer matrix. Diagram showing concerted H2 evolution by stabilization of P3 in perfluorosulfonic acid ionomer binder via a hydrogen-bonding network with water and the matrix. Please click here to view a larger version of this figure.
Tafel slopes of approximately 120, 40, and 30 mV/dec are generally associated with the Volmer, Heyrovsky, and Tafel rate-determining steps, respectively55. For P3-GCE, the rate-determining step is likely the Volmer process, in which water molecules first dissociate, and the resulting hydrogen species adsorb onto the catalyst surface. The presence of N–H, sulfur, and imine functionalities in P3 facilitates proton adsorption and subsequent hydrogen evolution. The HER mechanism in neutral media consists of three elementary reaction steps:
P3 + H2O + e- → P3Hads + OH- (Volmer Step) -------- (1)
P3Hads + e- + H2O ⇆ P3 + H2 + OH- (Heyrovsky step) -------- (2)
P3HadsHads ⇄ P3 + H2 (Tafel step) -------- (3)
2H2O + 2e- → H2 + 2OH- (Overall Reaction)
Mechanistic Discussion and Electrocatalytic Performance
The Volmer step (1) involves the dissociation of a water molecule and the adsorption of a hydrogen atom on an active site on the electrode or catalyst surface. Hydrogen evolution subsequently proceeds through either an electrochemical pathway, the Heyrovsky step (2), or a chemical pathway, the Tafel step (3). Several studies have reported that at low overpotentials, HER proceeds through the Volmer step, followed by the parallel Heyrovsky and Tafel pathways, whereas at high overpotentials the Tafel step becomes negligible and the reaction predominantly follows the Volmer–Heyrovsky mechanism56,57,58. Given the relatively high overpotential observed for P3, the HER is proposed to proceed mainly via the Volmer–Heyrovsky pathway. The proposed multiple pathways for HER on P3-GCE are illustrated in Figure 12.
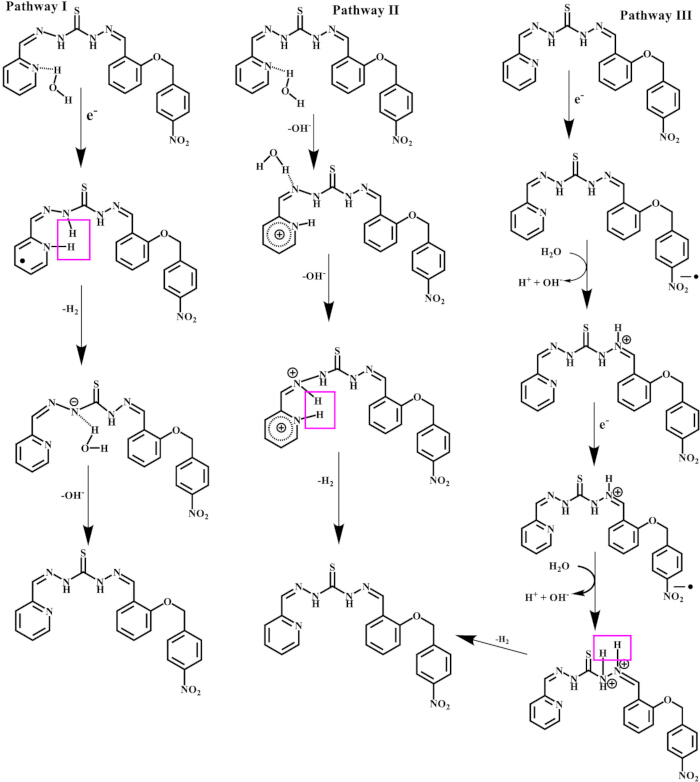
Figure 12: Plausible HER mechanism pathways. Schematic illustration of pathways showing a possible mechanism for HER on P3-GCE. Please click here to view a larger version of this figure.
Another factor influencing the HER performance is the buffering capacity of the 0.1 M phosphate buffer at pH 7.4, which is approximately 0.057 M. In this system, competition exists between P3, embedded in a perfluorosulfonic acid ionomer binder, and the buffer base for the protons generated during the initial HER step. This competition reduces the availability of H⁺ ions at the catalyst surface, thereby lowering hydrogen production. Gas chromatography analysis of the headspace in the electrocatalytic reaction assembly obtained from P3-GCE showed a distinct peak corresponding to H₂ gas, with a retention time matching that of a standard hydrogen sample. In addition, visible bubble formation at the electrode-electrolyte interface during prolonged electrolysis confirmed gas evolution. These observations collectively demonstrate that the cathodic current at P3-GCE is attributable to electrocatalytic hydrogen evolution. Only a small difference was observed in the amount of hydrogen generated by P3-GCE in 0.1 M phosphate buffer (25.28 µM) and in 0.1 M KNO₃ solution (21.31 µM). After the HER process in 0.1 M KNO₃, the solution's pH increased to 7.95. The initial increase in current in chronoamperometric measurements can be attributed to a higher local deprotonation rate near the electrode surface, driven by OH⁻ ions produced during the first catalytic step. However, as electrolysis continues, the depletion of available water molecules and protons reduces the efficiency of the P3-GCE in KNO₃ solution after 1h.
Advantages and Comparison with Other Catalysts
P3-GCE offers several advantages: (i) it functions as a heterogeneous catalyst immobilized as a film on the electrode surface, (ii) it operates effectively at neutral pH (7.4) without the need for an external proton source, (iii) the catalyst remains stable for several days, and (iv) it exhibits durability over multiple catalysis on/off cycles. Table 4 compares the performance of P3-GCE with various reported organic electrocatalysts. Inorganic metal complexes derived from thiocarbohydrazone ligands generally require an external proton source for HER and typically operate in non-aqueous media. For example, Co(II)59 and Cu(II)60 complexes of salen-type ligands reported by Dutta et al. function efficiently at neutral pH; however, the catalysis remains homogeneous and is dependent on the metal center.
/td>
| Sr. No. | Material | Electrode substrate | Electrolyte | Over potential at 10 mA/cm2 (mV) | Tafel Slope (mV) | Reference |
| 1 | C60-SWCNT15 (single walled carbon nano tube) | SiO2/Si film | Phosphate buffer (pH = 7) | 330 | 166.1 | 61 |
| 2 | N-MPG (Nitrogen doped mesoporous graphene) | Glassy carbon electrode | 0.5 M H2SO4 | 239 | 109 | 62 |
| 3 | B-SuG (Boron substituted graphene) | Glassy carbon electrode | 0.5 M H2SO4 | 201a | 99 | 63 |
| 4 | NS 500 (N,S co-doped graphene) | Nano porous nickel substrate | 0.5 M H2SO4 | −280 | 80.5 | 64 |
| 5 | N-CQDs-17h (Nitrogen-doped carbon quantum dots) | Glassy carbon electrode | 0.5 M H2SO4 | 341 | 126 | 65 |
| 6 | PA-900 (P- doped carbon) | Glassy carbon electrode | 0.5 M H2SO4 | 290 | −112.7 | 66 |
| 7 | PDHCI (carbon-based pentalene-rich nanoribbons) | Au(111) | 0.1 M HClO4 | At 0.4 mA/cm2 −258 | 82 | 67 |
| 8 | CD2 (Sulfanilamide/Citric Acid Derived N,S‑ Doped Carbon Dot) | Nickel foam | 1 M KOH | 216 | 124.1 | 68 |
| 9 | PG (Poly guanine polymer DNA inspired) | Carbon felt | 0.5 M H2SO4 | 411 | 243 | 69 |
| 10 | BSA-FCNT (Bovine serum albumin functionalized multi walled carbon nano tube) | Glassy carbon electrode | 0.5 M H2SO4 | -0.44 | 161 | 70 |
| 11 | P3-GCE | Glassy carbon electrode coated with P3 in perfluorosulfonic acid ionomer binder | 0.1 M phosphate buffer (pH = 7.4) | At 0.1 mA/cm2 −690 | −370 | This work |
| 0.1 M KNO3 in DIW | At 0.1 mA/cm2 −519 | −348 | This work | |||
| *a = Current density not available | ||||||
Table 5: Comparison of reported carbon and protein-based electrocatalysts. The table provides a comparison of reported carbon- and protein-based electrocatalysts for HER with P3-GCE.
To provide a broader perspective on the catalytic performance of P3-GCE, its HER activity was compared with representative carbon-, protein-, and DNA-based electrocatalysts reported in the literature (Table 5). Most carbon-based electrocatalysts, including C60-SWCNTs15,61, N-MPG62, B-SuG63,64, N-CQDs-17h65, PA-90066, and CD267,68, require relatively high overpotentials in the range of 201–341 mV to achieve current densities close to 10 mA/cm2 with Tafel slopes between 80 and 166 mV/dec. DNA-inspired polyguanine (PG)69 exhibits an even higher overpotential of 411 mV and a Tafel slope of 243 mV/dec, indicating comparatively sluggish HER kinetics. The protein-based catalyst BSA-FCNT70 also exhibits a higher Tafel slope (161 mV/dec), indicating slower charge transfer and proton reduction processes. In contrast, P3-GCE exhibits catalytic activity in neutral media, delivering hydrogen evolution at an overpotential of -690 mV in phosphate buffer (pH 7.4) and -519 mV in 0.1 M KNO3, both measured at a current density of 0.1 mA/cm2. Although direct comparison of overpotential values is complicated by differences in electrolyte composition, pH, electrode substrates, and operating current densities, the measured Tafel slopes obtained for P3-GCE (–370 and –348 mV/dec in magnitude) demonstrate its ability to facilitate HER under environmentally benign, near-neutral conditions without the need for highly acidic or alkaline electrolytes. These results highlight the potential of the synthesized organic molecule P3 as a metal-free electrocatalyst and justify its inclusion alongside established carbon-, protein-, and DNA-based HER systems.
Methodological Considerations and Reproducibility
A critical step in the protocol is thoroughly polishing and cleaning the glassy carbon electrode prior to catalyst immobilization. Inadequate polishing can result in uneven catalyst distribution and an irregular electroactive surface area, which in turn affects current density measurements obtained from linear sweep voltammetry (LSV). Uniform catalyst immobilization is therefore essential for obtaining consistent electrochemical responses. Residual contaminants on the electrode surface may increase the background current, shift the onset potential, and obscure the catalyst's intrinsic catalytic activity.
Additional factors that strongly influence the reliability of the protocol include electrolyte purity and the effective removal of oxygen from the solution. The presence of precipitates in the buffer or dissolved oxygen can significantly affect electrochemical measurements.
Reliable electrical contact between the electrodes and the potentiostat is equally important. Loose or unstable connections, as well as accidental physical contact between electrodes during measurements, can increase resistance and distort voltammograms at cathodic potentials. Firm mechanical connections and stable electrical contacts help minimize noise and improve the accuracy of overpotential measurements.
The reproducibility of the protocol is influenced by operator-dependent factors such as electrode polishing and drop-casting of P3 onto the glassy carbon surface. Variations in these steps can alter the electrochemically active surface area and affect the observed cathodic response.
Further studies are required to gain a deeper understanding of the catalytic HER behavior of P3-GCE.
Disclosures
The authors declare no conflict of interest.
Acknowledgements
PRS acknowledges the financial assistance in the form of JRF and SRF from Chatrapati Shri Shahu Maharaj Human Resource and Training Center (SARTHI), Pune, Maharashtra. AAK acknowledges the financial assistance from the RUSA Phase 2 (CBS/Th2.2) grant to SPPU. The authors thank the Central Instrumentation Facility (CIF) of Savitribai Phule Pune University, Pune, India, for providing HRMS and the Departmental Instrumentation Facility for electrochemical measurements. This publication was funded by the Norwegian Directorate for Higher Education and Skills under the UTFORSK program through the project HyTack: “Tackling the Challenges in Hydrogen Economy through Education and Research” (project number UTF-2021/10198).
Materials
| Name | Company | Catalog Number | Comments |
|---|---|---|---|
| Acetone | Qualigens | Q33516 | Flammable liquid, severe eye irritation |
| Concentrated Hydrochloric Acid | Qualigens | Q29145 | Corrosive; handle with gloves and eye protection and use in fume hood |
| Diethyl Ether | Avra | ASD1520 | Highly flammable; avoid ignition sources and inhalation |
| Dipotasssium hydrogen phosphate | Sisco Research Lboratories Pvt. Lts. | 90654 | Avoid contact with skin and eyes |
| Ethanol | Qualligens | Q21535 | Flammable liquid, keep away from heat and open flame |
| Ethyl acetate | Qualigens | Q2345C | Highly flammable, Keep away from heat, sparks and open flames |
| Hexane | Qualigens | Q13177 | Highly flammable liquid and vapor. Causes skin and eye irritation. |
| p-Nitrobenzyl bromide | Sigma Aldrich | N13054 | Skin corrosion, avoid direct exposure |
| Potassium Dihydrogen Orthophosphate | Sisco Research Lboratories Pvt. Ltd. | 52403 | Avoid contact with skin, eyes and clothing |
| Potassium nitrate | Thermo Fisher Scientific | A14527 | Keep away from heat, hot surfaces, sparks, open flames and other ignition sources |
| 2-Pyridyl carboxaldehyde | Avra | ASP2301 | Skin irritation, use only outdoors or in a well-ventilated area |
| Salicylaldehyde | Sisco Research Lboratories Pvt. Lts. | 24922 | Harmful if swallowed avoid inhalation and skin contact |
| Silica Gel (230-400 mesh) for column chromatography | Sisco Research Lboratories Pvt. Lts. | 96671 | Avoid direct contact with skin, eyes and inhalation |
| Thiocarbohydrazide | Alfa Aesar | 207530050 | Toxic when in contact with skin, acute inhalation toxicity |
| Potentiostat | Metrohm, Ivium | PGSTAT204, IVIUM VERTEX.1A | Handle electrical equipment with dry hands |
References
- Morrow MC, Machan CW. Molecular catalyst and co-catalyst systems based on transition metal complexes for the electrochemical oxidation of alcohols. Chem Commun. 2025;61:7710–7723.
- Wang G, Zhang L, Zhang J. A review of electrode materials for electrochemical supercapacitors. Chem Soc Rev. 2012;41:797–828.
- Wang H, et al. Rechargeable Li–O₂ batteries with a covalently coupled MnCo₂O₄–graphene hybrid as an oxygen cathode catalyst. Energy Environ Sci. 2012;5:7931–7935.
- Gao W, et al. Electrochemical hydrogen production coupling with the upgrading of organic and inorganic chemicals. Adv Mater. 2025;37(32):2503198. doi:10.1002/adma.202503198.
- Wu B, et al. Energy-saving hydrogen production via small molecules electrooxidation-assisted hybrid systems. Adv Mater. 2025;37(40):2507842. doi:10.1002/adma.202507842.
- Oni B. A review on electrochemical water splitting electrocatalysts for green H₂ production: unveiling the fundamentals and recent advances. Langmuir. 2025;41(17):10742–10767.
- Frey M. Hydrogenases: hydrogen-activating enzymes. ChemBioChem. 2002;3(2–3):153–160.
- Madden C, et al. Catalytic turnover of [FeFe]-hydrogenase based on single-molecule imaging. J Am Chem Soc. 2012;134(3):1577–1582.
- Lubitz W, Ogata H, Rüdiger O, Reijerse E. Hydrogenases. Chem Rev. 2014;114(8):4081–4148.
- Volbeda A, et al. Crystal structure of the nickel-iron hydrogenase from Desulfovibrio gigas. Nature. 1995;373(6515):580–587.
- Peters JW, Lanzilotta WN, Lemon BJ, Seefeldt LC. X-ray crystal structure of the Fe-only hydrogenase (CpI) from Clostridium pasteurianum to 1.8 Angstrom resolution. Science. 1998;282(5395):1853–1858.
- Becker R, et al. An iron-iron hydrogenase mimic with appended electron reservoir for efficient proton reduction in aqueous media. Sci Adv. 2016;2(1). doi:10.1126/sciadv.1501014.
- Li Y, Rauchfuss TB. Synthesis of diiron(I) dithiolato carbonyl complexes. Chem Rev. 2016;116:7043–7077.
- Goy R, et al. Photocatalytic hydrogen evolution driven by [FeFe] hydrogenase models tethered to fluorene and silafluorene sensitizers. Chem Eur J. 2017;23:334–345.
- Helm ML, et al. A synthetic nickel electrocatalyst with a turnover frequency above 100,000 s⁻1 for H₂ production. Science. 2011;333(6044):863–866.
- Koshiba K, Yamauchi K, Sakai K. A nickel dithiolate water reduction catalyst providing ligand-based proton-coupled electron-transfer pathways. Angew Chem Int Ed. 2017;56:4247–4251.
- Aimoto Y, Koshiba K, Yamauchi K, Sakai K. A family of molecular nickel hydrogen evolution catalysts providing tunable overpotentials using ligand-centered proton-coupled electron transfer paths. Chem Commun. 2018;54:12820–12823.
- Hossain MN, Zhang L, Neagu R, Sun S. Exploring the properties, types, and performance of atomic site catalysts in electrochemical hydrogen evolution reactions. Chem Soc Rev. 2025;54:3323–3386.
- Wang Z, et al. High-temperature pyrolysis regulation of Schiff base 3d coordination clusters for electrochemical application. ChemElectroChem. 2025;12(4). doi:10.1002/celc.202400453.
- Xin H, Lin Z, Dai Z. Recent progress on the ultralow-overpotential electrocatalysts for hydrogen evolution reaction. Adv Sustain Syst. 2026;10(1):2501370. doi:10.1002/adsu.202501370.
- Visser CM. Evolutionary roots of catalysis by nicotinamide and flavins in C-H oxidoreductases and in photosynthesis. Orig Life Evol Biosph. 1982;12:165–179.
- Stephan DW, Erker G. Frustrated Lewis pair chemistry: development and perspectives. Angew Chem Int Ed. 2015;54:6400–6441.
- Dolganov AV. The first example of electrocatalytic hydrogen evolution from organic “hydrides”. Int J Hydrogen Energy. 2024;60:11–19.
- Giri L, et al. Hydrogen-bonded organic framework structure: a metal-free electrocatalyst for the evolution of hydrogen. ACS Omega. 2022;7:22440–22446.
- Chen L, et al. Hydrogen-bonded organic frameworks: design, applications, and prospects. Mater Adv. 2022;3:3680–3708.
- Xu Z, et al. Covalent organic framework-derived C@COF core-shell microspheres for electrocatalytic hydrogen evolution. Int J Hydrogen Energy. 2024;89:443–452.
- Axelsson M, et al. Small organic molecules based on benzothiadiazole for electrolytic hydrogen production. J Am Chem Soc. 2021;143:21229–21233.
- Torres-Méndez CE, Tian H. Hydrogen evolution via hydride transfer by a small organic benzothiadiazole-caffeine electrocatalyst. Chem Catal. 2025;6:101581. doi:10.1016/j.checat.2025.101581.
- Batabyal M, Jaiswal S, Jha RK, Kumar S. Directing group strategy for the isolation of organoselenium(VI) benzoselenonates: metal-free catalysts for hydrogen evolution reaction. J Am Chem Soc. 2024;146(1):57–61.
- Dolganov AV, et al. Acridinium salts as metal-free electrocatalyst for hydrogen evolution reaction. Electrochem Commun. 2016;68:59–61.
- Dolganov AV, et al. Moving from acridinium to pyridinium: from complex to simple. 2,4,6-Triphenylpyridine and 2,4,6-triphenylpyrilium perchlorate as “metal-free” electrocatalysts of hydrogen evolution reaction: the influence of the nature of the heteroatom and acid on the pathway HER. Int J Hydrogen Energy. 2019;44:21495–21505.
- Yang G, et al. Substituent effect on ligand-centered electrocatalytic hydrogen evolution of phosphorus corroles. ChemSusChem. 2023;16(10). doi:10.1002/cssc.202300211.
- Ganz OY, et al. Synergetic effect during the electrocatalytic reaction of hydrogen production in the presence of 2,2′-bipyridine. Russ J Phys Chem. 2022;96:954–957.
- Klimaeva LA, et al. Electrocatalytic activity of 4,4′-bipyridine in the production of molecular hydrogen in the presence of acids of different nature. Russ J Phys Chem. 2022;96:958–963.
- Dolganov AV, et al. The electrocatalytic hydrogen evolution reaction in the presence of a metal-free organic catalyst based on 1,10-phenanthroline: the first example of a reaction proceeding by an intramolecular mechanism. Catal Sci Technol. 2024;14:2951–2958.
- Choudhury J, Mandal SK, Karak P. Exploiting the NADP⁺/NADPH-like hydride-transfer redox cycle with bis-imidazolium-embedded heterohelicene for electrocatalytic hydrogen evolution reaction. J Am Chem Soc. 2023;145:17321–17328.
- Calvary CA, et al. Copper bis(thiosemicarbazone) complexes with pendent polyamines: effects of proton relays and charged moieties on electrocatalytic HER. Eur J Inorg Chem. 2021;3:267–275.
- Straistari T, et al. Hydrogen evolution reactions catalyzed by a bis(thiosemicarbazone) cobalt complex: an experimental and theoretical study. Chem Eur J. 2018;24:8779–8786.
- Jain R, et al. Ligand-assisted ligand-centered electrocatalytic hydrogen evolution upon reduction of a bis(thiosemicarbazonato) Cu(II) complex. Inorg Chem. 2017;56:11254–11265.
- Calvary CA, et al. Synthesis, characterization, and HER activity of pendant diamine derivatives of NiATSM. Eur J Inorg Chem. 2019;33:3782–3790.
- Du J, Yang H, Wang CL, Zhan SZ. A bis(thiosemicarbazonato)-zinc complex, an electrocatalyst for hydrogen evolution and oxidation via ligand-assisted metal-centered reactivity. Appl Organomet Chem. 2022;36(4). doi:10.1002/aoc.6572.
- Straistari T, et al. Influence of the metal ion on the electrocatalytic hydrogen production by a thiosemicarbazone palladium complex. Eur J Inorg Chem. 2018;(20–21):2259–2266.
- Gomori G. Preparation of buffers for use in enzyme studies. In: Colowick SP, Kaplan NO, editors. Methods in Enzymology. Vol 1. New York: Academic Press; 1955. p. 138–146.
- Elgrishi N, et al. A practical beginner’s guide to cyclic voltammetry. J Chem Educ. 2018;95(2):197–206.
- Squella JA, Bollo S, Vergara LJ. Recent developments in the electrochemistry of some nitro compounds of biological significance. Curr Org Chem. 2005;9(6):565–581.
- Uchimiya M, et al. One-electron standard reduction potentials of nitroaromatic and cyclic nitramine explosives. Environ Pollut. 2010;158(10):3048–3053.
- Bollo S, Núñez-Vergara LJ, Squella JA. Cyclic voltammetric determination of free radical species from nitroimidazopyran: a new antituberculosis agent. J Electroanal Chem. 2004;562(1):9–14.
- Bontà M, et al. Nitro radical anions from megazol and related nitroimidazoles in aprotic media: a father/son type reaction triggered by an acidic proton. Electrochim Acta. 2002;47(25):4045–4053.
- Bard AJ, Faulkner LR. Electrochemical Methods: Fundamentals and Applications. 2nd ed. New York: Wiley; 2001.
- Gunić E, Tabaković I. Electrochemical synthesis of heterocyclic compounds. 17. Anodic oxidation of hydrazones in the presence of heteroaromatic and Schiff bases. J Org Chem. 1988;53(21):5081–5087.
- Al-Hazmi G, El-Shahawi M, El-Asmy A. Ligand influence on the electrochemical behaviour of some copper(II) thiosemicarbazone complexes. Transit Met Chem. 2005;30:464–470.
- Claraz A. Harnessing the versatility of hydrazones through electrosynthetic oxidative transformations. Beilstein J Org Chem. 2024;20:1988–2004.
- Szilagyi RK, et al. Description of the ground state wave functions of Ni dithiolenes using sulfur K-edge X-ray absorption spectroscopy. J Am Chem Soc. 2003;125(30):9158–9169.
- Karaali G, Kaba I, Koca A. Graphene derivative based electrocatalytic hydrogen evolution reaction of water splitting processes. Fuel. 2026;416:138579. doi:10.1016/j.fuel.2026.138579.
- Ramohlola K, Modibane K, Ndipingwi M, Emmanuel I. Polyaniline-based electrocatalysts for electrochemical hydrogen evolution reaction. Eur Polym J. 2024;213:113125. doi:10.1016/j.eurpolymj.2024.113125.
- Durovic M, Hnat J, Bouzek K. Electrocatalysts for the hydrogen evolution reaction in alkaline and neutral media: a comparative review. J Power Sources. 2021;493:229708. doi:10.1016/j.jpowsour.2021.229708.
- Podrojkova N, Guboova A, Streckova M, Orinakova R. A study of the mechanism of the hydrogen evolution reaction catalysed by molybdenum phosphide in different media. Mater Today Sustain. 2025;31:101141. doi:10.1016/j.mtsust.2025.101141.
- Bao F, et al. Understanding the hydrogen evolution reaction kinetics of electrodeposited nickel-molybdenum in acidic, near-neutral, and alkaline conditions. ChemElectroChem. 2021;8:195–208.
- Mir AB, et al. The rational inclusion of vitamin B₆ boosts artificial cobalt complex catalyzed green H₂ production. Sustain Energy Fuels. 2022;6(18):4160–4168.
- Ghorai S, et al. Oxygen-tolerant hydrogen evolution in water using Schiff base copper complexes with tuneable secondary coordination environments. Dalton Trans. 2025;54(38):14505–14512.
- Gao R, Dai Q, Dai L. C₆₀-adsorbed single-walled carbon nanotubes as metal-free, pH-universal, and multifunctional catalysts for oxygen reduction, oxygen evolution, and hydrogen evolution. J Am Chem Soc. 2019;141:11658–11666.
- Huang X, Zhao Y, Ao Z, Wang G. Micelle-template synthesis of nitrogen-doped mesoporous graphene as an efficient metal-free electrocatalyst for hydrogen production. Sci Rep. 2014;4:7557. doi:10.1038/srep07557.
- Sathe B, Zau X, Asefa T. Metal-free B-doped graphene with efficient electrocatalytic activity for hydrogen evolution reaction. Catal Sci Technol. 2014;4:2023–2030.
- Ito Y, et al. High catalytic activity of nitrogen and sulfur co-doped nanoporous graphene in the hydrogen evolution reaction. Angew Chem Int Ed. 2015;54:2131–2136.
- Liu Y, et al. Nitrogen-doped carbon quantum dots via a facile reflux-assisted polymerization of N-methyl-pyrrolidone for hydrogen evolution reaction. J Solid State Chem. 2021;293:121781. doi:10.1016/j.jssc.2020.121781.
- García-Dalí S, et al. Green and easy synthesis of P-doped carbon-based hydrogen evolution reaction electrocatalysts. Carbon. 2023;212:118154. doi:10.1016/j.carbon.2023.118154.
- Xue H, et al. On-surface synthesis of pentalene-rich nanoribbons for exploring their activity in the hydrogen evolution reaction. J Phys Chem Lett. 2026;17:5829–5835.
- Mishra A, Basak H, Chakraborty B, Bhattacharya S. Hydrogen evolution reaction using a sulfanilamide/citric acid-derived N,S-doped carbon dot. ACS Appl Energy Mater. 2026;9:1771–1781.
- Harada Y, et al. DNA-inspired polymers as metal-free electrocatalysts for hydrogen evolution reaction in acidic media. Mol Catal. 2025;576:114916. doi:10.1016/j.mcat.2025.114916.
- Mannuthodikayil J, et al. Protein denaturation-induced electrocatalytic hydrogen evolution. Carbon. 2020;165:378–385.
Reprints and Permissions
This article has been published
Video Coming Soon