This protocol describes a combined assessment of body composition and neuromuscular performance to obtain biomarkers of muscle mass and function for characterizing athletes' training status and patients' health status.
Method Article
Combined Assessment of Body Composition and Neuromuscular Performance in Clinical Practice
In This Article
Summary
Abstract
The assessment of body composition and neuromuscular performance provides valuable information for the clinical management of athletes and diverse patient populations. This protocol describes the combined use of a multifrequency bioelectrical impedance analyzer and a force analyzer to obtain biomarkers of muscle mass and function. The bioelectrical impedance analyzer measures the body's impedance to alternating electrical currents at selected frequencies, enabling the estimation of body composition parameters. The force analyzer detects vertically applied forces during sit-to-stand movements, including single, two-times, or three-times chair stand tests, allowing the evaluation of neuromuscular performance. Both assessments are simple to perform, noninvasive, and provide results quickly through automatically generated reports. The combined analysis of body composition and neuromuscular performance offers a practical approach for characterizing physical performance in athletes and functional and health status in clinical populations. This protocol may facilitate routine monitoring and support individualized training, rehabilitation, and clinical management strategies and outcomes.
Introduction
Sarcopenia is the loss of skeletal muscle mass and function (occurring during the aging process or secondary to an underlying disease) that significantly affects the health status, especially in elderly subjects1,2,3. From a pathophysiologic perspective, sarcopenia can be viewed as an organ failure that can develop chronically (more often) or acutely (e.g., during immobilization) and results from a combination of neural and muscular adaptations1,2,3. Neural adaptations involve neuropathic processes that lead to motor unit denervation and a preferential loss of fast motor units. Muscular adaptations include decreases in muscle fiber number (hypoplasia) and size (atrophy), particularly affecting fast muscle fibers (which are more vulnerable to atrophy than slow muscle fibers). Operational definitions of sarcopenia have recently been proposed by several international groups, highlighting that low skeletal muscle mass should be considered a sign and not a syndrome4,5,6. According to all international groups, although X-ray computed tomography and magnetic resonance imaging can be considered reference standards for estimating the skeletal muscle mass (for example, through the assessment of mid-thigh or lumbar muscle cross-sectional area), their use in the clinical setting is limited because these techniques are time-consuming and require highly trained personnel, and because of the high costs and invasiveness4,5,6. On the contrary, bioelectrical impedance analysis (BIA) is an inexpensive, safe, simple technique that can be adopted in the clinical practice for the estimation of fat free mass (i.e., all non-fat components of the body) and muscle mass7,8,9. BIA does not measure fat-free mass and muscle mass directly, but instead derives estimates of appendicular fat-free mass (i.e., the lean mass of the four limbs, with the inclusion of bone mineral) and muscle mass based on the electrical conductivity of the body and the use of predictive equations.
All international groups agreed that the diagnosis of the sarcopenic syndrome requires the combined detection of low muscle mass and low muscle function4,5,6. Consistently, clinical features of sarcopenia that are relevant from the patients’ perspective include muscle function impairments producing mobility disability, inability to perform activities of daily living, increased risk of falls, fatigue, and reduced quality of life. The assessment of muscle function is usually performed in clinical practice through the handgrip strength test10,11 and/or the chair stand test12. Two variations of the latter test are commonly adopted: the five-times chair stand test13 and the timed chair stand test14. They measure, respectively, the time needed to rise five times from a chair and the number of times a subject can rise and sit in a chair over a 30-second interval. Moreover, the evaluation of the rate of force development has become popular in the last decade for characterizing explosive strength during rapid voluntary contractions, such as sit-to-stand movements, as it affects both the force and velocity production components: as compared to the maximal strength, the rate of force development is better related to functional activities and more sensitive to detect acute and chronic changes in neuromuscular function15. Consistently, it has been previously found that the measurement of ground reaction force parameters in explosive movements produced during a chair stand test provides a more accurate assessment of the dynamic strength of lower limbs compared to the classical five-times test16 and that the combined assessment of explosive strength and balance is effective for evaluating risks of falls or motor impairment17,18. Therefore, the integrated evaluation of body composition and neuromuscular performance (quantifying appendicular muscle mass and explosive strength, respectively) can be useful in clinical practice for assessing frail patients with sarcopenia or neuromuscular disorders.
The aim of this protocol is to describe procedures for evaluating body composition and neuromuscular performance using multifrequency bioelectrical impedance analysis and force-based sit-to-stand testing. This combined approach is intended for clinical and sports medicine settings where rapid, noninvasive assessment of muscle mass and function is needed.
Protocol
All procedures involving human participants were conducted in accordance with the ethical standards of the institutional committees and the Declaration of Helsinki. The study protocols were approved by the Ethics Committee of the University of Turin (protocol no. 115311/2024) and the Territorial Ethics Committees of Turin (protocol no. 223/2026). Written informed consent was obtained from all participants prior to participation.
1. Subject preparation
- Ask the subject to wear only undergarments and remove socks and shoes.
2. Body composition assessment using bioelectrical impedance analysis
- Register the subject
- Measure the subject's height (to the nearest 0.5 cm) using a stadiometer.
- Double-click on the software icon on the desktop to launch the application.
- Navigate to the subject registration section.
- Click on Add + to create a new subject profile.
- Enter the subject's personal information, including gender, last name, first name, and date of birth. Enter the contact information, including address, ZIP code, country, e-mail address, telephone number, and mobile number, and then click on Save (Supplementary Figure 1).
- Click on Go to home screen, then click on the rightmost button to proceed.
- Click on Analysis to proceed to the assessment setup.
- Select the body type (Standard or Athlete: Standard type must be selected if the subject is sedentary or recreationally active, while Athletic type must be selected if the subject performs 12 or more hours of exercise per week or participates in organized team or individual sports that involve regular competition and require systematic training). Enter the subject's height and clothing weight, and then click on Start Analysis.
- Acquire body composition data
- Instruct the subject to step onto the device and follow the on-screen instructions.
- Instruct the subject to hold the hand electrodes (with arms relaxed and straight but held slightly away from the torso) during the measurement.
- Ask the subject to return the hand electrodes and step off the device after the measurement is complete.
- Analyze body composition data
- Review the automatically generated body composition report.
- Record fat-free mass, muscle mass, fat mass, body fat percentage, and basal metabolic rate (Figure 1, Table 1) and then click on Save.
NOTE: Additional outputs include total body water, extracellular water, intracellular water, total body and segmental muscle mass, total body and segmental phase angle, resistance, reactance, and sarcopenia index values. - Print the report (through the Print button) or share the results (through the Share button).
3. Neuromuscular performance assessment
- Register the subject
- Measure the subject's height using a stadiometer.
- Open the software and click on the application window.
- Enter the password and click on Next.
- Click on Muscle Function and then click on Register.
- Enter the required information, including name, date of birth, gender, body weight, height, and body type (Standard or Athlete: Standard type must be selected if the subject is sedentary or recreationally active, while Athletic type must be selected if the subject performs 12 or more hours of exercise per week or participates in organized team or individual sports that involve regular competition and require systematic training) (Supplementary Figure 2).
- Click on Register and Start Measurement.
- Acquire neuromuscular performance data
- Ask the subject to place both feet on the two metal plates of the platform (Figure 2A).
- Select the number of sit-to-stand repetitions (1, 2, or 3) and click on Start Measurement.
- Instruct the subject to sit upright with the arms crossed over the chest, and the knees flexed to approximately 70°.
- Instruct the subject to stand (Figure 2B) as quickly as possible when prompted and to sit down when instructed by the system.
- Inform the subject that the test is complete when the audio message indicates the end of the measurement.
- Click on Back, Exit, or Print Out to close the session.
- Analyze neuromuscular performance data
- Review the automatically generated report.
- Record leg muscle strength, standing speed, and stability values (Figure 2C).
NOTE: The software classifies leg muscle strength as weak, average, or strong; standing speed as slow, average, or fast; and stability as unstable, stable, or very stable. - Review the strength and stability T-score graph to evaluate overall neuromuscular performance.
- Print the report (through the Print Out button).
Results
Immediately after the bioelectrical impedance analysis, the software of the analyzer (system #1) provides estimates of body composition, including fat-free mass, muscle mass, fat mass, body fat percentage, and basal metabolic rate, which are generated using proprietary algorithms (Figure 1, Table 1). In addition, the system provides estimates of total body water (TBW), extracellular water (ECW), intracellular water (ICW), and the ECW/TBW ratio (Figure 1). The analysis also yields total-body and segmental muscle mass values for both upper and lower limbs, allowing the calculation of the sarcopenia index, defined as the sum of upper- and lower-limb muscle mass normalized by height squared. Sarcopenia index values below 7.26 kg/m2 in males and 5.5 kg/m2 in females are indicative of low muscle mass19,20. Furthermore, total-body and segmental phase angle values at 50 kHz are provided, together with resistance and reactance measurements obtained at multiple frequencies. These raw bioelectrical parameters can be used to derive additional indicators of body composition and hydration status, including extracellular-to-intracellular water relationships, which may provide further insight into muscle quality and cellular health21. In fact, total-body and segmental resistance and reactance values obtained at multiple frequencies can be used to calculate extracellular-to-intracellular water (ECW/ICW) resistance ratios according to the equation R5 / [(R5 × R250)/(R5 − R250)]21, where R5 and R250 represent resistance values measured at 5 kHz and 250 kHz, respectively.
Immediately after completion of the sit-to-stand test, the software of the neuromuscular performance analyzer (system #2) generates three variables using proprietary algorithms (Figure 2C): (i) leg muscle strength, defined as the force generated during the sit-to-stand movement and calculated as the maximum load divided by body weight; (ii) standing speed, defined as the speed of the sit-to-stand movement and calculated as the maximum load increase per unit time divided by body weight; and (iii) stability, an index that combines the degree of body movement during standing and the time required for postural sway to cease. Stability is reported as a T-score based on reference data from age- and sex-matched populations. These outputs are used to classify subjects as weak, average, or strong for leg muscle strength; slow, average, or fast for standing speed; and unstable, stable, or very stable for stability. In addition, the software provides a strength–stability T-score graph (Figure 2C) that categorizes overall strength and stability as low or high.
Table 2 summarizes body composition and neuromuscular performance variables obtained from four representative male subjects: an athlete (31 years), a sedentary healthy subject (51 years), a person with obesity (59 years), and a patient with Parkinson's disease (60 years). The data illustrate distinct physiological and functional profiles across the four subjects. The athlete and sedentary subject exhibited normal body weight, whereas the person with obesity had class II obesity, and the patient with Parkinson's disease was underweight. Hydration status, assessed by the TBW/body weight ratio, was within the expected range (50%–65%) in the athlete, sedentary subject, and patient with Parkinson's disease, whereas lower values were observed in the person with obesity. The sarcopenia index was within the normal range in the athlete, sedentary subject, and person with obesity, but was reduced in the patient with Parkinson's disease (7.15 kg/m2). The highest and lowest total-body phase angle values at 50 kHz were observed in the athlete and the person with obesity, respectively. Similarly, the highest and lowest total-body ECW/ICW resistance ratios were observed in the athlete and the person with obesity, whereas the highest and lowest lower-limb ECW/ICW resistance ratios were observed in the athlete and the patient with Parkinson's disease, respectively. Neuromuscular performance analysis classified the athlete and sedentary subject as strong, fast, and very stable. In contrast, the person with obesity was classified as weak, slow, and very stable, whereas the patient with Parkinson's disease was classified as weak, average, and very stable.
The combined assessment of body composition and neuromuscular performance generated distinct physiological profiles across the four representative subjects. The athlete and sedentary subject exhibited normal muscle mass and neuromuscular performance characteristics, whereas the patient with Parkinson's disease displayed reduced muscle mass and impaired strength parameters consistent with a sarcopenic profile. These findings illustrate how the combined assessment can be used to characterize muscle mass and function in individuals with different clinical and functional conditions.
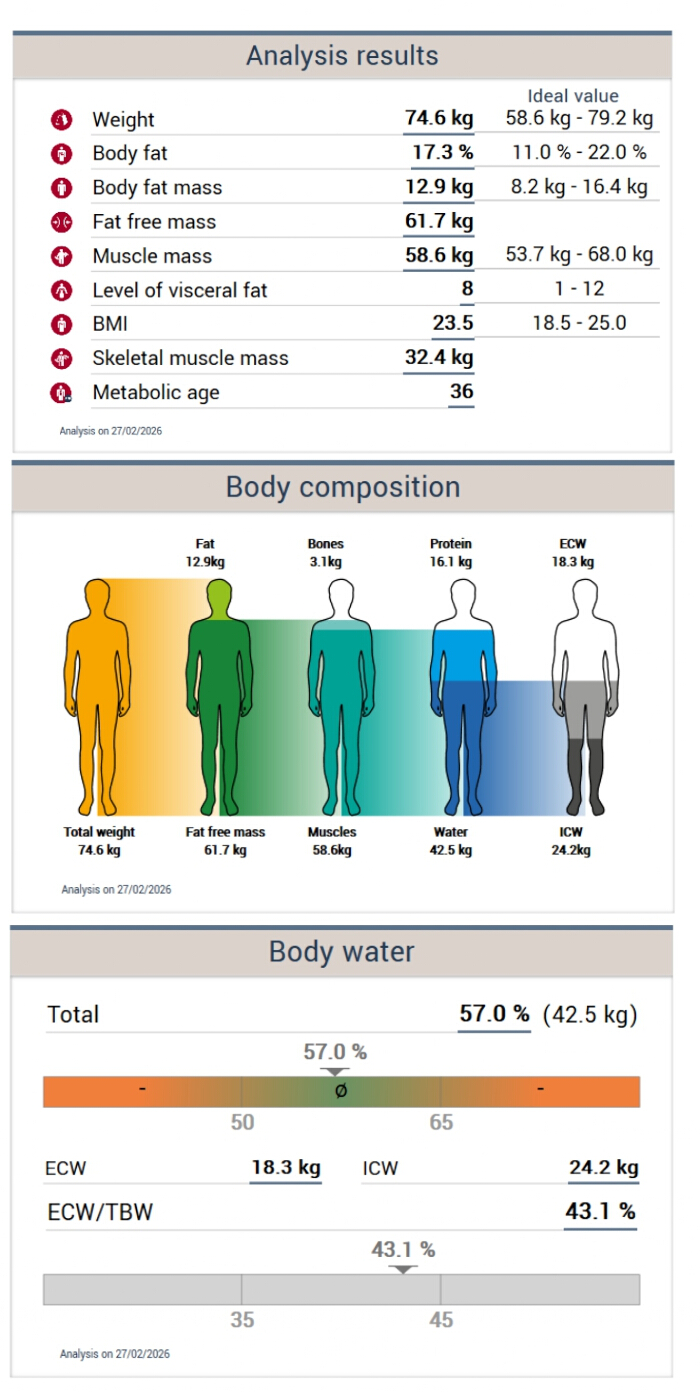
Figure 1: Representative bioelectrical impedance analysis report obtained from a healthy male subject. The report includes body composition variables (weight, body fat percentage, body fat mass, fat-free mass, muscle mass, visceral fat level, body mass index, skeletal muscle mass, and metabolic age) and body water variables, including total body water, extracellular water, intracellular water, and the extracellular water-to-total body water ratio. Abbreviations: BMI = body mass index; ECW = extracellular water; ICW = intracellular water; TBW = total body water. Please click here to view a larger version of this figure.
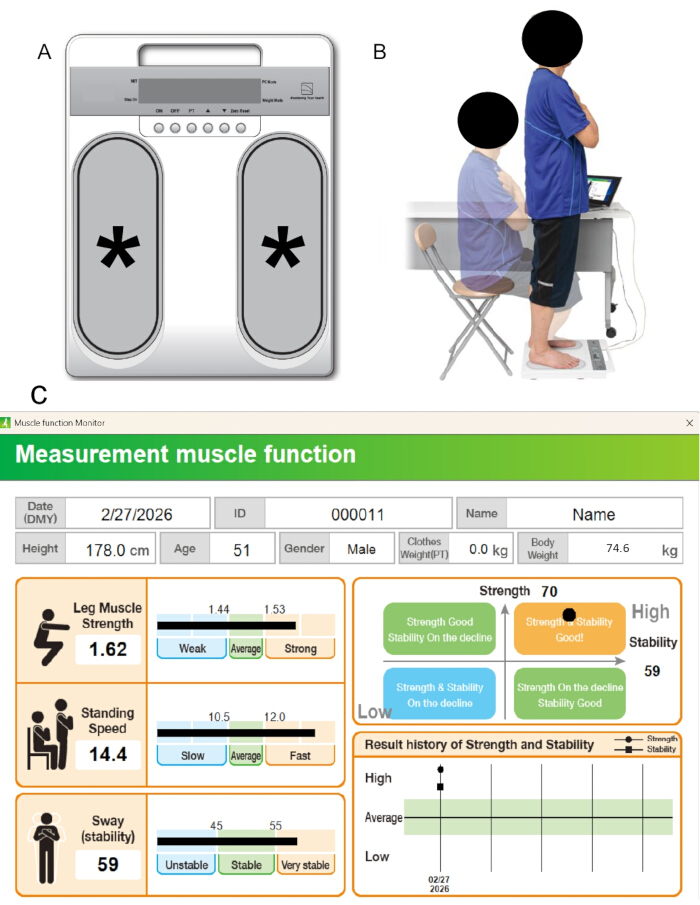
Figure 2: Representative neuromuscular performance assessment and software-generated report. (A) Neuromuscular performance analyzer (system #2) showing the metal foot-placement plates (asterisks) used during testing. (B) Representative sit-to-stand movement performed during the assessment. (C) Representative neuromuscular performance report generated by the software for the same healthy male subject shown in Figure 1. The report includes leg muscle strength, standing speed, and stability indices, as well as the strength–stability classification chart and historical trend graph. Please click here to view a larger version of this figure.
| Extended measurement set downloadable from the software of the system #1 | Body weight (unit of measurement: kg) |
| Body fat % | |
| Fat mass (unit of measurement: kg) | |
| Fat free mass (unit of measurement: kg) | |
| Muscle mass (unit of measurement: kg) | |
| Bone mass (unit of measurement: kg) | |
| Total body water (unit of measurement: kg) | |
| Extracellular water (unit of measurement: kg) | |
| Intracellular water (unit of measurement: kg) | |
| Extracellular-to-total body water ratio | |
| Body mass index (unit of measurement: kg/m2) | |
| Metabolism (units of measurment: kcal and kJ) | |
| Segmental (left and right arm, left and right leg, torso) fat mass (unit of measurement: kg) | |
| Segmental (left and right arm, left and right leg, torso) muscle mass (unit of measurement: kg) | |
| Fat free mass index (unit of measurement: kg/m2) | |
| Sarcopenia index (unit of measurement: kg/m2) | |
| Total body and segmental (left and right arm, left and right leg) phase angle obtained at the frequency of 50 kHz (unit of measurement: °) | |
| Resistance and reactance values (unit of measurement: Ω) obtained for different frequencies | |
| Extended measurement set downloadable from the software of the system #2 | Body weight (unit of measurement: kg) |
| Leg muscle strength (F/w): body weight-normalized peak force (ground reaction force) until standing (unit of measurement: kgf/kg) | |
| Rate of force development (RFD/w): body weight-normalized rate of force increase (unit of measurement: kgf/s/kg) | |
| Stable Time: time when the load recorded its maximum value until it stabilised (unit of measurement: s) | |
| Lateral sway (Vx): absolute value of the velocity of the center of gravity movement in the left-right direction during the standing-up motion (unit of measurement: mm/s) | |
| Load fluctuation (Vw): absolute value of the vertical load movement velocity during the standing-up movement (unit of measurement: kg/s) | |
| Max left load ratio: degree of force applied to the left side when standing up (expressed as %) | |
| Max right load ratio: degree of force applied to the right side when standing up (expressed as %) |
Table 1: Body composition and neuromuscular performance variables provided by the body composition analyzer (system #1) and the neuromuscular performance analyzer (system #2). The table summarizes all variables available for export from the software-generated reports.
| VARIABLES | Athlete | Sedentary subject | Obese person | Patient with Parkison's disease | ||
| Body mass index (kg/m2) | 24.2 | 23.5 | 38.9 | 17.7 | ||
| Total body water (l) | 46.6 | 42.5 | 51.2 | 36.5 | ||
| Total body water / weight (%) | 61.4 | 57.0 | 47.8 | 65.0 | ||
| Extracellular water / total body water ratio (%) | 40.1 | 43.1 | 43.2 | 43.6 | ||
| Fat free mass (kg) | 68.2 | 61.7 | 67.9 | 53.7 | ||
| Muscle mass (kg) | 64.8 | 58.6 | 64.5 | 51 | ||
| Sarcopenia index (kg/m2) | 9.8 | 8.3 | 10.8 | 7.15 | ||
| Total body phase angle at the frequency of 50 kHz (°) | 7.3 | 5.7 | 5.3 | 5.4 | ||
| Total body extracellular-to-intracellular water resistance ratio | 0.36 | 0.26 | 0.24 | 0.25 | ||
| Lower limb extracellular-to-intracellular water resistance ratio | 0.32 | 0.24 | 0.21 | 0.20 | ||
| Leg muscle strength (F/w: kgf/kg) | 1.79 | 1.62 | 1.31 | 1.38 | ||
| Rate of force development (RFD/w: kgf/s/kg) | 16.6 | 14.4 | 9.2 | 11.2 | ||
| Sway (stability) T-score | 60 | 59 | 59 | 57 | ||
Table 2: Representative body composition and neuromuscular performance variables obtained from four male subjects with different clinical and functional characteristics. Data are reported for an athlete, a sedentary healthy subject, an obese person, and a patient with Parkinson's disease to illustrate the application of the combined assessment protocol.
Supplementary Figure 1: Subject registration interface for body composition assessment (system #1). Screenshot of the software registration window used to enter participant demographic and contact information before bioelectrical impedance analysis. Please click here to download this file.
Supplementary Figure 2: Subject registration interface for neuromuscular performance assessment (system #2). Screenshot of the software registration window used to enter participant information before the sit-to-stand neuromuscular performance assessment. Please click here to download this file.
Discussion
Commercially available systems enable the assessments described in this protocol: these solutions are noninvasive and easy to use, and the investigations are simple, fast, and inexpensive. However, several limitations of the above-described solutions, procedures, and parameters warrant highlighting. First, the multifrequency bioelectrical impedance analyzer used in this study is not portable due to its size (124 cm × 45 cm × 74 cm) and weight (33 kg). Second, the BIA and the chair stand test can only be performed in subjects who can assume and maintain the standing position. Therefore, these investigations cannot be performed in neurological or critically ill patients presenting with severe motor disability. Moreover, BIA requires the subject to hold the hand electrodes; this task can be difficult (or even impossible) for patients with tremor or upper-limb disorders (e.g., motor impairment after stroke). However, BIA can also be performed in patients presenting with severe motor impairment using other commercially available devices designed for supine (i.e., bedside) measurements with adhesive electrodes9. Third, body composition parameters are obtained using device-specific, proprietary algorithms; therefore, analytical variability may preclude comparing data obtained with different devices. However, the use of raw measures of resistance and reactance, together with cross-validated equations, can at least partially overcome this limitation. An alternative approach to comparing data obtained by different devices is to use raw measurements, such as the phase angle and the ECW/ICW resistance ratio. The former variable is a proxy for membrane integrity22,23, while the latter variable is a proxy for cell hydration21,24,25. Consistently, several recent studies showed that both the phase angle26,27,28,29 and the ECW/ICW resistance ratio21,24,25 are useful indicators of muscle function in older adults and can be useful for the prediction of disability and mortality25,30. The lower phase angle values observed in the two patients compared with our two healthy subjects may be related to age- and/or disease-related changes in cellular health22,23. The lower values of the ECW/ICW resistance ratios observed in the two patients compared to our two healthy subjects could be related to the age-related and/or disease-related relative expansion of the ECW (with the consequent decrease in ECW resistance) and/or the decrease of ICW (with the consequent increase in ICW resistance)21,24.
Despite these limitations, the combined assessment of body composition and neuromuscular performance provides a practical, noninvasive approach for evaluating muscle mass and function in clinical and sports medicine settings. The integration of body composition variables with measures of strength, standing speed, and stability may facilitate a more comprehensive characterization of functional status than either assessment alone. Consequently, this approach may support the monitoring of athletes and patients and help identify individuals at risk of impaired muscle function or sarcopenia.
Disclosures
A.P. and S.B.H. are members of Tanita Corporation's medical advisory board. M.A.M. has received equipment on loan through a research contract with Tanita Corporation. This article was an author-initiated endeavor, independent of Tanita Corporation, and no content was influenced by the company.
Acknowledgements
The authors thank Dr. Federico Todella (University of Turin) for his support with data acquisition.
Financial support for this work was provided by the “Grant for Internationalization – GFI” of the University of Turin.
Materials
| Name | Company | Catalog Number | Comments |
|---|---|---|---|
| System #1 | |||
| Multifrequency impedance analyzer | Tanita Corporation, Tokyo, Japan | MC-980-MA-N | "System #1" in the manuscript |
| Mobee® 360 - Tanita Pro | SportMed SA, Echternach, Luxembourg | Version 4.6.0 | "Software of the system #1" in the manuscript |
| System #2 | |||
| Muscle function Monitor | Tanita Corporation, Tokyo, Japan | zaRitz BM-220 | "System #2" in the manuscript |
| Muscle function Monitor software | Tanita Corporation, Tokyo, Japan | Version 1.7.3 | "Software of the system #2" in the manuscript |
References
- Narici MV, Maffulli N. Sarcopenia: characteristics, mechanisms and functional significance. Br Med Bull. 2010;95:139-159.
- Minetto MA et al. Common Musculoskeletal Disorders in the Elderly: The Star Triad. J Clin Med. 2020;9:1216.
- Cruz-Jentoft AJ, Sayer AA. Sarcopenia. Lancet. 2019;393:2636-2646.
- Studenski SA et al. The FNIH sarcopenia project: rationale, study description, conference recommendations, and final estimates. J Gerontol A Biol Sci Med Sci. 2014;69:547-558.
- Cruz-Jentoft AJ et al. Sarcopenia: revised European consensus on definition and diagnosis. Age Ageing. 2019;48:16-31.
- Chen LK et al. Asian working group for sarcopenia: 2019 consensus update on sarcopenia diagnosis and treatment. J Am Med Dir Assoc. 2020;21:300-307.
- Heymsfield SB, Lohman T, Wang ZM, Going S. Human body composition. 2nd Edition. Human Kinetics; Champaign, IL, USA; 2005.
- Thomas DM et al. Updates on methods for body composition analysis: Implications for clinical practice. Curr Obes Rep. 2025;14:8.
- Son JW et al. Development and clinical application of bioelectrical impedance analysis method for body composition assessment. Obes Rev. 2025;26:e13844.
- Mathiowetz V, Weber K, Volland G, Kashman N. Reliability and validity of grip and pinch strength evaluations. J Hand Surg Am. 1984;9:222-226.
- Bohannon RW, Schaubert KL. Test-retest reliability of grip-strength measures obtained over a 12-week interval from community-dwelling elders. J Hand Ther. 2005;18:426-427.
- Lord SR et al. Sit-to-stand performance depends on sensation, speed, balance, and psychological status in addition to strength in older people. J Gerontol A Biol Sci Med Sci. 2002;57:M539-443.
- Bohannon RW. Reference values for the five-repetition sit-to-stand test: a descriptive meta-analysis of data from elders. Percept Mot Skills. 2006;103:215-222.
- Jones CJ, Rikli RE, Beam WC. A 30-s chair-stand test as a measure of lower body strength in community-residing older adults. Res Q Exerc Sport. 1999;70:113-119.
- Maffiuletti NA et al. Rate of force development: physiological and methodological considerations. Eur J Appl Physiol. 2016;116:1091-1116.
- Tsuji T, Tsunoda K, Mitsuishi Y, Okura T. Ground reaction force in sit-to-stand movement reflects lower limb muscle strength and power in community-dwelling older adults. Int J Gerontol. 2015;9:111-118.
- Abe T et al. Composite variable of lower extremity muscle strength and balance ability for evaluating risks of mobility limitation and falls in community-dwelling older adults. J Phys Fitness Sports Med. 2016;5:257-266.
- Seya T et al. Rate of force development during sit-to-stand movement is associated with locomotive syndrome severity: a cross-sectional study. Geriatr Gerontol Int. 2026;26:e70314.
- Baumgartner RN et al. Epidemiology of sarcopenia among the elderly in New Mexico. Am J Epidemiol. 1998;147:755-763.
- Beaudart C et al. Prevalence of sarcopenia: the impact of different diagnostic cut-off limits. J Musculoskelet Neuronal Interact. 2014;14:425-431.
- Asano Y, Tsuji T, Okura T. Segmental extracellular-to-intracellular water resistance ratio and physical function in older adults. Exp Gerontol. 2023;181:112278. Erratum in: Exp Gerontol. 2024;189:112398.
- Yamada Y et al. Phase angle obtained via bioelectrical impedance analysis and objectively measured physical activity or exercise habits. Sci Rep. 2022;12:17274.
- da Silva BR et al. Phase angle and cellular health: inflammation and oxidative damage. Rev Endocr Metab Disord. 2023;24:543-562.
- Asano Y, Tsuji T, Okura T. Segmental extracellular-to-intracellular water resistance ratio and physical function in older adults. Exp Gerontol. 2023;181:112278.
- Asano Y et al. Segmental phase angle and the extracellular to intracellular water ratio are associated with functional disability in community-dwelling older adults: A follow-up study of up to 12 years. Nutrition. 2025;133:112709.
- Yamada M et al. Phase angle is a useful indicator for muscle function in older adults. J Nutr Health Aging. 2019;23:251-255.
- Chen J et al. Associations between objectively measured overall and intensity-specific physical activity and phase angle in older adults. Sci Rep. 2024;14:7309.
- Lin LY et al. Sedentary behavior and phase angle: An objective assessment in physically active and inactive older adults. Nutrients. 2023;16:101.
- Homma D et al. Decreased lower limb phase angle in older people is an indicator of standing and gait function, regardless of age. J Clin Med. 2025;14:1023.
- Asano Y et al. Association of muscle mass, muscle quality, and function with mortality in community-dwelling older adults: Focus on segmental phase angle and extracellular to intracellular water ratio. Clin Nutr ESPEN. 2025;70:240-248.
Reprints and Permissions
This article has been published
Video Coming Soon