This article describes a combined functional and urinary biomarker-based approach to predict renal replacement therapy requirements in patients with sepsis-associated acute kidney injury.
Research Article
Predicting Renal Replacement Therapy Requirement In Sepsis-Associated Acute Kidney Injury Using Furosemide Stress Testing and Urinary Biomarkers
Opens in a new tab
In This Article
Summary
Loading...
$$\rightleftharpoonup{xx}$$
$$\longleftharp{xx}$$,
$$\longrightharp{xx}$$,
Abstract
Loading...
$$\rightleftharpoonup{xx}$$
$$\longleftharp{xx}$$,
$$\longrightharp{xx}$$,
This study aimed to investigate the predictive value of a model combining the furosemide stress test (FST) with urinary tissue inhibitor of metalloproteinase-2 (TIMP-2) and insulin-like growth factor-binding protein 7 (IGFBP-7) for predicting renal replacement therapy (RRT) initiation within 7 days in patients with sepsis-associated acute kidney injury (SA-AKI). A total of 63 patients with SA-AKI admitted to the intensive care units (ICU) of Zhongwei People’s Hospital and the Affiliated Hospital of Ningxia Medical University between January 2025 and November 2025 were enrolled in this study. According to whether RRT was initiated within 7 days, patients were divided into an RRT group (n = 20) and a non-RRT group (n = 43). Clinical characteristics, laboratory parameters, and urinary biomarkers were collected. Urinary TIMP-2 and IGFBP-7 levels were measured using enzyme-linked immunosorbent assay, and the predictive performance of FST combined with urinary [TIMP-2] * [IGFBP-7] was evaluated using multivariate logistic regression and receiver operating characteristic (ROC) curve analysis. The results showed that 20 patients (31.7%) required RRT during follow-up, while 43 patients (68.3%) did not. Compared with the non-RRT group, patients in the RRT group exhibited more severe renal dysfunction and higher incidence of adverse kidney events. ROC analysis demonstrated that the area under the curve (AUC) for FST, baseline TIMP-2*IGFBP-7, TIMP-2*IGFBP-7 measured 2 h after FST, and the combined model were 0.878, 0.820, 0.845, and 0.966, respectively. Multivariate logistic regression further confirmed that the combined FST and urinary TIMP-2*IGFBP-7 indicator was an independent predictor of RRT requirement. These findings suggest that the combined FST and urinary TIMP-2*IGFBP-7 model may be useful for early risk stratification of SA-AKI patients at high risk of requiring RRT.
Introduction
Loading...
$$\rightleftharpoonup{xx}$$
$$\longleftharp{xx}$$,
$$\longrightharp{xx}$$,
Sepsis is a critical clinical syndrome commonly encountered in the intensive care unit (ICU), characterized by high morbidity and mortality. The systemic inflammatory response triggered by sepsis can lead to multiple organ dysfunction, among which sepsis-associated acute kidney injury (SA-AKI) is one of the most common and severe complications1,2,3. Previous studies have reported that approximately 40%–50% of patients with sepsis develop SA-AKI, which is associated with significantly increased mortality4,5,6. Therefore, early identification and accurate diagnosis of SA-AKI are essential for assessing disease progression and guiding therapeutic strategies. For patients with progressive SA-AKI, timely initiation of renal replacement therapy (RRT) plays an important role in maintaining internal homeostasis and preventing multiple organ failure. However, reliable and objective criteria for determining the optimal timing of RRT initiation remain lacking in clinical practice7,8.
In recent years, biomarkers have attracted considerable attention for the early diagnosis and risk stratification of SA-AKI9,10,11. Tissue inhibitor of metalloproteinase-2 (TIMP-2) and insulin-like growth factor-binding protein-7 (IGFBP-7) reflect renal tubular cell cycle arrest and cellular stress responses, and have been demonstrated to possess good predictive value for the occurrence and progression of acute kidney injury12,13. In addition, the furosemide stress test (FST) evaluates renal responsiveness to diuretics and indirectly reflects tubular functional reserve and renal perfusion status, providing a simple and practical functional assessment of kidney injury severity14. Nevertheless, a single indicator has limitations in predicting the timing of RRT initiation and may not fully capture renal function, local injury, and systemic pathophysiological changes.
Therefore, this study employed a two-center prospective diagnostic prediction model to jointly evaluate FST results and urinary [TIMP-2] * [IGFBP-7] levels in patients with SA-AKI. By integrating clinical variables and laboratory indicators, we aimed to construct a predictive model for RRT requirement within 7 days and to assess its ability to identify high-risk SA-AKI patients, thereby providing evidence to support early clinical decision-making.
Protocol
Loading...
$$\rightleftharpoonup{xx}$$
$$\longleftharp{xx}$$,
$$\longrightharp{xx}$$,
Patient enrollment and ethical approval
This study was designed as a prospective two-center cohort study. The study population consisted of patients with sepsis-associated acute kidney injury (SA-AKI) who were admitted to the intensive care units (ICU) of Zhongwei People’s Hospital and the General Hospital of Ningxia Medical University between January 2025 and November 2025. The study protocol was approved by the Ethics Committees of the General Hospital of Ningxia Medical University (Approval No. KYLL-2025-1232) and Zhongwei People’s Hospital, Ningxia, China (Approval No. NXZWSRMYYLL-202445). All procedures were conducted in accordance with the Declaration of Helsinki. Written informed consent was obtained from all participants or their legal representatives before enrollment.
The inclusion criteria were as follows: age ≥ 18 years; diagnosis of sepsis according to the Sepsis-3.0 criteria; diagnosis of acute kidney injury according to the KDIGO 2012 criteria; and written informed consent provided by the patient or legal guardian.
The exclusion criteria were patients with end-stage renal disease (CKD stage 5) or those receiving long-term dialysis; severe hepatic dysfunction, defined as Child-Pugh class C liver disease, not related to the current sepsis episode; known allergy to furosemide; pregnant or lactating women; patients with incomplete clinical data, unavailable or incomplete urinary biomarker measurements, or inability to complete the study protocol.
During the study period, 100 patients were screened. After excluding 30 patients without sepsis, 5 patients with missing data, and 2 patients who withdrew from the study, a total of 63 patients were finally included in the analysis.
Diagnostic procedures for SA-AKI
Diagnosis of sepsis
Sepsis was diagnosed according to the Sepsis-3.0 definition2,3. Patients were diagnosed with sepsis when a confirmed or suspected infection was present, and the Sequential Organ Failure Assessment (SOFA) score increased by ≥2 points from baseline. The diagnosis of sepsis was determined based on the following information: evidence of infection, including pulmonary infection, abdominal infection, urinary tract infection, biliary infection, or soft tissue infection; clinical manifestations, such as fever or hypothermia, chills, altered consciousness, hypotension, and hemodynamic instability; laboratory findings, including white blood cell count, procalcitonin (PCT), interleukin-6 (IL-6), and lactate levels; assessment of organ dysfunction using the SOFA score, which evaluates respiratory, cardiovascular, renal, neurological, hepatic, and coagulation functions.
Diagnosis of acute kidney injury
Acute kidney injury (AKI) was diagnosed according to the Kidney Disease: Improving Global Outcomes (KDIGO) 2012 criteria15. AKI was defined when any of the following conditions were met: An increase in serum creatinine (Scr) ≥ 26.5 µmol/L within 48 h; an increase in serum creatinine ≥ 50% from baseline; and a urine output of <0.5 mL/(kg·h) for ≥6 h. Baseline Scr was obtained from available medical records before or at admission; patients without sufficient data for KDIGO staging were excluded as incomplete clinical data. The severity of AKI was classified into stages 1, 2, and 3 according to KDIGO criteria, based on the magnitude of serum creatinine increase and the degree of urine output reduction.
Definition of SA-AKI
Patients who met both the Sepsis-3.0 criteria for sepsis and the KDIGO diagnostic criteria for acute kidney injury were defined as having sepsis-associated acute kidney injury (SA-AKI). Eligible patients meeting these criteria were subsequently included in the study.
Collection of clinical data and laboratory indicators
After confirming the diagnosis of SA-AKI, baseline demographic and clinical information were collected, including: Demographic data: age and sex; Infection-related information: infection site and patient source; Comorbidities: including hypertension, diabetes mellitus, chronic kidney disease, and cardiovascular diseases; Disease severity assessment: Acute Physiology and Chronic Health Evaluation II (APACHE II) score and SOFA score;
For AKI stage classification, laboratory indicators within the first 24 h after ICU admission were also recorded, including: white blood cell count, absolute lymphocyte count, neutrophil percentage, platelet count, blood pH, lactate, albumin, total bilirubin, serum creatinine, serum potassium, procalcitonin (PCT), and interleukin-6 (IL-6).
Furosemide stress test (FST)
The furosemide stress test (FST) was performed to assess renal tubular functional reserve and the risk of AKI progression16,17. In the present study, FST was administered after the diagnosis of SA-AKI had been established and when patients developed clinical signs of fluid overload during early ICU management. The predefined indications for FST included positive cumulative fluid balance exceeding 5% of baseline body weight, newly developed dyspnea, or peripheral edema. FST was performed according to a standardized protocol. Furosemide was administered intravenously at a dose of 1.0–1.5 mg/kg, and total urine output was measured during the subsequent 2 h. A urine output of ≥200 mL within 2 h after furosemide administration was defined as FST responsive, whereas a urine output of <200 mL was defined as FST nonresponsive/high risk. Blood pressure, urine catheter patency, fluid balance, and serum potassium were monitored during the test.
Measurement of urinary biomarkers
Urine samples were collected at the following time points: 0 h (baseline), 2 h after FST, 4 h after FST, and 12 h after FST. During the observation period, a small number of patients had markedly reduced urine output; however, complete anuria was not observed in the final analytic cohort. For patients with severely reduced urine volume, urine samples were collected whenever possible, according to the study protocol. Patients with unavailable or incomplete urinary biomarker measurements were excluded during patient screening and data quality control. The sample processing procedure was as follows. Urine samples were centrifuged within 2 h after collection. Centrifugation was performed at 151 × g for 15 min. The supernatant was then transferred to sterile tubes and stored at −80 °C until analysis. Before measurement, the samples were thawed and centrifuged again. The concentrations of tissue inhibitor of metalloproteinase-2 (TIMP-2) and insulin-like growth factor-binding protein 7 (IGFBP-7) were determined using enzyme-linked immunosorbent assay (ELISA), and the product of urinary [TIMP-2] * [IGFBP-7] was calculated11,13. RRIDs were unavailable for the commercial kits used in this study. Urinary biomarker values were not normalized to urinary creatinine.
Construction of the predictive model
The primary endpoint of the study was the initiation of renal replacement therapy (RRT) within 7 days after enrollment. RRT was initiated according to routine clinical indications, including refractory hyperkalemia, refractory acidosis, fluid overload, oliguria/anuria, or uremic complications. Patients were divided into two groups based on whether RRT was initiated within 7 days: RRT group and non-RRT group. The predictive model was constructed as follows. First, baseline characteristics, laboratory indicators, FST results, AKI stage, and urinary biomarker levels were compared between the two groups to identify potential variables associated with RRT requirement. Second, univariate logistic regression analysis was performed to evaluate the association between candidate variables and the need for RRT within 7 days. Third, variables with P < 0.10 in the univariate analysis, together with AKI stage, given its clinical relevance to RRT requirement, were included in the multivariate logistic regression model to identify independent predictors after adjusting for potential confounding factors. Particular emphasis was placed on evaluating the predictive value of the combined index of FST and urinary [TIMP-2] * [IGFBP-7]. Because FST was administered according to predefined clinical indications rather than at a prespecified fixed time point after ICU admission, the exact timing of FST administration was not prespecified as a candidate predictor in the primary multivariable model.
Evaluation of predictive performance
Receiver operating characteristic (ROC) curve analysis was used to assess how well each individual indicator and the combined model identified patients who required RRT within 7 days. The area under the curve (AUC), sensitivity, and specificity were determined. The following indicators were compared: Baseline urinary [TIMP-2] * [IGFBP-7]; FST results; Urinary [TIMP-2] * [IGFBP-7] measured 2 h after FST; The combined model incorporating FST and urinary [TIMP-2] * [IGFBP-7] at 2 h after FST. The predictive performance of the combined model was evaluated by comparing AUC values with those of individual indicators. Net reclassification improvement (NRI) for the 2-h biomarker model is presented in Supplemental Table S1.
Statistical analysis
Normally distributed continuous variables were reported as mean ± standard deviation (SD) and compared between groups using the independent-samples t-test. Continuous variables with non-normal distributions were reported as median (interquartile range) and compared using the Wilcoxon rank-sum test. Categorical variables were analyzed using the chi-square test or Fisher’s exact test. Logistic regression was used to assess factors associated with RRT requirement, with odds ratios (ORs) and 95% confidence intervals (CIs) reported. ROC curves were compared using the DeLong test. All tests were two-sided, and P < 0.05 was considered statistically significant.
Results
Loading...
$$\rightleftharpoonup{xx}$$
$$\longleftharp{xx}$$,
$$\longrightharp{xx}$$,
Patient enrollment and baseline characteristics
A total of 100 patients were initially screened in this study. After excluding 30 patients without sepsis, 5 patients with missing data, and 2 patients who withdrew from the study, a total of 63 patients with confirmed sepsis-associated acute kidney injury (SA-AKI) were finally included in the analysis. Among them, 42 were male, and 21 were female, with a mean age of 67.25 ± 14.5 years. Based on whether renal replacement therapy (RRT) was initiated within 7 days of enrollment, patients were divided into an RRT group (n = 20, 31.7%) and a non-RRT group (n = 43, 68.3%). There were no significant differences between the two groups in terms of age, sex, or most underlying comorbidities. However, patients in the RRT group had significantly higher AKI stages, APACHE II scores, and SOFA scores compared with those in the non-RRT group (all P < 0.05). The source of the department and the infection site also differed between groups. Detailed baseline characteristics are presented in Table 1.
Comparison of laboratory indicators between the two groups
Laboratory comparisons indicated more severe inflammation and organ dysfunction in the RRT group than in the non-RRT group. The RRT group had significantly lower pH and serum albumin levels and significantly higher serum creatinine, serum potassium, procalcitonin (PCT), and interleukin-6 (IL-6) levels than the non-RRT group (all P < 0.05). No significant between-group differences were found in white blood cell count, absolute lymphocyte count, neutrophil percentage, platelet count, lactate level, or total bilirubin level. These results are presented in Table 2.
Predictive performance of FST combined with urinary [TIMP-2] * [IGFBP-7] for RRT requirement within 7 days
Receiver operating characteristic (ROC) curve analysis was used to assess the ability of each indicator and the combined model to identify patients with SA-AKI who required RRT within 7 days. The area under the curve (AUC) values for FST, baseline urinary TIMP-2*IGFBP-7, urinary TIMP-2*IGFBP-7 measured 2 h after FST, and the combined model of FST with urinary TIMP-2*IGFBP-7 were 0.878, 0.820, 0.845, and 0.966, respectively. The corresponding sensitivities were 85%, 85%, 90%, and 85%, while the specificities were 91%, 72%, 79%, and 91%, respectively.
These results indicated that the combined model incorporating FST and urinary [TIMP-2] * [IGFBP-7] demonstrated superior predictive performance compared with individual indicators. Pairwise DeLong comparisons showed that the combined model had a higher AUC than FST alone (0.966 vs. 0.878, P = 0.008), baseline urinary TIMP-2*IGFBP-7 (0.966 vs. 0.820, P = 0.024), and urinary TIMP-2*IGFBP-7 measured 2 h after FST (0.966 vs. 0.845, P = 0.008). The ROC curves are shown in Figure 1; panel A corresponds to FST, panel B to baseline urinary TIMP-2*IGFBP-7, panel C to urinary TIMP-2*IGFBP-7 measured 2 h after FST, and panel D to the combined model. AUROC, accuracy, sensitivity, specificity, positive predictive value (PPV), and negative predictive value (NPV) were estimated, with corresponding 95% confidence intervals.
Analysis of factors associated with RRT requirement
Univariate logistic regression analysis demonstrated that APACHE II score, SOFA score, pH value, albumin level, serum creatinine, serum potassium, procalcitonin level, FST results, baseline urinary [TIMP-2] * [IGFBP-7], urinary [TIMP-2] * [IGFBP-7] measured 2 h after FST, and the combined index of FST with urinary [TIMP-2] * [IGFBP-7] were significantly associated with the requirement for RRT within 7 days (P < 0.05). The detailed results are presented in Table 3.
Variables identified in the univariate analysis, together with AKI stage, were further included in the multivariate logistic regression model. After adjusting for potential confounding factors, serum albumin level and the high-risk status defined by the combined FST and urinary [TIMP-2] * [IGFBP-7] remained independently associated with the requirement for RRT within 7 days. Notably, patients classified as high-risk according to the combined FST and urinary [TIMP-2] * [IGFBP-7] model had a markedly increased risk of requiring RRT. The detailed results are shown in Table 4.
Clinical outcomes
For secondary outcomes, 28-day mortality was higher in the RRT group than in the non-RRT group (35.0% vs. 18.6%), but this difference was not statistically significant (P = 0.269). Median ICU length of stay was 8 days in the RRT group and 9 days in the non-RRT group, with no significant between-group difference (P = 0.923). These results are summarized in Table 5.
Data Availability:
The data supporting the findings of this study are included in the article and in Supplemental Figure S1 and Supplemental Table S1.
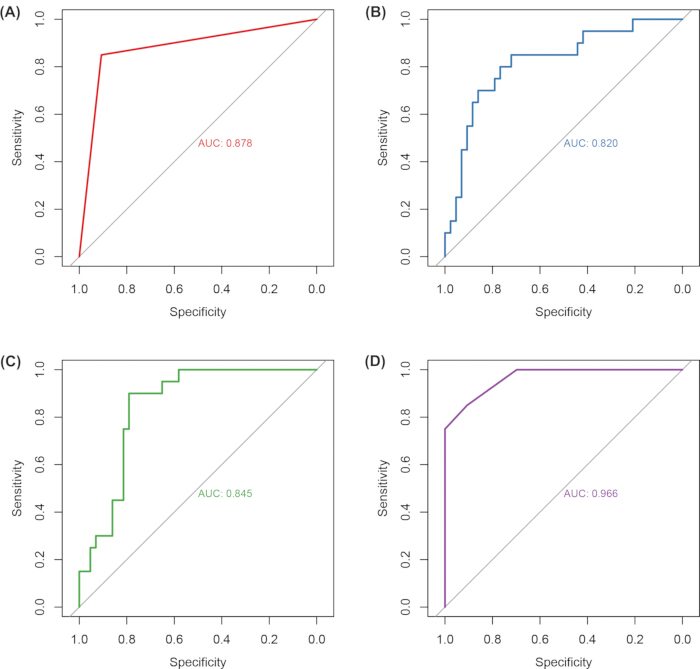
Figure 1: Receiver operating characteristic curves for predicting renal replacement therapy in patients with sepsis-associated acute kidney injury. (A) ROC curve of the furosemide stress test (FST). (B) ROC curve of urinary TIMP-2*IGFBP-7 measured at baseline (0 h). (C) ROC curve of urinary TIMP-2*IGFBP-7 measured at 2 h after FST. (D) ROC curve of the combined model based on FST and urinary TIMP-2*IGFBP-7 measured at 2 h after FST. Please click here to view a larger version of this figure.
| Variable | Total (n=63) | RRT group (n=20) | Non-RRT group (n=43) | P value |
| Age, years | 65.02 (14.81) | 64.90 (15.44) | 65.07 (14.70) | 0.967 |
| Sex, n (%) | 0.214 | |||
| Male | 42 (66.70) | 16 (80.00) | 26 (60.50) | |
| Female | 21 (33.30) | 4 (20.00) | 17 (39.50) | |
| Department, n (%) | <0.001 | |||
| Internal Medicine | 31 (49.20) | 18 (90.00) | 13 (30.20) | |
| Surgery | 32 (50.80) | 2 (10.00) | 30 (69.80) | |
| AKI Stage, n (%) | <0.001 | |||
| Stage 1 | 31 (49.20) | 0 (0.00) | 31 (72.10) | |
| Stage 2 | 22 (34.90) | 10 (50.00) | 12 (27.90) | |
| Stage 3 | 10 (15.90) | 10 (50.00) | 0 (0.00) | |
| APACHE II score | 21.00 [17.00, 26.00] | 24.00 [19.00, 30.00] | 20.00 [16.00, 24.00] | 0.010 |
| SOFA score | 10.00 (3.78) | 11.95 (3.62) | 9.09 (3.53) | 0.004 |
| Comorbidities, n (%) | ||||
| Hypertension | 16 (25.40) | 6 (30.00) | 10 (23.30) | 0.794 |
| Cardiovascular disease | 9 (14.30) | 1 (5.00) | 8 (18.60) | 0.251 |
| COPD | 2 ( 3.20) | 0 (0.00) | 2 (4.70) | 1.000 |
| Chronic kidney disease | 1 (1.60) | 1 (5.00) | 0 (0.00) | 0.317 |
| Chronic heart failure | 2 (3.20) | 0 (0.00) | 2 (4.70) | 1.000 |
| Diabetes mellitus | 16 (25.40) | 5 (25.00) | 11 (25.60) | 1.000 |
| Malignant tumor | 1 (1.60) | 0 (0.00) | 1 (2.30) | 1.000 |
| Cerebrovascular disease | 1 (1.60) | 0 (0.00) | 1 (2.30) | 1.000 |
| Rheumatic immune disease | 3 (4.80) | 1 (5.00) | 2 (4.70) | 1.000 |
| Septic shock | 46 (73.00) | 18 (90.00) | 28 (65.10) | 0.077 |
| Infection site, n (%) | 0.015 | |||
| Respiratory system | 17 (27.00) | 3 (15.00) | 14 (32.60) | |
| Biliary tract | 4 (6.30) | 1 (5.00) | 3 (7.00) | |
| Abdominal cavity | 21 (33.30) | 12 (60.00) | 9 (20.90) | |
| Urinary system | 17 (27.00) | 2 (10.00) | 15 (34.90) | |
| Soft tissue | 4 (6.30) | 2 (10.00) | 2 (4.70) |
Table 1: Baseline characteristics of the study participants. Data are presented as n (%) and median (interquartile range). Abbreviations: AKI = acute kidney injury; APACHE II = Acute Physiology and Chronic Health Evaluation II; SOFA = Sequential Organ Failure Assessment.
| Variable | Total (n=63) | RRT group (n=20) | Non-RRT group (n=43) | P value |
| Laboratory parameters | ||||
| White blood cell count (×109/L) | 12.21 [6.81, 16.82] | 10.94 [6.93, 13.78] | 12.44 [6.81, 17.70] | 0.575 |
| Absolute lymphocyte count (×109/L) | 0.82 [0.44, 1.17] | 0.84 [0.46, 1.51] | 0.67 [0.42, 1.06] | 0.288 |
| Neutrophil percentage (%) | 86.70 [80.05, 92.85] | 84.35 [78.35, 88.95] | 87.00 [81.90, 93.10] | 0.235 |
| Platelet count (×109/L) | 119.00 [77.00, 193.50] | 147.00 [92.75, 193.25] | 113.00 [71.00, 195.00] | 0.605 |
| pH | 7.35 [7.23, 7.41] | 7.26 [7.15, 7.33] | 7.37 [7.27, 7.42] | 0.004 |
| Lactate (mmol/L) | 2.90 [1.70, 4.55] | 2.65 [2.07, 5.55] | 3.00 [1.70, 4.05] | 0.717 |
| Albumin (g/L) | 27.31 [24.13, 31.26] | 24.49 [22.82, 25.87] | 30.43 [26.27, 33.02] | <0.001 |
| Total bilirubin (mmol/L) | 18.06 [12.10, 28.30] | 25.56 [10.36, 37.78] | 18.06 [12.70, 23.83] | 0.384 |
| Creatinine (μmol/L) | 188.40 [153.50, 247.90] | 259.75 [183.18, 369.40] | 179.00 [150.85, 214.95] | 0.003 |
| Serum potassium (mmol/L) | 3.99 [3.50, 4.34] | 4.20 [3.78, 4.60] | 3.80 [3.36, 4.25] | 0.031 |
| Procalcitonin (ng/mL) | 9.90 [3.95, 50.14] | 46.00 [9.64, 88.75] | 5.80 [2.25, 31.50] | 0.004 |
| Interleukin-6 (pg/mL) | 355.28 [69.90, 3820.50] | 1405.50 [399.32, 5000.00] | 172.00 [43.77, 1552.56] | 0.005 |
Table 2: Laboratory parameters of the study participants.
| Variable | OR | 95%CI | P value |
| Age | 0.999 | (0.964-1.036) | 0.966 |
| Sex | |||
| Male | 1.000 | - | - |
| Female | 0.382 | (0.109-1.341) | 0.133 |
| APACHE II score | 1.112 | (1.020-1.211) | 0.016 |
| SOFA score | 1.249 | (1.059-1.474) | 0.008 |
| White blood cell count (×109/L) | 0.974 | (0.909-1.044) | 0.453 |
| Absolute lymphocyte count (×109/L) | 1.384 | (0.939-2.039) | 0.101 |
| Neutrophil percentage (%) | 0.980 | (0.933-1.029) | 0.412 |
| Platelet count (×109/L) | 1.000 | (0.994-1.005) | 0.960 |
| pH | 0.008 | (0.000-0.477) | 0.020 |
| Lactate (mmol/L) | 1.108 | (0.933-1.316) | 0.241 |
| Albumin (g/L) | 0.718 | (0.592-0.871) | <0.001 |
| Total bilirubin (mmol/L) | 1.004 | (0.994-1.014) | 0.462 |
| Creatinine (μmol/L) | 1.012 | (1.005-1.020) | 0.002 |
| Serum potassium (mmol/L) | 2.521 | (1.011-6.287) | 0.047 |
| Procalcitonin (ng/mL) | 1.022 | (1.006-1.038) | 0.008 |
| Interleukin-6 (pg/mL) | 1.000 | (1.000-1.000) | 0.555 |
| FST (200 mL/2 h) | |||
| Low-risk group | 1.000 | - | - |
| High-risk group | 55.250 | (12.780 ,332.850) | <0.001 |
| TIMP-2 * IGFBP-7 (0 h) (ng²/mL²/1000) | |||
| Low-risk group | 1.000 | - | - |
| High-risk group | 10.330 | (3.100,42.140) | |
| TIMP-2 * IGFBP-7 (2 h) (ng²/mL²/1000) | <0.001 | ||
| Low-risk group | 1.000 | - | - |
| High-risk group | 34.000 | (7.960,2 41.230) | <0.001 |
| FST * TIMP-2 * IGFBP-7 (2 h) (ng²/mL²/1000) | |||
| Low-risk group | 1.000 | - | - |
| High-risk group | 55.250 | (12.780,332.850) | <0.001 |
Table 3: Univariable logistic regression analysis. Cases were classified into low-risk and high-risk groups according to the cutoff value of TIMP-2IGFBP-7 based on the Youden index (as described in the Methods). A two-step combined approach was used, including an upstream furosemide stress test, followed by TIMP-2IGFBP-7 measurement to verify abnormal results. Odds ratios and the corresponding 95% confidence intervals were reported.
| Variable | OR | 95%CI | P value |
| APACHE II score | 1.018 | 0.739-1.357 | 0.898 |
| SOFA score | 0.963 | 0.542-1.648 | 0.890 |
| Albumin (g/L) | 0.531 | 0.235-0.856 | 0.048 |
| Creatinine (μmol/L) | 0.997 | 0.976-1.018 | 0.749 |
| Serum potassium (mmol/L) | 31.118 | 1.609-2069.689 | 0.052 |
| Procalcitonin (ng/mL) | 1.035 | 0.995-1.095 | 0.124 |
| FST * TIMP-2 * IGFBP-7 (2 h) (ng²/mL²/1000) | |||
| Low-risk group | 1.000 | ||
| High-risk group | 130.379 | 7.263- 19081.870 | 0.010 |
Table 4: Multivariable logistic regression analysis. Abbreviations: APACHE II = Acute Physiology and Chronic Health Evaluation II; SOFA = Sequential Organ Failure Assessment; FST = furosemide stress test; TIMP-2 = tissue inhibitor of metalloproteinases-2; IGFBP-7 = insulin-like growth factor-binding protein 7.
| Outcome | RRT group | Non-RRT group | P value |
| Prognosis (%) | 0.269 | ||
| Survival, n (%) | 13 (65.00) | 35 (81.40) | |
| Death, n (%) | 7 (35.00) | 8 (18.60) | |
| ICU length of stay (days) | 8.00 [4.00, 11.25] | 9.00 [4.00, 10.50] | 0.923 |
Table 5: Secondary outcomes of the study. Data are presented as n (%) and median (interquartile range).
Supplemental Figure S1: Dynamic changes in urinary [TIMP-2] * [IGFBP-7] at baseline (0 h), 2 h, 4 h, and 12 h after FST in the RRT and non-RRT groups. Points indicate median values, and error bars indicate interquartile ranges. The y-axis is log10-scaled because biomarker values were right-skewed. At each time point, urinary [TIMP-2] * [IGFBP-7] values were higher in the RRT group than in the non-RRT group (all P < 0.001). RRT, renal replacement therapy; TIMP-2, tissue inhibitor of metalloproteinase-2; IGFBP-7, insulin-like growth factor-binding protein 7.Please click here to download this file.
Supplemental Table S1: Net reclassification improvement analysis for urinary [TIMP-2] * [IGFBP-7] measured 2 h after FST. Abbreviations: FST = furosemide stress test; RRT = renal replacement therapy; CI = confidence interval; TIMP-2 = tissue inhibitor of metalloproteinase-2; IGFBP-7 = insulin-like growth factor-binding protein 7.Please click here to download this file.
Discussion
Loading...
$$\rightleftharpoonup{xx}$$
$$\longleftharp{xx}$$,
$$\longrightharp{xx}$$,
Sepsis-associated acute kidney injury (SA-AKI) is a common and severe complication in patients admitted to the intensive care unit (ICU). Its pathophysiological mechanisms are complex and involve multiple processes, including inflammatory responses, microcirculatory dysfunction, and oxidative stress18. Timely and appropriate initiation of renal replacement therapy (continuous renal replacement therapy, CRRT) is critical for improving the prognosis of patients with SA-AKI. However, the optimal timing for initiating CRRT remains unclear in clinical practice19,20,21. Current decisions are often based on traditional renal function indicators and clinical experience, which may lead to either delayed treatment or unnecessary early intervention21. Previous studies have shown that differences in the timing of CRRT initiation can significantly influence the outcomes of critically ill patients with AKI22,23. Therefore, identifying effective combined assessment indicators and incorporating more comprehensive clinical data—such as expanded comorbidity profiles, additional laboratory parameters, and dynamic biomarker measurements—to establish reliable predictive models is of great importance for optimizing CRRT initiation strategies.
The furosemide stress test (FST) evaluates renal responsiveness to diuretics and indirectly reflects renal blood flow and tubular concentrating capacity. It has been widely used as a simple method to assess the severity of renal functional impairment16,17,24 In the present study, patients with negative FST results (urine output <200 mL within 2 h) exhibited more pronounced renal cellular stress, higher levels of TIMP-2 and IGFBP-7, and more severe renal dysfunction, suggesting a higher likelihood of requiring early CRRT initiation. These findings are consistent with previous studies and indicate that FST may serve as a useful tool for assessing renal functional status in patients with SA-AKI25.
TIMP-2 and IGFBP-7 have emerged in recent years as important early biomarkers of acute kidney injury. Both are secreted by renal tubular epithelial cells, and their expression rapidly increases in response to renal injury, reflecting cellular stress and tubular damage26,27,28,29. In this study, we further incorporated dynamic measurements of these biomarkers at 2 h, 4 h, and 12 h after FST. We observed that the product of these two biomarkers reached its lowest level at 4 h after FST and gradually increased thereafter at 12 h, while consistently remaining higher in the RRT group. These findings suggest that dynamic monitoring of these biomarkers may more accurately reflect the progression of renal injury and provide more timely information for determining the optimal timing of CRRT initiation. Previous meta-analyses have also confirmed that urinary TIMP-2 * IGFBP-7 has good diagnostic value for early detection of acute kidney injury31. Moreover, our study demonstrated that TIMP-2 and IGFBP-7 were associated not only with traditional renal function indicators and disease severity scores, but also with systemic physiological parameters, including pH, serum creatinine, potassium levels, and procalcitonin. This indicates that these biomarkers can simultaneously reflect both local renal injury and systemic pathophysiological status. When combined with FST, they enable a multidimensional evaluation encompassing macroscopic renal function, microscopic cellular injury, and systemic physiological conditions.
Analysis of predictive performance showed that the area under the curve (AUC) values for FST, baseline TIMP-2 * IGFBP-7, and TIMP-2 * IGFBP-7 measured 2 h after FST were 0.88, 0.82, and 0.85, respectively. Although these individual indicators demonstrated certain predictive value, they still had notable limitations. This may be related to the complex pathogenesis of SA-AKI, which involves multiple interacting factors such as systemic inflammation and microcirculatory disturbances31,32. Conventional laboratory parameters, including serum creatinine, serum potassium, blood pH, serum albumin, and procalcitonin, are clinically important for evaluating renal dysfunction, electrolyte and acid-base disturbances, nutritional status, and systemic inflammatory burden. However, these variables are not specific measures of renal tubular functional reserve or tubular cellular stress. Because a separate laboratory-only model was not constructed in the present study, the incremental predictive value of the combined FST and urinary biomarker model over conventional laboratory parameters alone could not be directly quantified. The main innovation of this study lies in several aspects. First, we incorporated expanded clinical information, including additional laboratory indicators such as platelet count and lactate, which reflect systemic physiological status. Second, dynamic biomarker measurements at multiple time points (2 h, 4 h, and 12 h after FST) were included to more accurately capture the progression of renal injury. Third, we combined FST, which reflects macroscopic renal functional reserve, with TIMP-2 * IGFBP-7, which reflects microscopic cellular injury, to construct a multidimensional predictive model. The results demonstrated that the combined model achieved an AUC of 0.97 for predicting RRT requirement within 7 days, with a sensitivity of 0.85 and specificity of 0.91. These findings suggest that the combined model provides a comprehensive evaluation spanning macroscopic renal function, microscopic molecular injury, and systemic inflammatory status.
In the analysis of clinical outcomes, no significant differences were observed in hospital length of stay or 28-day mortality between the RRT and non-RRT groups. However, the major advantage of the combined strategy compared with FST alone was reflected in its reclassification performance. Specifically, the combined model correctly reclassified 79.1% of false-positive cases, with a category-free net reclassification improvement (NRI) of 69.1% (95% CI: 0.43–0.96, P < 0.001; Supplemental Table S1). These findings further support the clinical value of the combined model. By more accurately predicting RRT requirement within 7 days, the model may help identify patients who require closer monitoring. The intensity of renal support therapy has also been shown to influence the prognosis of patients with AKI33. Therefore, future studies may further explore the synergistic optimization of the combined predictive model and RRT treatment intensity.
This study has several strengths. It was designed as a two-center prospective diagnostic prediction study, conducted in accordance with medical ethical standards, and employed standardized laboratory testing procedures. In addition, comprehensive clinical data were collected, and a combined predictive model was constructed using multivariate logistic regression analysis. Nevertheless, several limitations should be acknowledged. First, the sample size was relatively small (63 patients), which may increase the risk of overfitting and limit the generalizability of the findings. Second, department source, infection site, and center effects may have influenced the results. Third, treatment-decision bias related to clinical RRT initiation practices could not be fully excluded. Fourth, FST was administered according to predefined clinical indications after SA-AKI diagnosis rather than at a strictly fixed time point after ICU admission. Although this approach reflects real-world ICU practice, residual timing-related bias cannot be completely excluded. In addition, FST was assessed at a single time point in the present study. Repeated or serial FST assessments, particularly when combined with dynamic urinary biomarker monitoring, may provide a more comprehensive evaluation of renal functional reserve and help reduce potential bias from single-time-point testing. Fifth, urinary TIMP-2 and IGFBP-7 were not normalized to urinary creatinine, and formal calibration analysis was limited. Finally, the follow-up period was relatively short, focusing only on 28-day mortality and hospital length of stay, without assessing long-term outcomes such as renal function recovery or one-year survival. Future multicenter studies with larger sample sizes, subgroup analyses, long-term follow-up, and serial FST assessment are needed to further validate the applicability and clinical translation value of this predictive model.
Disclosures
Loading...
$$\rightleftharpoonup{xx}$$
$$\longleftharp{xx}$$,
$$\longrightharp{xx}$$,
The authors have no conflicts of interest to disclose.
Author Contributions:
Shujuan Ning and Xiaojun Yang designed the study. Shujuan Ning, Jingyan Chen, Jinlan Ma, Shenglin Su, and Bo Li enrolled patients and collected clinical data and samples. Shujuan Ning analyzed the data and drafted the manuscript. Xiaojun Yang revised the manuscript. All authors approved the final manuscript.
Acknowledgements
Loading...
$$\rightleftharpoonup{xx}$$
$$\longleftharp{xx}$$,
$$\longrightharp{xx}$$,
This work was supported by the Key Research and Development Program of Social Development (Health) of Zhongwei City (2024shfz007).
Materials
| Name | Company | Catalog Number | Comments |
|---|---|---|---|
| Automated Biochemical Analyzer | Mindray Bio-Medical Electronics Co., Ltd., Shenzhen, China | BS-800 | |
| Biosafety Cabinet | Airtech (Suzhou) Co., Ltd., Suzhou, China | BSC-1300IIA2 | |
| Blood Gas Analyzer | Edan Instruments, Inc., Shenzhen, China | i15 | |
| Centrifuge (Low-speed refrigerated centrifuge) | Xiangyi Centrifuge Instrument Co., Ltd., Changsha, China | H1850 | |
| ELISA Kit for IGFBP-7 | Elabscience Biotechnology Co., Ltd., Wuhan, China | E-EL-H5567 | |
| ELISA Kit for TIMP-2 | Elabscience Biotechnology Co., Ltd., Wuhan, China | E-EL-H0003 | |
| ELISA Microplate Reader | Rayto Life and Analytical Sciences Co., Ltd., Shenzhen, China | RT-6100 | |
| ELISA Plate Washer | Rayto Life and Analytical Sciences Co., Ltd., Shenzhen, China | RT-2600C | |
| Furosemide | Not specified in submission files | Not specified in submission files | Administered intravenously at 1.0–1.5 mg/kg for FST |
| Infusion Pump | Mindray Bio-Medical Electronics Co., Ltd., Shenzhen, China | BeneFusion SP5 | |
| Micropipette | Dragon Laboratory Instruments Co., Ltd., Shanghai, China | TopPette | |
| Microplate (96-well ELISA plate) | Elabscience Biotechnology Co., Ltd., Wuhan, China | E-EL-Plate96 | |
| Multiparameter Patient Monitor | Mindray Bio-Medical Electronics Co., Ltd., Shenzhen, China | BeneVision N12 | |
| Pipette Tips (200 μL) | Dragon Laboratory Instruments Co., Ltd., Shanghai, China | T-200 | |
| R software | Not specified in submission files | Not specified in submission files | Used for statistical analyses |
| Refrigerated Storage (4 °C Medical Refrigerator) | Haier Biomedical Co., Ltd., Qingdao, China | HYC-290 | |
| Sterile Sample Tubes | Kangjian Medical Supplies Co., Ltd., Jiangsu, China | KJ-ST02 | |
| Ultra-Low Temperature Freezer (-80 °C) | Haier Biomedical Co., Ltd., Qingdao, China | DW-86L388 | |
| Urine Collection Tubes | Kangjian Medical Supplies Co., Ltd., Jiangsu, China | KJ-UT01 |
Reprints and Permissions
Request permission to reuse the text or figures of this JoVE article
Request Permission