Here, we present a protocol to identify endoplasmic reticulum stress-related immune signatures in atrial fibrillation by integrating public bulk transcriptomics, machine learning, immune infiltration analysis, and single-cell transcriptomics for reproducible biomarker prioritization and cell-type localization.
Research Article
Endoplasmic Reticulum Stress-Related Immune Signature in Atrial Fibrillation: Machine Learning and Single-Cell Transcriptomics
* These authors contributed equally
In This Article
Summary
Abstract
This study describes a reproducible computational workflow for identifying endoplasmic reticulum stress (ERS)-related gene signatures in atrial fibrillation (AF) by integrating bulk transcriptomics, machine learning, immune infiltration analysis, and single-cell transcriptomics. Public bulk transcriptomic datasets were retrieved from the Gene Expression Omnibus (GEO), followed by phenotype harmonization, normalization, batch-effect correction, and differential expression analysis. Weighted gene co-expression network analysis (WGCNA) was combined with ERS-related gene sets to identify candidate ERS-associated genes. A multi-algorithm machine-learning framework was then used to compare feature-selection and model-fitting strategies. The selected model was evaluated in an independent external validation cohort (GSE115574) and further assessed in an additional cohort (GSE14975), with discriminatory performance quantified by receiver operating characteristic (ROC) analysis and the area under the curve (AUC). Using this workflow, 22 ERS-related core genes were identified, and an 18-gene Elastic Net (Enet) model showed the highest overall discriminatory performance across the training and validation cohorts. SHapley Additive exPlanations (SHAP) analysis highlighted the major contribution of genes such as RPS11, NCF2, and S100A4 to model prediction. Immune deconvolution and single-cell transcriptomic analysis further mapped the ERS-related signature predominantly to the monocyte-macrophage lineage, suggesting its potential involvement in AF-associated immune remodeling. This workflow provides a reproducible strategy for linking disease-associated transcriptomic signatures to specific immune cell populations and can be adapted to other disease contexts with suitable bulk and single-cell datasets.
Introduction
Atrial fibrillation (AF) is the most common sustained arrhythmia in clinical practice, characterized by disordered electrical activity in the atria and loss of mechanical function. It significantly increases the risks of stroke, heart failure, and all-cause mortality, becoming a major global public health burden1. Current clinical management of AF faces significant challenges: traditional antiarrhythmic drugs have limited long-term efficacy in maintaining sinus rhythm, and their adverse effects, such as arrhythmias and cardiotoxicity, limit their continuous use2,3. Catheter ablation also remains challenging in maintaining long-term sinus rhythm for persistent AF4. Novel treatment strategies are currently limited by the lack of a systematic understanding of the molecular landscape of upstream mechanisms of AF, which hampers the identification and translation of precise targets. Research has shown that the pathological progression of AF involves complex interactions across multiple dimensions, including electrical, structural, and autonomic nervous system remodeling. Among these, atrial structural remodeling, centered around myocardial fibrosis, is a key mechanism for the maintenance of AF5,6,7.
Therefore, elucidating the upstream stress pathways that drive fibrosis is one of the keys to overcoming the therapeutic bottleneck in persistent AF. Recent studies suggest that endoplasmic reticulum stress (ERS), a pivotal regulatory hub that enables cells to cope with intra- and extracellular perturbations, is a highly conserved adaptive response triggered when ER homeostasis is disrupted, leading to excessive accumulation of unfolded or misfolded proteins within the ER lumen. ERS may participate in atrial remodeling by regulating proteostasis, calcium cycling, inflammatory responses, and apoptosis8,9. However, the upstream triggers, key effector molecules, and downstream pathways of ERS in AF have not yet been systematically characterized, making it difficult to define its critical nodes and actionable intervention points in atrial remodeling.
Compared with traditional bulk transcriptomic studies, multi-omics integration can yield more robust population-level disease-associated signals. Moreover, incorporating single-cell transcriptomics enables the dissection of cellular heterogeneity and the identification of the cellular sources of these signals, thereby mapping association results to specific cell types and their potential interaction pathways. This provides a foundation for subsequent mechanistic investigations and target prioritization. In the present study, AF-related bulk transcriptomic and single-cell transcriptomic datasets were retrieved from the Gene Expression Omnibus (GEO) database. ERS-related core modules were identified through differential expression analysis and weighted gene co-expression network analysis (WGCNA). By integrating single-cell analyses, key molecules were further localized to specific cell types and their interaction networks. Collectively, this study aims to delineate ERS-related key networks in AF and their associations with structural remodeling, thereby providing a rationale for target discovery and mechanism-driven, stratified therapeutic strategies.
Compared with single-dataset differential expression analysis or single-algorithm biomarker screening, this workflow improves robustness and interpretability by integrating cross-cohort validation, biologically constrained feature selection, multi-algorithm model comparison, immune deconvolution, and single-cell transcriptomics. These steps help prioritize reproducible ERS-related signatures and localize bulk-derived signals to specific immune cell populations and interaction networks. This workflow is suitable for studies using public or in-house transcriptomic datasets with well-defined disease and control groups, comparable tissue sources, adequate sample size, and available phenotype annotations. It is particularly useful for hypothesis generation, biomarker prioritization, and cell-type localization of disease-associated molecular programs. However, its performance depends on dataset quality, phenotype consistency, and effective batch-effect correction; therefore, candidate signatures identified by this workflow require validation in independent cohorts and experimental models before clinical translation. The overall study workflow is shown in Figure 1.
Protocol
In accordance with the Measures for Ethical Review of Life Science and Medical Research Involving Human Subjects promulgated in China on February 18, 2023, research using publicly available data may meet the criteria for exemption from ethical review. This study used only publicly available, de-identified secondary transcriptomic data and did not involve new human participant recruitment, human sample collection, or animal experiments. Therefore, additional institutional ethical approval was not required. No animal experiments were performed in this study. Therefore, approval from the institutional animal care and use committee was not applicable.
Data sources for endoplasmic reticulum stress-related genes in atrial fibrillation
In this study, publicly available AF-related transcriptomic datasets were retrieved from the GEO database, including GSE41177, GSE79768, GSE115574, GSE14975, and GSE165838. Detailed information on the GSE datasets is provided in Supplementary File 1—Supplementary Table S1. GSE41177 and GSE79768 were used to construct the integrated bulk transcriptomic training cohort, whereas GSE115574 and GSE14975 were used as two independent external validation cohorts. GSE165838 was used for single-cell transcriptomic analysis. Because these datasets were generated on different platforms and may differ in tissue source, clinical background, and sample composition, each dataset was preprocessed separately according to its platform characteristics prior to integration or validation. Batch-effect correction was then performed using the sva R package for the merged training cohort. The endoplasmic reticulum stress-related gene set was retrieved from the GeneCards database with a relevance score ≥ 3 and, after deduplication, formed the target gene list used in this study.
Analysis of differentially expressed genes
After data standardization and normalization, the R package limma was used to identify differentially expressed genes (DEGs) in the integrated training set. DEGs were defined using the following significance criteria: false discovery rate-adjusted P value (adj.P.Val) < 0.05 and |log2FC| > 0.58510. To visualize the expression patterns of DEGs, volcano plots and heatmaps were generated using the ggplot2 and pheatmap packages, respectively.
WGCNA analysis
To elucidate potential mechanisms of coordinated gene regulation, define the association patterns between co-expression modules and clinical trait variables, and identify core biomarkers or therapeutic targets with translational potential, WGCNA was applied11.
A weighted co-expression network was constructed using the WGCNA package in R. The soft-thresholding power (β) was selected according to the scale-free topology criterion; the corresponding β value was chosen for subsequent analyses when the scale-free topology fit index (R2) reached and remained above 0.8512. During module identification, parameters related to dynamic tree cutting and module detection sensitivity were optimized to improve module boundary resolution and stability. Finally, modules significantly associated with the target trait were extracted, and intramodular hub genes were identified as candidate gene sets for downstream analyses.
Enrichment analysis of AF-related DEGs
To precisely identify hub genes, the DEGs were first intersected with genes from the key WGCNA modules to define a set of genes implicated in AF pathogenesis. Next, this AF gene set was further intersected with ERS-related genes, and the resulting overlapping genes were retained for subsequent analyses.
Functional enrichment of the screened genes was evaluated using Gene Ontology (GO) and Kyoto Encyclopedia of Genes and Genomes (KEGG) analyses. GO terms were analyzed with the R package clusterProfiler to summarize enrichment across biological process (BP), cellular component (CC), and molecular function (MF) categories13. KEGG analysis was then used to identify enriched pathways associated with the target genes14. Enrichment results with an adjusted P value < 0.05 were considered statistically significant. The leading GO terms and KEGG pathways were displayed as bar plots and bubble plots using ggplot2.
Protein-protein interaction (PPI) analysis
PPI analysis was performed by uploading the intersected gene set to the STRING database, with the organism restricted to Homo sapiens. Disconnected nodes were removed, and interactions were retrieved using a medium confidence score threshold (combined score ≥ 0.4). The resulting PPI network was then imported into a network visualization and analysis tool for topological analysis to identify key nodes.
Construction of a candidate AF-ERS classification model based on 12 machine-learning algorithms
In this study, an ensemble classification framework based on twelve conventional machine-learning algorithms was developed to screen ERS-related candidate signature genes associated with AF and to optimize classification performance. For data partitioning, after standardization and normalization, GSE41177 and GSE79768 were merged to generate the training cohort expression matrix. GSE115574 was used as an independent external validation cohort to evaluate model generalizability. Specifically, DEGs were first identified in the training cohort (|log2FC| >0.585, adjusted p < 0.05). These DEGs were then intersected with genes from the key WGCNA modules and ERS-related genes, and the resulting gene set was used as the input features for model construction.
To link ERS-related genes with the AF phenotype, a candidate classification model was developed using 12 machine-learning approaches: Lasso, Ridge, stepwise generalized linear model (Stepglm), extreme gradient boosting (XGBoost), random forest (RF), elastic net (Enet), partial least squares regression for generalized linear models (plsRglm), generalized boosted regression modeling (GBM), naive Bayes, linear discriminant analysis (LDA), glmBoost, and support vector machine (SVM). A systematic combinatorial modeling strategy was adopted by adding a second algorithm to the first and integrating them via the tuning parameter α, yielding 113 combinations of feature selection and model fitting that were comprehensively evaluated. Model discrimination was assessed by calculating the area under the receiver operating characteristic curve (AUC). According to previously reported model-selection criteria, the final candidate framework was defined as the model with the best overall performance, as assessed by the mean AUC across the training and validation cohorts.
This combinatorial modeling strategy was informed by prior studies in biomedical machine learning15,16,17. Collectively, these studies indicate that no single algorithm consistently outperforms others across datasets and analytical tasks. Based on this premise, adopting an ensemble learning and combinatorial modeling framework can increase the likelihood of obtaining a high-performing candidate model with more stable generalizability and improve the robustness of model selection.
Subsequently, SHapley Additive exPlanations (SHAP) values were applied to interpret the machine-learning model by visualizing the key features driving AF classification, thereby quantifying the contribution of each feature to the predicted outcome and illustrating how individual signature genes influence the final model output18.
Evaluation of model performance and external validation of the optimal model
The performance of the optimal model was evaluated in the training cohort and in the independent external validation cohort (GSE115574). At the model level, a confusion matrix was constructed based on the predicted class labels, and the corresponding classification metrics were reported. Receiver operating characteristic (ROC) curves were generated using the R package pROC, and the AUC was calculated to quantify discriminative performance.
At the biomarker level, single-gene ROC curves were plotted for each key gene in the optimal model, and the corresponding AUCs were computed to assess their individual discriminatory ability. In addition, differential expression of the key genes was summarized using a volcano plot, and boxplots were used to depict their expression distributions in disease versus healthy samples. To further evaluate the generalizability of the previously defined optimal model-derived gene signature, an additional independent external validation was performed using GSE14975. GSE14975 contains transcriptomic data from left atrial appendage samples, including five atrial fibrillation samples and five sinus rhythm/control samples. All genes included in the locked signature were available in this dataset. To maintain consistency with the original cross-cohort analytical workflow, the development cohort and GSE14975 were harmonized using ComBat with the dataset source as the batch variable. This harmonization was performed in an unsupervised manner. Importantly, disease/control labels from GSE14975 were not used for feature selection, coefficient estimation, threshold determination, or hyperparameter tuning.
The optimal model-derived scoring model was fitted using the development cohort only and then applied to GSE14975 for external validation. Model performance in GSE14975 was assessed using receiver operating characteristic curve analysis, area under the curve, 95% confidence interval (CI), sensitivity, specificity, accuracy, positive and negative predictive values, and Brier score. In addition, single-gene ROC curves were generated for all optimal model-derived genes in GSE14975 to illustrate their individual discriminatory ability. To further assess potential overfitting in the development cohort, repeated 10-fold cross-validation and bootstrap optimism correction were performed using the gene signature derived from the locked optimal model. For repeated cross-validation, the development cohort was repeatedly partitioned into 10 folds, and model discrimination was summarized across all iterations. For bootstrap validation, 1,000 bootstrap resamples were generated to estimate the optimism of the apparent development-set performance and to calculate the optimism-corrected AUC. Because the final signature was derived from the optimal model, the contribution of each gene was interpreted primarily according to the absolute magnitude and direction of the model coefficients. In addition, single-gene ROC analyses were performed in GSE14975 to illustrate the individual discriminatory ability of each component gene. For visualization purposes, single-gene ROC curves were oriented to reflect discriminatory ability regardless of whether higher or lower expression was associated with AF.
Gene set enrichment analysis (GSEA)
To explore the functional implications of the key genes, GSEA was performed using samples from the disease group19. For each key gene, samples were stratified into high- and low-expression subgroups using the median expression value in the disease group as the cutoff. The mean expression difference between the two subgroups for each gene was calculated, and a ranked gene list was generated in descending order as input for enrichment analysis. GSEA was conducted using the R package clusterProfiler, with gene sets obtained from the MSigDB collection c2.cp.kegg.Hs.symbols.gmt. Statistical significance was defined as p < 0.05. Enrichment direction was determined by the sign of the normalized enrichment score (NES), and enrichment plots were generated for representative pathways.
Assessment of immune cell subtype abundance and differential expression
The CIBERSORT deconvolution algorithm was applied to estimate the relative abundance of infiltrating immune cell subsets and their interrelationships across samples. Based on the LM22 leukocyte signature matrix, immune cell composition was quantitatively inferred from gene expression profiles using the R package CIBERSORT20. A threshold of p < 0.05 was used to filter results, and only samples passing this criterion were retained for subsequent analyses. Boxplots were generated to compare the estimated relative fractions of immune-cell subsets between the AF and control groups. In addition, Spearman's correlation analysis was performed to assess associations between immune cell infiltration levels and hub gene expression.
Single-cell analysis
Single-cell transcriptomic analysis was performed using the GEO dataset GSE165838. Raw gene-cell count matrices were imported into R and processed using Seurat v4.4.0. For each sample, a Seurat object was generated using CreateSeuratObject with min.cells = 5 and min.features = 300. Quality-control metrics, including the number of detected genes, total unique molecular identifier (UMI) counts, mitochondrial gene percentage, ribosomal gene percentage, and hemoglobin gene percentage, were calculated for each cell. Cells were retained if they had more than 500 detected genes, fewer than 5,000 UMI counts, mitochondrial gene percentage < 25%, ribosomal gene percentage > 3%, and hemoglobin gene percentage < 1%. Genes detected in fewer than three cells were removed. MALAT1 and mitochondrial genes were also excluded before downstream analysis. DoubletFinder was used to detect and exclude potential doublets. Briefly, cells were split by sample identity, and doublet detection was performed separately for each sample using principal components 1–30.
The pN parameter was set to 0.25, and the optimal pK value was selected according to the maximal BC metric obtained from parameter sweeping. The expected doublet rate was estimated according to the number of recovered cells in each sample, with rates of 2.5%, 5%, and 6.5% used for samples with relatively low, intermediate, and high cell numbers, respectively. Only cells classified as singlets were retained. Ambient RNA contamination was further estimated using DecontX, and cells with a contamination score ≥ 0.2 were excluded. After quality control, doublet removal, and ambient RNA filtering, 40,886 cells and 23,947 genes were retained for downstream analysis. The filtered single-cell dataset was normalized with the LogNormalize method using a scale factor of 10,000, followed by identification of highly variable genes. The data were then scaled before principal component analysis.
To reduce sample-specific batch effects, Harmony was applied using orig.ident as the batch variable. Uniform Manifold Approximation and Projection (UMAP) visualization and nearest-neighbor graph construction were performed using the first 15 Harmony-corrected dimensions21. Clustering was performed using the Louvain algorithm, and multiple clustering resolutions were evaluated. The final major cell-type annotation was based on the clustering result at resolution 0.05. Cell clusters were manually annotated according to canonical marker-gene expression. This marker-based annotation strategy is consistent with prior single-cell immune-profiling studies22. T cells were identified by CD3D, CD3E, and TRAC; natural killer (NK) cells by NKG7, GNLY, NCAM1, and KLRG1; monocyte-macrophage cells by LYZ, CD14, FCGR3A, CD68, CD163, FCN1, TYROBP, S100A8, and S100A9; B cells by MS4A1 and CD79A; plasma cells by MZB1 and XBP1; endothelial cells by PECAM1, VWF, and CDH5; vascular smooth muscle cells by ACTA2, TAGLN, MYH11, and MYL9; fibroblasts by DCN, LUM, COL1A1, COL1A2, and PDGFRA; neutrophil-like cells by FCGR3B, CXCR2, S100A8, and MPO; mast cells by TPSB2; and dendritic cells by LILRA4, CD1C, and XCR1. Marker-gene expression across clusters was visualized using dot plots, and the expression distribution of the final ERS-related hub genes was visualized on UMAP embeddings.
To quantify ERS-related transcriptional activity at the single-cell level, the final hub-gene set was used to calculate cell-wise signature scores using AUCell, single-sample gene set enrichment analysis, and Seurat AddModuleScore. For AUCell, cell rankings were constructed from the normalized RNA expression matrix, and AUC scores were calculated using the hub-gene set with the top 10% of ranked genes as the maximum ranking threshold. For ssGSEA, enrichment scores were calculated using the GSVA package. The three scoring outputs were centered and scaled, then min-max normalized, and finally summed to generate an integrated ERS-related composite score for each cell. The distribution of the composite score was compared across annotated cell populations to evaluate cell-type heterogeneity of the ERS-related program. Because the monocyte-macrophage lineage exhibited prominent ERS-related signature enrichment and was closely associated with immune-inflammatory remodeling, it was selected for subsequent within-lineage analyses. Monocyte-macrophage cells were divided into high- and low-score groups according to the median ERS-related composite score. Pseudotime trajectory analysis was then performed on monocyte-macrophage cells using Monocle.
For pseudotime analysis, a CellDataSet object was created from the raw count matrix using a negative binomial expression model. Size factors and dispersions were then estimated. Ordering genes were selected using a mean expression threshold of ≥ 0.1 and empirical dispersion greater than the fitted dispersion. Dimensionality was reduced with the DDRTree algorithm, and cells were ordered along the inferred trajectory. The dynamic expression patterns of ERS-related hub genes along pseudotime were visualized. Cell-cell communication analysis was performed using CellChat to explore potential ligand-receptor interactions involving monocyte-macrophage cells with different ERS-related scores. For this analysis, monocyte-macrophage cells were labeled as high-score or low-score according to the median composite score, while other cells retained their original cell-type labels. The normalized RNA expression matrix and corresponding cell-group annotations were used to create the CellChat object. For cell-cell communication analysis, the human CellChatDB database was selected, and only secreted signaling interactions were evaluated. Overexpressed genes and ligand-receptor pairs were detected before calculating communication probabilities. Cell groups containing fewer than 10 cells were excluded from the interaction analysis. Pathway-level communication probabilities were subsequently estimated and aggregated to compare the number and strength of interactions among cell populations. To facilitate reproducibility, a checkpoint table is provided below linking each protocol step to its corresponding expected output figure or table (Supplementary File 1—Supplementary Table S2).
Results
Identification of differentially expressed genes in AF
To improve comparability across cohorts, two AF-related transcriptomic datasets (GSE41177 and GSE79768) were integrated, and batch effects were corrected on the merged expression matrix. Figure 2A,B shows boxplots of global expression distributions before and after batch-effect correction, which were used to evaluate whether expression intensity distributions were comparable across samples. Figure 2C,D shows principal component analysis (PCA) plots before and after batch-effect correction, which were used to evaluate sample-level clustering patterns and cohort-related separation. After correction, the global expression distributions became more consistent, and the systematic separation between cohorts was markedly attenuated in PCA space, suggesting that batch effects were effectively mitigated. Differential expression analysis was then conducted using the batch-corrected combined dataset. With FDR < 0.05 and |log2FC|>0.585 as the significance thresholds, a total of 181 DEGs were identified. The volcano plot showed a clear distribution of DEGs by effect size and statistical significance (Figure 2E). Furthermore, the top 50 DEGs ranked by significance were selected to generate a clustered heatmap, which revealed a distinct separation in expression profiles between the AF and control groups (Figure 2F), indicating that this DEG signature can effectively discriminate AF samples from normal controls.
Identification of AF-related co-expression modules by WGCNA
In the WGCNA, module-trait correlation analysis revealed that multiple modules exhibited varying degrees of association with the AF phenotype. Among them, the MEbrown module demonstrated the strongest positive correlation with AF (r = 0.437, P = 0.00034), whereas the MEgreen module exhibited the strongest negative correlation (r = -0.324, P = 0.0095) (Figure 3A), suggesting that these modules may be closely involved in AF onset and progression. To construct a robust co-expression network, soft-threshold analysis indicated that a soft-thresholding power of β = 12 best satisfied the scale-free topology criterion (Figure 3B). Using this parameter, a total of nine co-expression modules were identified (Figure 3C). The MEbrown and MEgreen modules comprised 394 genes and were carried forward for subsequent analyses.
Functional enrichment analysis of core genes and construction of the protein–protein interaction network
By intersecting DEGs, ERS-related genes, and genes from the key WGCNA module, 22 core genes were ultimately identified (Figure 4A). GO and KEGG enrichment analyses were performed for these core genes, with FDR < 0.05 considered statistically significant. GO annotation indicated that the significantly enriched terms were predominantly related to immune-associated biological processes and molecular functions, including leukocyte aggregation, antigen processing and presentation, and major histocompatibility complex (MHC)-related terms (Figure 4B,C). KEGG pathway analysis identified 30 significantly enriched pathways (Figure 4D), largely involving immune-inflammation and adaptive immune differentiation signaling, including Th1 and Th2 cell differentiation, the IL-17 signaling pathway, and the chemokine signaling pathway. Collectively, these results suggest that the core genes are closely linked to immune-inflammatory functional modules, providing clues for subsequent mechanistic investigations.
To further evaluate protein-level interactions among the core genes, a PPI network was constructed, followed by topological analysis and visualization (Figure 4E). The resulting network comprised 20 nodes (two genes were excluded because they had no recorded interactions) and exhibited high overall connectivity. Based on degree centrality, the top-ranked hub genes included TYROBP, HLA-DRA, NCF2, S100A9, S100A8, CXCL1, and RAC2, suggesting that they may represent key candidate nodes involved in AF-associated immune-inflammatory responses and ERS-related pathological processes.
Machine-learning results and validation of the core gene expression signature
Among the 113 machine-learning combinations evaluated in this study, the elastic net regression model (Enet [α = 0.2]) achieved the best overall predictive performance. The composite AUC was defined as the mean AUC across the training and independent validation cohorts (mean AUC = 0.870; training AUC = 1.000; validation cohort GSE115574 AUC = 0.740) (Figure 5A). In the independent validation cohort GSE115574, ROC analysis demonstrated that the model retained discriminatory capability (AUC = 0.740, 95% CI 0.608–0.859) (Figure 5B). In the training cohort, the model yielded an AUC of 1.000 (95% CI 1.000–1.000) (Figure 5C). Confusion matrices further illustrated differences in classification performance between the external validation and training cohorts (Figure 5D,E), indicating variability in generalizability across datasets.
Using this optimal model, 18 key feature genes were selected: AADAC, ALOX5AP, BCHE, CXCL1, CXCR4, HLA-DPB1, HLA-DQA1, IER3, MGAM, NCF2, RAC2, RPS11, S100A4, S100A8, S100A9, TYROBP, UTS2, and WT1. A nomogram based on these 18 genes was subsequently constructed to facilitate individualized risk scoring and model interpretability (Figure 5F). In single-gene discriminatory performance evaluation, ROC analysis indicated that RPS11 (AUC = 0.929) and NCF2 (AUC = 0.890) showed particularly strong discriminative power, followed by S100A4 (AUC = 0.869), MGAM (AUC = 0.855), and IER3 (AUC = 0.853) (Figure 5G). Moreover, the differential expression volcano plot suggested that these key feature genes were significantly differentially expressed between case and control groups (Figure 5H), supporting their relevance as model features at the transcriptomic level.
To further assess the external generalizability of the Enet [α = 0.2]-derived 18-gene signature, an additional validation analysis was performed in GSE14975. This dataset included 10 left atrial appendage samples, consisting of five AF samples and five sinus rhythm/control samples. All 18 signature genes were available in the GSE14975 expression matrix. Using the manuscript-consistent unsupervised ComBat harmonization strategy, the locked 18-gene signature achieved an AUC of 0.840 in GSE14975 (95% CI: 0.568–1.000) (Supplementary File 1—Supplementary Table S3 and Supplementary Figure S1). At the development-derived threshold, the sensitivity, specificity, and accuracy were all 0.800 (Supplementary File 1—Supplementary Table S3 and Supplementary Figure S2). These findings provide preliminary supportive evidence that the 18-gene signature may retain discriminatory ability in an independent AF-related transcriptomic dataset. Sample-level predicted probabilities in GSE14975 are provided in Supplementary File 1—Supplementary Table S4. At the individual gene level, several signature genes showed moderate-to-high discriminatory ability in GSE14975, including CXCL1 (AUC = 0.88), CXCR4 (AUC = 0.88), S100A8 (AUC = 0.80), HLA-DPB1 (AUC = 0.76), and IER3 (AUC = 0.76) (Supplementary File 1—Supplementary Table S5). The single-gene ROC curves for all 18 signature genes are provided in Supplementary File 1—Supplementary Figure S3 and Supplementary Figure S4. To further evaluate the stability of the signature within the development cohort, repeated internal resampling was performed. The mean AUC from repeated 10-fold cross-validation was 0.878, and bootstrap optimism correction yielded a corrected AUC of 0.945 (Supplementary File 1—Supplementary Table S6). These findings suggest that the apparent development-set performance was optimistic, but that the signature retained relatively high discriminatory ability after internal correction. Coefficient-based interpretation showed that several genes contributed more strongly to the locked signature, as indicated by the absolute magnitudes of their regression coefficients (Supplementary File 1—Supplementary Table S7 and Supplementary Figure S5). In addition, single-gene ROC analysis in GSE14975 indicated that several component genes retained moderate-to-high individual discriminative ability, supporting their contribution to the overall signature. Detailed coefficient rankings and single-gene ROC plots are provided in Supplementary File 1.
SHAP interpretability analysis
SHAP was used to quantify each feature's contribution to the model's output. The global importance ranking indicated that RPS11 contributed the most to model prediction, followed by NCF2 and S100A4, and then S100A9, IER3, ALOX5AP, S100A8, UTS2, CXCR4, CXCL1, MGAM, WT1, BCHE, HLA-DPB1, and TYROBP (Figure 6A); the remaining features showed relatively lower contributions. SHAP dependence plots further demonstrated that higher RPS11 values were generally associated with decreased SHAP values, suggesting that elevated RPS11 expression correlates with a lower predicted probability of AF. In contrast, NCF2, S100A4, S100A8/S100A9, and UTS2, among others, exhibited increasing SHAP values with higher expression levels, indicating a positive contribution to AF prediction (Figure 6B). The SHAP summary (beeswarm) plot illustrated the overall distribution of feature values and contribution directions: lower RPS11 values tended to correspond to positive SHAP values, whereas higher RPS11 values tended to correspond to negative SHAP values; conversely, NCF2 and S100A4 showed a pattern in which higher values were associated with larger positive SHAP values (Figure 6C).
At the individual level, SHAP waterfall plots for a representative case sample showed a baseline output of E[f(x)] = 0.721. Given feature contributions—most notably a relatively low RPS11 value (RPS11 = 7.71)—the model output increased to f(x) = 0.934, with RPS11 providing the largest contribution (+0.139), followed by IER3 (+0.0396) and S100A4 (+0.0335) (Figure 6D,E). Collectively, these results indicate that the model predictions are largely driven by a small subset of key genes and exhibit a consistent pattern of interpretability at both the global and individual levels.
GSEA enrichment results
To further elucidate the potential functions of the key feature genes, single-gene GSEA was performed for each of the 18 feature genes, and representative results were visualized in Figure 7. GSEA revealed that samples with high expression of NCF2, S100A8/S100A9, and other key genes were significantly enriched for immune-related pathways, including cytokine signaling and antigen presentation (p < 0.05), suggesting that these genes are markers of an activated immune microenvironment in AF (Figure 7). For instance, immune-inflammatory pathways were more prominently enriched in samples with high expression of NCF2, S100A8/S100A9, ALOX5AP, and HLA-DPB1. In contrast, the enrichment profile associated with RPS11 was more indicative of differences in fundamental biological processes, such as energy metabolism and protein synthesis (Figure 7). Overall, the GSEA results suggest that these key feature genes are closely linked to immune-inflammatory functional modules, providing functional support for interpreting AF-related molecular mechanisms from the perspectives of the immune microenvironment and inflammatory responses.
Immune infiltration analysis
Based on the immune infiltration assessment, the relative proportions of 22 immune cell types were visualized across samples (Figure 8A). Between-group comparisons revealed significant differences in the infiltration levels of several immune cell subsets between the AF and control groups: CD8 T cells were significantly reduced in the AF group (p < 0.01), activated dendritic cells were also decreased (p < 0.05), whereas neutrophils showed the most pronounced increase in the AF group (p < 0.001) (Figure 8B). Correlation analysis of immune cell fractions further elucidated interrelationships among immune subsets (Figure 8C). Notably, certain cell populations exhibited strong negative correlations; for example, resting mast cells were markedly negatively correlated with activated mast cells, suggesting that immune cell state transitions may be associated with AF-related remodeling of the immune microenvironment (Figure 8C).
In addition, correlation analyses of the 18 key feature genes with immune cell infiltration proportions revealed significant associations with multiple immune cell subsets (Figure 8D). Collectively, these findings support the presence of an altered immune-inflammatory microenvironment in AF, from both the immune cell composition and gene-immune cell association perspectives, and provide clues for subsequent mechanistic studies.
Single-cell localization of key genes and stratified analysis in monocyte-macrophages
First, cell types were annotated based on the expression patterns of canonical marker genes for each population, which exhibited clear and cell-type-specific marker expression profiles (Figure 9A). The clustering results were subsequently visualized in UMAP space, and the major cell populations identified included NK cells, vascular smooth muscle cells, T cells, endothelial cells, monocyte-macrophages, B cells, inflammatory activated myeloid cells, and fibroblasts (Figure 9B). A heatmap of marker gene expression further highlighted transcriptomic differences across cell types, providing additional support for the above annotations (Figure 9C). On this basis, the single-cell expression distributions of the 18 key feature genes were visualized, revealing pronounced cell-type-biased expression patterns across different cell populations (Figure 9D). The composite score of the 18-gene signature (integrating AUCell, ssGSEA, and AddModuleScore) was next compared across cell types; consistent results across scoring methods indicated that this signature was generally elevated in monocyte-macrophages (Figure 9E). Accordingly, monocyte-macrophages were stratified into high- and low-score subgroups based on the signature score, and their gene expression characteristics were visualized (Figure 9F). Pseudotime trajectory analysis showed differential distribution patterns of the high- versus low-score subgroups across distinct stages of the trajectory, suggesting that the signature may be associated with monocyte-macrophage state transitions (Figure 9G). In addition, cell-cell interaction network analysis revealed extensive connectivity between the high- and low-score subgroups and other cell types, with denser links to immune-related populations, suggesting that intercellular communication within the immune microenvironment may contribute to the functional phenotypes associated with this signature (Figure 9H–K).
Collectively, the single-cell results suggest that the ERS-related signature is preferentially enriched in the monocyte-macrophage lineage and may be associated with monocyte-macrophage state transitions and altered intercellular communication patterns. These findings should be interpreted as association-based transcriptomic evidence rather than proof of a causal mechanism. The immune changes inferred from bulk transcriptomic deconvolution were further compared with those observed in the single-cell analysis. In the bulk analysis, neutrophils were increased in AF samples, whereas CD8 T cells and activated dendritic cells were decreased. In the single-cell analysis, the ERS-related signature was preferentially enriched in monocyte-macrophage cells, and inflammatory activated myeloid cells were identified as an additional myeloid population. These results are partially consistent in supporting myeloid-lineage involvement in AF-related immune remodeling. However, the dominant immune populations differed between the two analytical strategies, with bulk deconvolution emphasizing neutrophil changes and single-cell analysis highlighting monocyte-macrophage-associated ERS signature enrichment.
DATA AVAILABILITY
No new raw sequencing data were generated in this study. All raw and processed transcriptomic datasets analyzed in this protocol are publicly available from the Gene Expression Omnibus (GEO) database under accession numbers GSE41177, GSE79768, GSE115574, GSE14975, and GSE165838. All analysis scripts, example input files, and parameter settings are available at the GitHub repository: https://github.com/tengfeitcm/Endoplasmic-Reticulum.git.
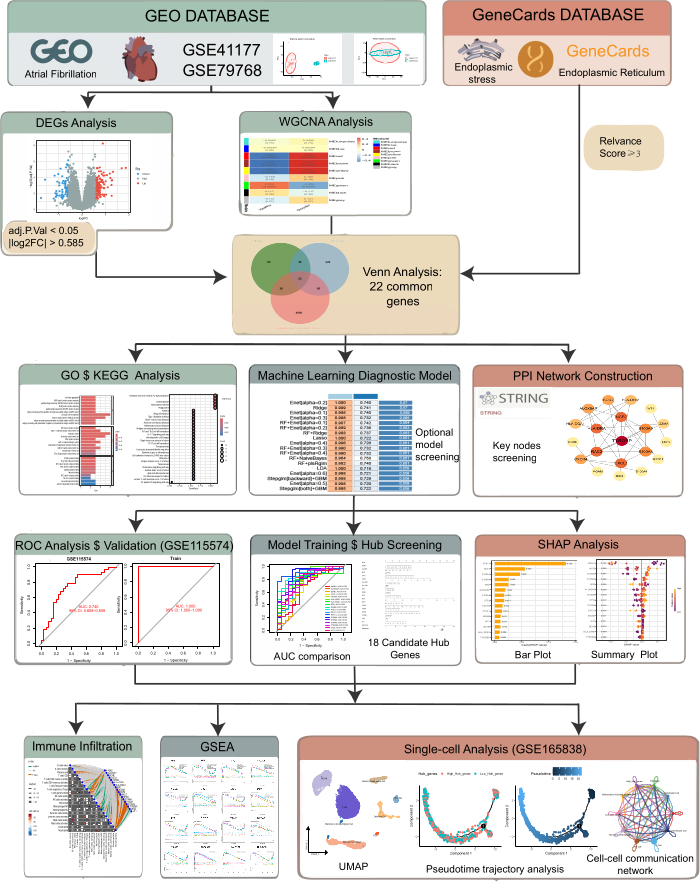
Figure 1. Flowchart of the data collection and analysis process. The flowchart outlines the major analytical stages from data retrieval to single‑cell mapping, including batch correction, differential expression analysis, WGCNA, ERS‑related gene selection, machine‑learning model building and validation, SHAP interpretation, immune infiltration analysis, and single‑cell characterization. Abbreviations: ERS = endoplasmic reticulum stress; SHAP = SHapley Additive exPlanations; WGCNA = weighted gene co-expression network analysis. Please click here to view a larger version of this figure.
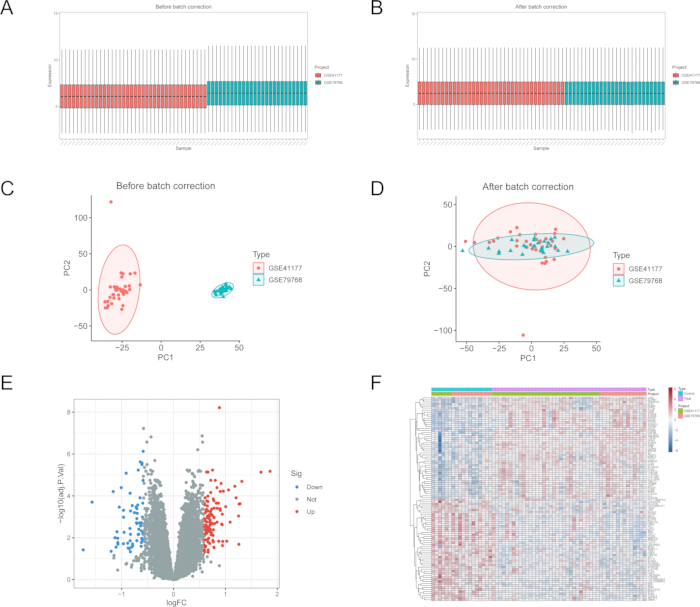
Figure 2. Batch correction and differential expression analysis of merged bulk cohorts. (A) Boxplots showing global expression distributions across samples before batch-effect correction. (B) Boxplots showing global expression distributions across samples after batch-effect correction. These panels evaluate the comparability of expression intensity distributions. (C) PCA plot before batch-effect correction showing sample-level clustering and cohort-related separation. (D) PCA plot after batch-effect correction showing reduced cohort-related separation. These panels evaluate the effect of batch correction on global sample clustering. (E) Volcano plot of DEGs between AF and controls. (F) Heatmap of DEGs across samples in the merged cohort. Abbreviations: AF = atrial fibrillation; DEGs = differentially expressed genes; PCA = principal component analysis. Please click here to view a larger version of this figure.
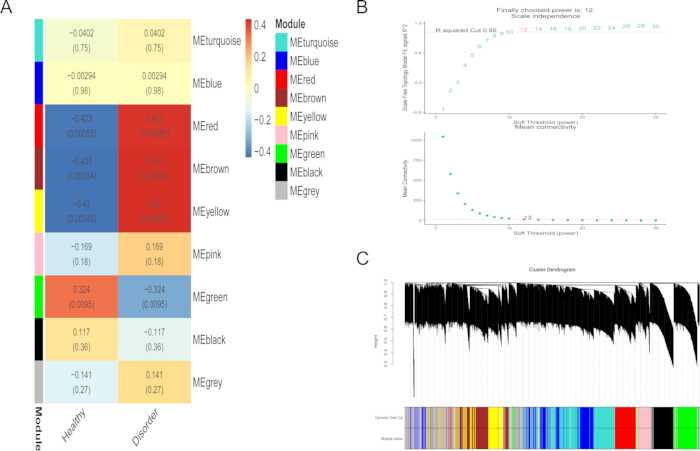
Figure 3. AF-associated co-expression modules identified by WGCNA. (A) Module-trait correlation heatmap. (B) Soft-threshold power selection for scale-free topology. (C) Gene clustering dendrogram with module assignment. Abbreviations: AF = atrial fibrillation; WGCNA = weighted gene co-expression network analysis. Please click here to view a larger version of this figure.
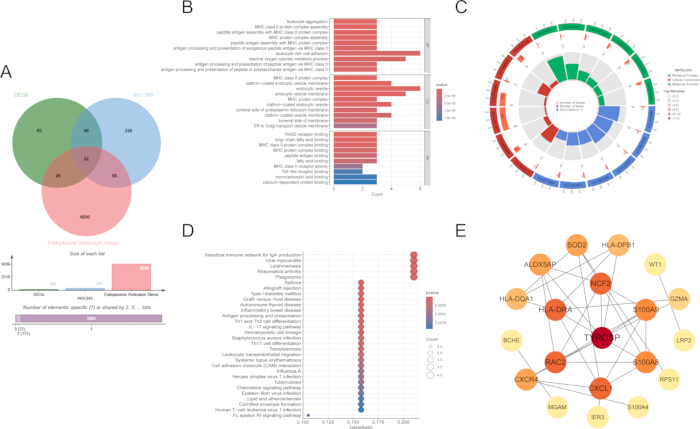
Figure 4. Screening and functional annotation of ERS-related core genes. (A) Venn diagram showing the intersection of DEGs, WGCNA module genes, and ERS-related genes. (B) GO enrichment bar plot of the 22 genes. (C) GO enrichment circle plot of the 22 genes. (D) KEGG pathway enrichment dot plot of the 22 genes. (E) PPI network constructed from the 22-gene set; 20 connected nodes are shown because two genes had no recorded interactions, with hub nodes highlighted. Abbreviations: DEGs = differentially expressed genes; ERS = endoplasmic reticulum stress; GO = Gene Ontology; KEGG = Kyoto Encyclopedia of Genes and Genomes; PPI = protein-protein interaction; WGCNA = weighted gene co-expression network analysis. Please click here to view a larger version of this figure.
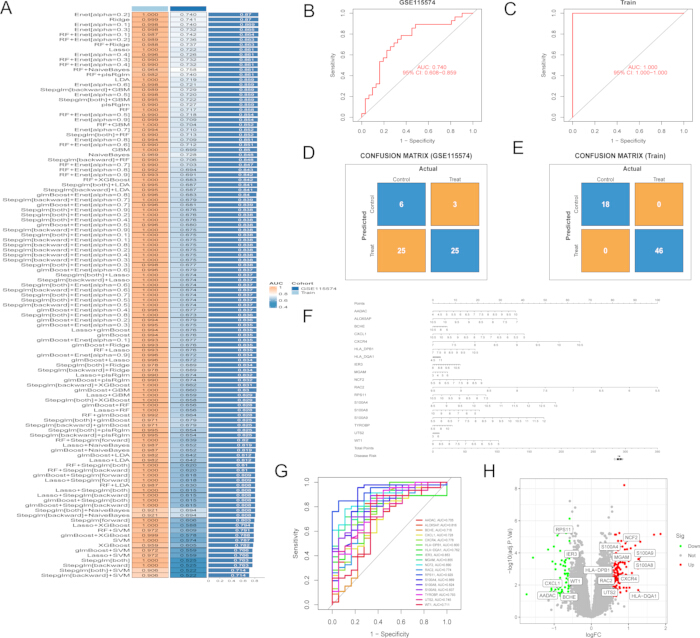
Figure 5. Machine-learning model selection and performance of the 18-gene Enet signature. (A) Heatmap of AUCs across 113 machine-learning model combinations. (B) ROC curve of the Enet model in the external validation cohort. (C) ROC curve of the Enet model in the training cohort. (D) Confusion matrix of the Enet model in the external validation cohort. (E) Confusion matrix of the Enet model in the training cohort. (F) Nomogram based on the 18-gene Enet signature. (G) ROC curves for individual signature genes in the training cohort. (H) Volcano plot highlighting the 18 signature genes. Abbreviations: AUC = area under the curve; Enet = elastic net; ROC = receiver operating characteristic. Please click here to view a larger version of this figure.
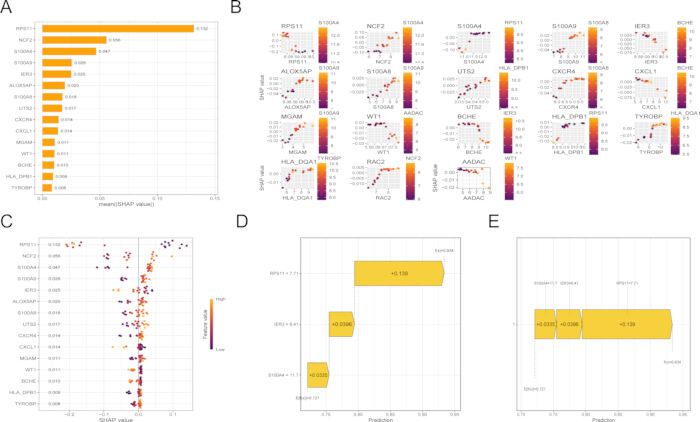
Figure 6. SHAP analysis. (A) Global feature importance ranked by mean absolute SHAP values. (B) SHAP dependence plots showing the effect of individual signature genes. (C) SHAP summary beeswarm plot illustrating feature contributions across samples. (D) SHAP waterfall plot for a representative sample. (E) SHAP force plot for a representative sample. Abbreviations: SHAP = SHapley Additive exPlanations. Please click here to view a larger version of this figure.
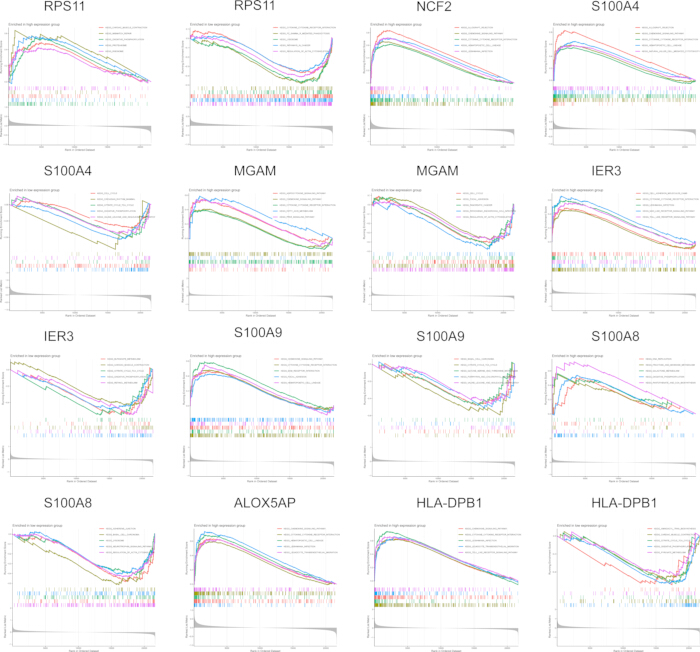
Figure 7. GSEA of pathways associated with signature genes. GSEA enrichment plots comparing high- vs low-expression groups for representative signature genes. Abbreviations: GSEA = gene set enrichment analysis. Please click here to view a larger version of this figure.
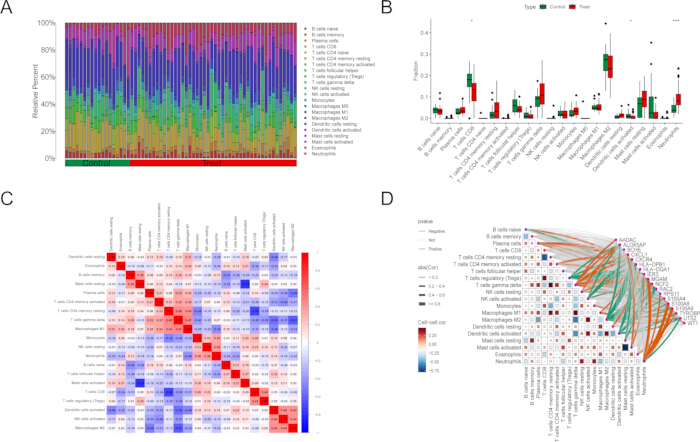
Figure 8. Immune infiltration profiling and association with signature genes. (A) Stacked bar plot of inferred immune-cell fractions per sample. (B) Boxplots comparing immune-cell fractions between groups. (C) Correlation heatmap among immune-cell fractions. (D) Correlation network linking immune-cell fractions and signature gene expression. For all panels, *p < 0.05, **p < 0.01, ***p < 0.001 unless otherwise specified. Please click here to view a larger version of this figure.
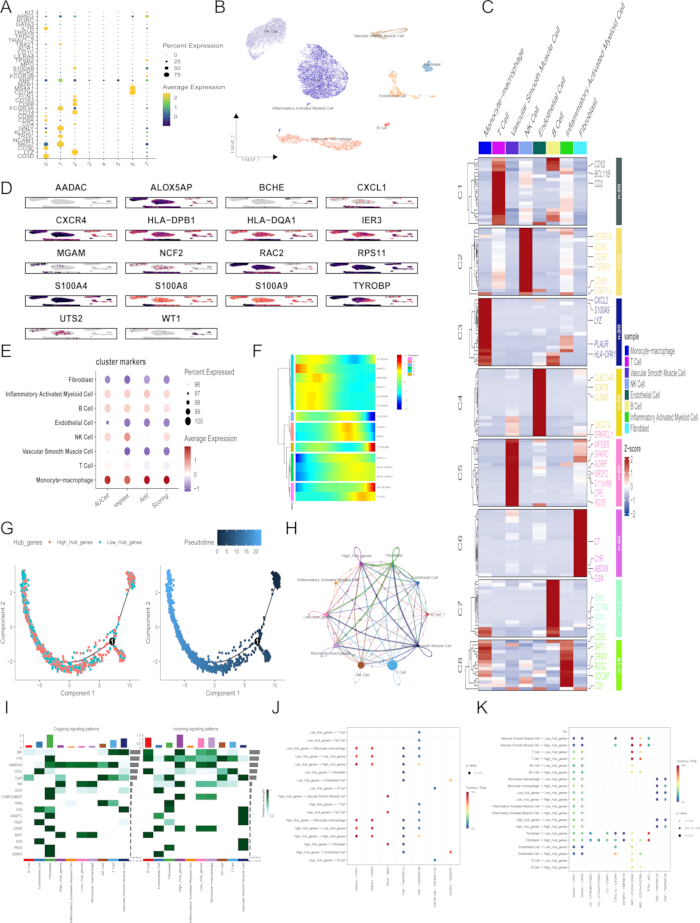
Figure 9. Single-cell mapping of the ERS-related signature and monocyte-macrophage-centered analyses. (A) Dot plot of canonical marker genes used for cell-type annotation. (B) UMAP visualization of major cell populations. (C) Heatmap of marker gene expression across annotated cell types. (D) Feature plots showing single-cell expression distributions of the 18 signature genes. (E) Comparison of 18-gene signature composite scores across cell types using AUCell, ssGSEA, and AddModuleScore. (F) Monocyte-macrophages stratified into high- and low-score subgroups with corresponding gene expression patterns. (G) Pseudotime trajectory analysis showing the distribution of high- and low-score subgroups along state transitions. (H) Cell-cell communication network depicting interactions between high/low-score monocyte-macrophages and other cell types. (I) Outgoing and incoming signaling-pattern heatmaps from the cell-cell communication analysis. (J–K) Bubble plots showing selected ligand-receptor interaction patterns among annotated cell populations. Abbreviations: AUCell = area under the curve-based single-cell gene-set scoring; ERS = endoplasmic reticulum stress; ssGSEA = single-sample gene set enrichment analysis; UMAP = Uniform Manifold Approximation and Projection. Please click here to view a larger version of this figure.
Supplementary File 1. Supplementary figures and tables. This file contains five Supplementary Figures and seven Supplementary Tables, including the additional GSE14975 external validation outputs, predicted probabilities, single-gene AUC/ROC results, internal resampling and bootstrap optimism-correction results, coefficient rankings for the Enet [α = 0.2]-derived 18-gene signature, public dataset characteristics, and the reproducibility checkpoint table. Abbreviations: AUC = area under the curve; Enet = elastic net; ROC = receiver operating characteristic.Please click here to download this file.
Discussion
This study integrated bulk and single-cell transcriptomes to investigate the role of ERS in AF. An ERS-related gene signature with favorable cross-cohort discrimination was derived, and these signals were mapped predominantly to the monocyte-macrophage lineage and were associated with extensive intercellular communication. Collectively, the findings suggest that ERS-associated programs are coupled to immune-cell-centric remodeling in AF. Compared with bulk-only biomarker screening, this workflow provides a multi-layered interpretation of disease-associated genes. The integration of WGCNA and ERS-related gene filtering improves biological specificity, while comparing multiple machine-learning algorithms reduces reliance on a single modeling strategy. SHAP analysis further improves model interpretability by identifying the relative contribution and direction of each feature. In addition, single-cell transcriptomics maps the bulk-derived signature to specific cell populations, thereby generating mechanistic hypotheses about cellular sources and intercellular communication. Several critical steps determine the success of this workflow. First, dataset selection and phenotype harmonization are essential because inconsistent tissue sources, disease definitions, or clinical annotations can introduce substantial bias. Second, batch-effect correction should be evaluated using both expression distribution plots and principal component analysis before downstream modeling. Third, feature selection should balance statistical stringency and biological interpretability, especially when intersecting DEGs, WGCNA modules, and ERS-related gene sets. Fourth, machine-learning performance should be interpreted together with external validation results to avoid overfitting. Finally, single-cell annotation should be supported by multiple canonical markers and, when possible, by comparison with published cell atlases.
Accumulating evidence suggests that ERS is associated with atrial pathological remodeling in the occurrence and maintenance of AF. For instance, studies of human atrial tissues and related models by Wiersma et al. revealed that stress pathways associated with dysregulated protein homeostasis are activated during AF development. Importantly, pharmacological modulation of this stress axis was shown to ameliorate AF-related pathology, highlighting ERS as a potential interventional target23. Similarly, Hu et al. demonstrated that in atrial remodeling models induced by stimuli such as angiotensin II, which increase AF susceptibility, the unfolded protein response pathway is significantly activated24. Furthermore, alleviating ERS with chemical chaperones has been shown to partially attenuate structural remodeling, including atrial fibrosis, and improve associated electrophysiological abnormalities24. Taken together, these studies suggest that ERS may participate in the formation of an atrial structural substrate associated with increased susceptibility to AF. However, whether ERS directly drives atrial remodeling in specific cellular contexts requires further experimental validation.
Although previous studies have attempted to explore biomarkers for AF by integrating multi-omics data with machine learning algorithms and have identified potential targets such as HOXA2 and RND2, no study to date has specifically integrated this approach with the key pathological phenotype of ERS25,26. In this study, by systematically combining 12 machine-learning algorithms into 113 distinct models, an Enet model comprising 18 genes was identified as the optimal candidate signature. This 18-gene ERS-related signature may help prioritize AF-associated molecular features and provides a hypothesis-generating multi-gene model for future validation, offering insights for mechanism-guided stratification.
Among the core genes identified in this study, S100A8/S100A9 and NCF2 have been reported to be predominantly expressed in myeloid immune cells and to be associated with inflammasome activation, oxidative stress, and inflammatory responses27,28,29,30,31,32. S100A8/S100A9 can be released under inflammatory conditions and have been implicated in leukocyte recruitment, cytokine-related inflammatory signaling, and inflammation-related disease monitoring31. In AF-related single-cell and experimental studies, myeloid-derived S100A8/S100A9 has been reported to be associated with monocyte recruitment and inflammatory signaling through the TLR4/NF-κB axis32. NCF2, a gene closely associated with the neutrophil oxidative burst and immune activation, has also been implicated in inflammatory responses in several cardiovascular diseases27. In addition, CXCR4 and TYROBP are involved in chemokine signaling and immune regulation, suggesting that chemotactic and myeloid-cell-related programs may contribute to remodeling of the AF immune microenvironment33,34. In the present data, ALOX5AP, NCF2, RAC2, TYROBP, S100A8, and S100A9 showed prominent expression patterns in AF samples, consistent with a myeloid inflammation- and oxidative stress-related transcriptomic signature35. Although ALOX5AP has been associated with cardiovascular and immune-related diseases, its specific role in AF remains unclear36,37,38,39,40. Integrating the enrichment, model-interpretation, and single-cell results, these findings suggest a stepwise connection among ERS-related signals, immune-inflammatory activation, and monocyte-macrophage alterations in AF. At the bulk transcriptomic level, the ERS-related core genes were enriched in immune-associated pathways, including leukocyte activation, antigen processing and presentation, chemokine signaling, and IL-17-related inflammatory pathways. At the model-interpretation level, several highly ranked genes, such as NCF2, S100A8, S100A9, TYROBP, ALOX5AP, and CXCR4, are closely associated with myeloid cell activation, oxidative stress, chemotaxis, and inflammatory signaling. At the single-cell level, the integrated ERS-related signature was preferentially enriched in monocyte-macrophage cells. Therefore, the bulk and single-cell analyses together support a potential link between ERS-related transcriptional programs and myeloid immune remodeling in AF, but do not establish a direct causal mechanism.
Although the Enet [α = 0.2]-derived 18-gene signature showed cross-cohort discriminatory performance, its relatively large number of genes may limit direct clinical applicability and interpretability. Exploratory coefficient-based ranking and single-gene ROC analyses, provided in Supplementary File 1, suggested that several genes, including CXCL1, CXCR4, S100A8, HLA-DPB1, and IER3, may have stronger individual discriminatory potential and could inform future simplified-panel development. However, these findings should be interpreted cautiously because the external validation cohort was small, and the current study did not attempt to replace the original 18-gene model with a reduced panel. In addition, the perfect apparent performance in the development cohort may reflect optimism related to model development. Although repeated cross-validation and bootstrap-based correction indicated that the corrected discrimination remained relatively high, overfitting cannot be completely excluded. The additional validation in GSE14975 yielded an AUC of 0.840, providing preliminary supportive evidence for external reproducibility; however, this cohort contained only 10 samples, resulting in a wide confidence interval. Therefore, larger independent prospective cohorts are required to further confirm the signature's robustness, generalizability, and potential utility.
A key implication of the single-cell results is that ERS-associated transcriptional programs are concentrated in the monocyte-macrophage compartment. Mechanistically, AF is characterized by oxidative stress, metabolic perturbation, and inflammatory signaling, all of which can disrupt endoplasmic reticulum homeostasis and trigger unfolded protein response activation. Such stress cues may be linked to cytokine signaling, damage-associated molecular pattern (DAMP)-related pathways, and cell-cell communication between atrial structural cells and infiltrating myeloid cells, suggesting a potential association between ERS-related programs and immune-inflammatory remodeling. The ligand–receptor analyses further support extensive crosstalk between myeloid cells and other atrial cell types, consistent with an immune-centered remodeling network.
ERS has been established as an important mechanism in AF pathogenesis. Previous studies have indicated that the cardiac endoplasmic reticulum plays a key role in regulating excitation-contraction coupling and maintaining cardiac function. Disruption of ER homeostasis by factors such as inflammation and oxidative stress can trigger ERS41. This is consistent with previous findings that the expansion of immune cells, particularly inflammatory monocytes and macrophages, represents one of the prominent tissue alterations in the pathological environment of AF. Hulsmans et al. demonstrated through single-cell transcriptomic analysis of left atrial tissues from patients that inflammatory monocyte-macrophages were significantly increased in AF atria compared to healthy controls and exhibited a pro-inflammatory and pro-fibrotic transcriptional phenotype35. Similarly, Sun et al. found that macrophage density was significantly elevated in atrial tissues from AF patients, predominantly characterized by a pro-inflammatory iNOS⁺ phenotype, and that IL-1β secreted by these macrophages induced electrical remodeling in atrial myocytes and promoted AF maintenance42.
The bulk immune infiltration analysis and single-cell analysis provided complementary, though not identical, views of immune remodeling. Bulk CIBERSORT analysis suggested increased neutrophil proportions and reduced CD8 T cells and activated dendritic cells in AF samples, whereas single-cell analysis localized the ERS-related signature mainly to monocyte-macrophage cells. This discrepancy may be explained by differences in sample source, data platform, analytical strategy, and biological resolution. CIBERSORT estimates relative immune-cell fractions from bulk tissue using a predefined leukocyte reference matrix, whereas single-cell analysis directly profiles captured cells and enables cell-type-specific signature scoring. In addition, myeloid cells exist along a continuum of neutrophil-like, inflammatory monocyte, and macrophage states, and differences in annotation granularity may contribute to apparent differences between methods. Therefore, the two analyses should be interpreted as complementary evidence supporting myeloid immune involvement rather than as identical measurements of the same cell populations.
This study has several limitations. First, the conclusions are based on retrospective public transcriptomic datasets and require validation in independent clinical cohorts and experimental models. In addition, the included datasets differed in platform, tissue source, AF subtype, control definition, and clinical background. Although dataset-specific preprocessing and batch-effect correction were performed to reduce technical heterogeneity, residual confounding from cohort differences cannot be completely ruled out and may affect differential expression results, model performance, and cross-cohort generalizability. Second, although ERS-related programs were enriched in the monocyte-macrophage lineage, the present transcriptomic analyses cannot establish causal relationships among ERS, monocyte-macrophage alterations, and atrial fibrosis. Pseudotime and CellChat analyses provide computationally inferred associations rather than direct functional evidence. Experimental validation, such as ERS perturbation in monocyte-macrophage cells, macrophage-fibroblast co-culture assays, hub-gene knockdown or overexpression, and in vivo functional studies, is required to confirm the proposed biological mechanism. Third, because the 18-gene Enet signature was derived from atrial tissue, its clinical translation is limited by sample accessibility, and it should be viewed as a tissue-based mechanistic stratifier rather than a stand-alone diagnostic assay. Given the complexity of chemokine receptor networks and the challenges of single-target intervention, future studies should aim to develop and prospectively validate a blood-based surrogate and assess its potential utility43.
In addition, predefined and commonly used analytical criteria were applied to maintain objectivity and comparability across datasets; however, alternative differential-expression thresholds, batch-correction methods, and single-cell scoring strategies were not exhaustively assessed, and their potential influence on the identified candidate signature should be evaluated in future studies. Despite these limitations, our study provides an integrative ERS-focused transcriptomic analysis of AF and supports myeloid ERS-associated signaling as a potential direction for future mechanistic studies. Several considerations are important for the reproducibility, usability, and implementation of this study. Although the analyses were performed using publicly available transcriptomic datasets, reproducibility depends on accurate sample annotation, consistent preprocessing procedures, documented software/package versions, and clearly reported modeling parameters. From a practical perspective, implementing this framework requires comparable bulk transcriptomic datasets, optional single-cell data for cellular interpretation, and disease-relevant gene sets. The usability of this approach is reflected in its ability to integrate bulk transcriptomic screening, machine-learning-based feature selection, immune-related analysis, and single-cell-level interpretation within a unified analytical framework. However, differences in sequencing platforms, cohort characteristics, and sample composition may affect the stability and generalizability of the results. Thus, the present analytical framework should be regarded as an adaptable strategy rather than a disease-independent universal model, and its application in other settings requires independent validation. Future studies using larger multicenter cohorts, prospective clinical samples, and experimental validation are needed to further assess the robustness and biological relevance of the identified candidate genes. In addition, integrating multi-omics or spatial transcriptomic data may help refine disease-specific mechanisms and improve the translational potential of this analytical framework.
Disclosures
The authors report no conflicts of interest in this work. During the revision of this manuscript, ChatGPT from OpenAI was used only to assist with English-language polishing. The authors reviewed, verified, and edited all AI-assisted text and take full responsibility for the accuracy and integrity of the final manuscript. No AI-assisted tools were used to generate research ideas, perform data analysis, interpret results, create figures or tables, or draw scientific conclusions. The work reported in the article has been performed by the authors. F.T, PR.W: Writing-original draft, Software, Methodology,Visualization, Validation, and Data curation. SY.T: Investigation and Methodology. FF.B: Supervision. QR.L: Supervision, Methodology, Data curation. XY.J, YX.X: Literature retrieval and data interpretation.
Materials
| Name | Company | Catalog Number | Comments |
|---|---|---|---|
| AddModuleScore | Seurat function | version 4.4.0 | NA |
| AUCell | Bioconductor | version 1.32.0 | RRID:SCR_021327 |
| caret | CRAN | version 7.0.1 | RRID:SCR_022524 |
| celda / decontX | Bioconductor | version 1.24.0 | NA |
| CellChat | GitHub / CellChat | version 2.2.0 | RRID:SCR_021946 |
| CIBERSORT / LM22 signature matrix | CIBERSORT | LM22 | NA |
| clusterProfiler | Bioconductor | version 4.12.6 | RRID:SCR_016884 |
| Cytoscape | Cytoscape Consortium | version 3.10 | RRID:SCR_003032 |
| DoubletFinder | GitHub / McGinnis Lab | version 2.0.4 | NA |
| e1071 | CRAN | version 1.7.16 | NA |
| gbm | CRAN | version 2.2.2 | NA |
| Gene Expression Omnibus (GEO) database | National Center for Biotechnology Information (NCBI) | GSE41177 | NA |
| Gene Expression Omnibus (GEO) database | NCBI | GSE79768 | NA |
| Gene Expression Omnibus (GEO) database | NCBI | GSE115574 | NA |
| Gene Expression Omnibus (GEO) database | NCBI | GSE14975 | NA |
| Gene Expression Omnibus (GEO) database | NCBI | GSE165838 | NA |
| glmnet | CRAN | version 4.1.8 | NA |
| Harmony | CRAN | version 1.2.4 | NA |
| limma | Bioconductor | version 3.60.6 | RRID:SCR_010943 |
| MASS | CRAN | version 7.3.61 | NA |
| mboost | CRAN | version 2.9.11 | NA |
| Monocle | Bioconductor | version 2.38.0 | RRID:SCR_016339 |
| org.Hs.eg.db | Bioconductor | version 3.19.1 | NA |
| plsRglm | CRAN | version 1.5.1 | NA |
| pROC | CRAN | version 1.18.5 | RRID:SCR_024286 |
| R statistical software | R Foundation for Statistical Computing | version 4.4.2 | RRID:SCR_001905 |
| randomForest | CRAN | version 4.7.1.2 | RRID:SCR_015718 |
| RStudio | Posit Software, PBC | version 2024.4.1.748 | RRID:SCR_000432 |
| Seurat | CRAN / Satija Lab | version 4.4.0 | RRID:SCR_016341 |
| shapviz | CRAN | version 0.10.2 | NA |
| sva | Bioconductor | version 3.52.0 | NA |
| WGCNA | CRAN | version 1.73 | RRID:SCR_003302 |
| xgboost | CRAN | version 1.7.8.1 | NA |
References
- Saleh K, Haldar S. Atrial fibrillation: a contemporary update. Clin Med (Lond). 2023;23(5):437-41.
- Lemme M, et al. Atrial-like engineered heart tissue: an in vitro model of the human atrium. Stem Cell Reports. 2018;11(6):1378-90.
- van Gorp PRR, Trines SA, Pijnappels DA, de Vries AAF. Multicellular in vitro models of cardiac arrhythmias: focus on atrial fibrillation. Front Cardiovasc Med. 2020;7:43.
- Scherr D, et al. Five-year outcome of catheter ablation of persistent atrial fibrillation using termination of atrial fibrillation as a procedural endpoint. Circ Arrhythm Electrophysiol. 2015;8(1):18-24.
- Staerk L, et al. Atrial fibrillation: epidemiology, pathophysiology, and clinical outcomes. Circ Res. 2017;120(9):1501-17.
- Schotten U, Verheule S, Kirchhof P, Goette A. Pathophysiological mechanisms of atrial fibrillation: a translational appraisal. Physiol Rev. 2011;91(1):265-325.
- Van Wagoner DR, Chung MK. Inflammation, inflammasome activation, and atrial fibrillation. Circulation. 2018;138(20):2243-6.
- Yuan M, et al. IP3R1/GRP75/VDAC1 complex mediates endoplasmic reticulum stress-mitochondrial oxidative stress in diabetic atrial remodeling. Redox Biol. 2022;52:102289.
- Wang M, Kaufman RJ. Protein misfolding in the endoplasmic reticulum as a conduit to human disease. Nature. 2016;529(7586):326-35.
- Ritchie ME, et al. limma powers differential expression analyses for RNA-sequencing and microarray studies. Nucleic Acids Res. 2015;43(7):e47.
- Langfelder P, Horvath S. WGCNA: an R package for weighted correlation network analysis. BMC Bioinformatics. 2008;9:559.
- Hu H, et al. Dissection of metabolome and transcriptome: insights into capsaicin and flavonoid accumulation in two typical Yunnan Xiaomila fruits. Int J Mol Sci. 2024;25(14):7761.
- Chen GY, et al. Integrating network pharmacology and experimental validation to explore the key mechanism of Gubitong Recipe in the treatment of osteoarthritis. Comput Math Methods Med. 2022;2022:7858925.
- Chen GY, et al. Prediction of Rhizoma Drynariae targets in the treatment of osteoarthritis based on network pharmacology and experimental verification. Evid Based Complement Alternat Med. 2021;2021:5233462.
- Díaz-Uriarte R, Alvarez de Andrés S. Gene selection and classification of microarray data using random forest. BMC Bioinformatics. 2006;7:3.
- Saeys Y, Inza I, Larrañaga P. A review of feature selection techniques in bioinformatics. Bioinformatics. 2007;23(19):2507-17.
- Statnikov A, Wang L, Aliferis CF. A comprehensive comparison of random forests and support vector machines for microarray-based cancer classification. BMC Bioinformatics. 2008;9:319.
- Liu H, et al. Unraveling diethyl phthalate-induced prostate carcinogenesis: core targets revealed by integrated network toxicology, machine learning, and structural validation. Hum Genomics. 2025;19(1):149.
- Subramanian A, et al. Gene set enrichment analysis: a knowledge-based approach for interpreting genome-wide expression profiles. Proc Natl Acad Sci U S A. 2005;102(43):15545-50.
- Newman AM, et al. Robust enumeration of cell subsets from tissue expression profiles. Nat Methods. 2015;12(5):453-7.
- Xu H, et al. Single-cell transcriptomics reveals CCL3+ classical monocyte subset linked to autoimmune pathogenesis. J Inflamm Res. 2025;18:16273-91.
- Wang Y, et al. Immunological profiling of rheumatoid factor-positive primary Sjögren’s syndrome by single-cell RNA sequencing. Front Immunol. 2026;17:1822615.
- Wiersma M, et al. Endoplasmic reticulum stress is associated with autophagy and cardiomyocyte remodeling in experimental and human atrial fibrillation. J Am Heart Assoc. 2017;6(10):e006458.
- Hu HJ, et al. Hydrogen sulfide ameliorates angiotensin II-induced atrial fibrosis progression to atrial fibrillation through inhibition of the Warburg effect and endoplasmic reticulum stress. Front Pharmacol. 2021;12:690371.
- Liu Y, et al. Integrative transcriptomic, proteomic, and machine learning approach to identifying feature genes of atrial fibrillation using atrial samples from patients with valvular heart disease. BMC Cardiovasc Disord. 2021;21(1):52.
- Fu S, et al. Using integrative bioinformatics approaches and machine-learning strategies to identify potential signatures for atrial fibrillation. Int J Cardiol Heart Vasc. 2025;56:101592.
- Wu S, et al. Multiplex proteomics identifies inflammation-related plasma biomarkers for aging and cardio-metabolic disorders. Clin Proteomics. 2024;21(1):30.
- Xie Z, et al. Identification and verification of biomarkers and immune infiltration in obesity-related atrial fibrillation. Biology (Basel). 2023;12(1):121.
- Huo TM, Wang ZW. Comprehensive analysis to identify key genes involved in advanced atherosclerosis. Dis Markers. 2021;2021:4026604.
- Chen M, et al. Weighted gene co-expression network analysis identifies crucial genes mediating progression of carotid plaque. Front Physiol. 2021;12:601952.
- Wang S, et al. S100A8/A9 in inflammation. Front Immunol. 2018;9:1298.
- Wang Q, et al. Myeloid-specific S100A8/A9 deficiency attenuates atrial fibrillation through prevention of TLR4/NF-κB-mediated immune cell recruitment and inflammation. Front Immunol. 2025;16:1623486.
- Wu CL, Yin R, Wang SN, Ying R. A review of CXCL1 in cardiac fibrosis. Front Cardiovasc Med. 2021;8:674498.
- Zhang YF, et al. CXCR4 and TYROBP mediate the development of atrial fibrillation via inflammation. J Cell Mol Med. 2022;26(12):3557-67.
- Hulsmans M, et al. Recruited macrophages elicit atrial fibrillation. Science. 2023;381(6654):231-9.
- van der Net JB, et al. Arachidonate 5-lipoxygenase-activating protein gene and coronary heart disease risk in familial hypercholesterolemia. Atherosclerosis. 2009;203(2):472-8.
- Ye X, et al. ALOX5AP predicts poor prognosis by enhancing M2 macrophage polarization and immunosuppression in serous ovarian cancer microenvironment. Front Oncol. 2021;11:675104.
- Song P, Deng H, Liu Y, Zhang M. Integrated bioinformatics analysis and experimental validation reveal the relationship between ALOX5AP and the prognosis and immune microenvironment in glioma. BMC Med Genomics. 2024;17(1):218.
- Chen S, Tang L, Guillot A, Liu H. Bariatric surgery associates with nonalcoholic steatohepatitis/hepatocellular carcinoma amelioration via SPP1 suppression. Metabolites. 2023;13(1):11.
- Ji H, et al. Integrated genomic, transcriptomic, and epigenetic analyses identify a leukotriene synthesis-related M2 macrophage gene signature that predicts prognosis and treatment vulnerability in gliomas. Front Immunol. 2022;13:970702.
- Sirish P, et al. The critical roles of proteostasis and endoplasmic reticulum stress in atrial fibrillation. Front Physiol. 2021;12:793171.
- Sun Z, et al. Cross-talk between macrophages and atrial myocytes in atrial fibrillation. Basic Res Cardiol. 2016;111(6):63.
- Schall TJ, Proudfoot AEI. Overcoming hurdles in developing successful drugs targeting chemokine receptors. Nat Rev Immunol. 2011;11(5):355-63.