This protocol describes a confidence-guided multi-object tracking workflow for sports videos that integrates jersey color and player number information to improve trajectory association and identity consistency under confidence fluctuations, occlusion, and visually similar athlete appearances.
A subscription to JoVE is required to view this content. Sign in or start your free trial.
Method Article
A Confidence-Guided Multi-Object Tracking Method for Sports Videos Using Jersey Semantic Fusion
In This Article
Summary
Abstract
Multi-Object Tracking (MOT) in sports videos provides trajectory information for tactical analysis, player behavior interpretation, and automated statistical analysis. However, sports scenarios frequently involve rapid direction changes, abrupt stops, frequent occlusion, and visually similar teammates, resulting in fluctuations in detection confidence and identity confusion during inter-frame association. To address these challenges, this study presents JerseyTrack, a confidence-guided sports MOT method based on jersey semantic fusion. The workflow adaptively partitions detection boxes into high-, medium-, and low-confidence intervals according to the confidence distribution of each frame. High-confidence detections are associated primarily using motion similarity, whereas medium- and low-confidence detections additionally incorporate jersey color and player number features extracted through color clustering and a lightweight Optical Character Recognition (OCR) model. These semantic features are fused with motion information during supplementary matching to improve trajectory continuity and identity consistency. The method was evaluated on the SportsMOT dataset. JerseyTrack achieved 88.9% Multiple Object Tracking Accuracy (MOTA), 74.3% IDentity F1 Score (IDF1), and 69.9% Higher Order Tracking Accuracy (HOTA), demonstrating improved tracking performance under the evaluated sports tracking setting. This protocol provides a reproducible workflow for integrating confidence-guided association with jersey semantic information to improve multi-object tracking in sports videos.
Introduction
Multi-object tracking (MOT) provides continuous object localization and identity maintenance in video sequences and supports athlete trajectory extraction, tactical analysis, and automated statistical analysis in sports-video applications1,2,3. Reliable visual information is also related to sport-specific decision-making and performance assessment in sports science, further emphasizing the value of stable video-derived movement data for downstream sports analysis4. In sports scenarios, the reliability of tactical data depends on the continuity of tracking trajectories and the consistency of target identities.
Compared with general MOT scenarios, sports videos contain rapid direction changes, abrupt stops, jumps, dense interactions, and frequent occlusion. These factors cause substantial fluctuations in detection-box confidence and increase the frequency of low-confidence detections, which may interrupt trajectory association5,6. Uniform team jerseys further reduce the discriminative ability of general appearance features and increase identity confusion among visually similar teammates7,8. When occlusion and appearance similarity occur in the same sequence, detection confidence decreases and target appearance information becomes incomplete, increasing the difficulty of trajectory association and identity maintenance9,10. In MOT, re-identification (Re-ID) refers to the process of associating the same target identity across frames, occlusion periods, or re-entry cases using identity-related visual evidence. In team-sport videos, general Re-ID cues may be weakened because athletes from the same team often share similar uniforms and body appearances. The technical literature review indicates that trajectory fragmentation and identity confusion in sports MOT are commonly addressed through two complementary approaches: detection-confidence utilization and identity-cue enhancement. JerseyTrack is positioned at the intersection of these approaches by regulating the use of jersey semantic cues according to detection quality rather than applying color and player-number information uniformly to all detections.
This study presents JerseyTrack, a confidence-guided sports MOT method based on jersey semantic fusion. The method is designed for team-sport videos in which athletes wear visible jerseys and detection results provide bounding boxes with confidence scores. JerseyTrack combines four main components: athlete detection, confidence-level partitioning, jersey semantic feature extraction, and cascaded inter-frame association. Detection confidence is used to adaptively partition detections into high-, medium-, and low-confidence groups, which are processed using different association strategies. High-confidence detections are associated primarily through motion information, whereas medium- and low-confidence detections additionally incorporate jersey color and player-number information to improve identity maintenance when visual evidence is weak. The method is intended for sports video analysis tasks that require stable athlete trajectories, such as tactical analysis and player behavior interpretation.
The proposed approach also has operational limitations. Jersey semantic extraction may be affected by severe occlusion, motion blur, low image resolution, abnormal jersey poses, or invisible player numbers. In these cases, jersey-based semantic cues may become incomplete, and the association process relies more heavily on motion consistency and multi-frame verification. Therefore, the performance claims in this study are restricted to the evaluated datasets and experimental settings. Experiments on the SportsMOT dataset show that JerseyTrack improves the evaluated tracking metrics and reduces identity-switching events under the tested sports tracking conditions. The main difficulty of MOT in sports videos lies in maintaining trajectory continuity and identity consistency under rapid motion, occlusion, and appearance similarity. Existing studies relevant to JerseyTrack can be broadly categorized into two research directions: the use of detection confidence for trajectory association and the enhancement of identity cues through sports-specific semantic features.
Detection confidence has been widely used to estimate the reliability of detection boxes and to guide trajectory association in MOT. Early tracking methods usually treated confidence as a binary filtering criterion, in which detections below a fixed threshold were removed to reduce false positives11,12. This strategy reduces noisy detections but may also discard true targets under occlusion, rapid motion, or low image quality, resulting in trajectory fragmentation13,14,15. Similar filtering strategies have also shown that fixed confidence thresholds are sensitive to scene variation and detection quality16,17. To improve the use of low-confidence detections, ByteTrack introduced an association strategy that retains low-confidence boxes as candidate targets for secondary matching and links them with existing trajectories through motion similarity and trajectory history18. McByte further extends sports MOT association by incorporating temporally propagated segmentation masks as an association cue, improving robustness under fast motion, occlusion, and camera shift conditions without additional per-video training19. Related studies have also adjusted the use of low-confidence detections to retain weak but potentially valid targets during association20,21,22. Confidence-adaptive association strategies subsequently refined matching criteria according to motion consistency and detection reliability23,24,25. Trajectory refinement methods based on detection-box regression and trajectory smoothness optimization have also been used to reduce trajectory fragmentation26,27,28. Additional refinement strategies provide complementary support for maintaining trajectory continuity under complex motion conditions29. Temporal coherent object flow further models object-level temporal consistency across frames, providing another association-oriented approach for reducing trajectory interruption in complex MOT scenarios30. Tracker fusion methods also learn from the outputs of multiple trackers and use learner-based selection or fusion strategies to improve tracking robustness across different MOT benchmarks31. Collectively, these studies indicate that confidence-aware association helps recover interrupted trajectories; however, confidence and motion cues provide limited identity information when players from the same team have similar visual appearances. Although these methods effectively alleviate trajectory fragmentation in general scenarios, they face inherent limitations in sports settings because players on the same team often have highly similar visual appearances, and relying solely on confidence and motion information cannot provide a sufficient basis for identity differentiation32,33,34. Even when low-confidence boxes are effectively recalled, feature similarity can still lead to identity switching, making it difficult to satisfy the stringent identity consistency requirements of sports analysis.
Sports-specific identity cues have also been used to improve identity discrimination in athlete tracking. Jersey semantic information, such as team color and player number, provides identity cues that are more directly related to sports scenarios than general appearance embeddings35,36,37. Jersey color has been used to support team-level discrimination and reduce cross-team confusion, whereas player number recognition provides a finer identity cue when the number region is visible and readable38,39. Existing sports tracking studies have incorporated domain-specific visual features and jersey color recognition to improve player association under crowded sports conditions40,41. Related work on jersey number recognition and synthetic number data further supports identity modeling under low-resolution or partially occluded conditions42,43. These studies indicate that jersey semantics can strengthen identity representation in sports MOT. However, most semantic-enhanced tracking methods do not sufficiently model the relationship between detection confidence and semantic feature quality. High-confidence detections may already contain reliable spatial and appearance information, making repeated semantic extraction less efficient. Low-confidence detections often suffer from occlusion, blur, truncation, or low resolution, reducing the reliability of color and player-number cues. This limitation motivates a confidence-guided association design in which jersey semantics are introduced according to detection quality rather than applied uniformly to all detections. The reviewed studies show that confidence-aware association and jersey semantic modeling address different aspects of sports MOT. Confidence-based strategies mainly determine whether a detection should participate in association and how it should be matched with existing trajectories, whereas jersey semantic strategies primarily enhance identity representation through sports-specific cues. However, these two mechanisms are often designed as separate components. As a result, semantic cues are not always adjusted according to detection quality, and confidence levels do not directly regulate the use of color and player-number information during association. This separation limits the joint handling of trajectory fragmentation and identity confusion in team-sport videos. The remaining research gap lies in linking detection-confidence quality assessment with jersey semantic association within the same tracking workflow.
Access restricted. Please log in or start a trial to view this content.
Protocol
This study involved secondary analysis of publicly available benchmark video datasets, namely SportsMOT, TeamTrack, SoccerNet Tracking, MOT17, and MOT20. No participants were recruited, no intervention was performed, and no new human-subject data were collected. Ethics committee approval was not required for this study under the applicable institutional requirements of Bangkok Thonburi University.
The following protocol describes the workflow used to reproduce JerseyTrack from data preparation through tracking evaluation. The workflow includes dataset preparation, detector preparation, jersey semantic extraction, confidence-level partitioning, confidence-guided association, tracking inference, and performance evaluation, as summarized in Figure 1. The required software, datasets, and hardware resources are listed in the Table of Materials.
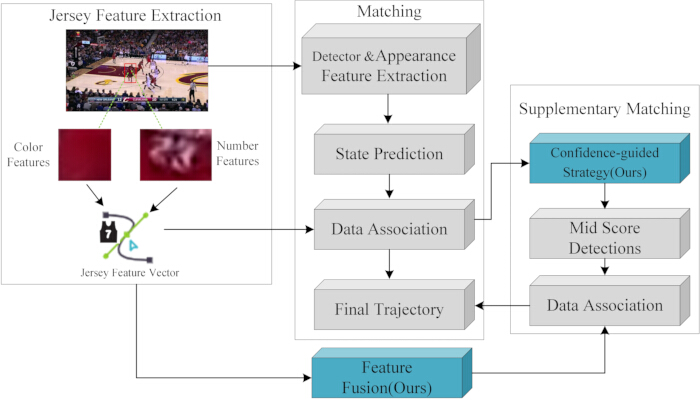
Figure 1. Overall workflow of the JerseyTrack method. The workflow consists of jersey semantic feature extraction, initial object matching, confidence-guided supplementary matching, and feature fusion. Team-color and player-number features are extracted from detected athlete regions and incorporated into the association process to improve trajectory matching under uncertain detection conditions. Please click here to view a larger version of this figure.
1. Prepare the datasets and directory structure
- Download the public benchmark datasets listed in the Table of Materials. Use SportsMOT as the primary dataset for detector preparation and tracking evaluation. Retain TeamTrack, SoccerNet Tracking, MOT17, and MOT20 for cross-dataset evaluation.
- Store all datasets under a unified project directory. Ensure that the detector, semantic extraction module, the tracking module, and the evaluation toolkit use identical sequence identifiers.
- Convert the official SportsMOT annotations into the detector-training format using the data-preparation script employed in this study. Execute the following command:
..\venv\Scripts\python.exe scripts\prepare_data.py --config configs\datasets.local.json --dataset SportsMOT --out data\processed\SportsMOT_yolo --splits train val. - The data-preparation script (scripts/prepare_data.py) is available in the JerseyTrack source code repository (https://doi.org/10.5281/zenodo.21274352). The required software dependencies are specified in environment.yml, including Python 3.12, PyTorch 2.11.0, and OpenCV 4.10 or later. Configure the software environment using the following command: conda env create -f environment.yml. Execute the data-preparation script using the following command: python scripts/prepare_data.py --config configs/datasets.local.json --dataset SportsMOT --out data/processed/SportsMOT_yolo --splits train val.
- Verify that the conversion generates the detector-training configuration file: data\processed\SportsMOT_yolo\data.yaml and the conversion manifest: data\processed\SportsMOT_yolo\conversion_manifest.csv.
NOTE: In this study, the converted SportsMOT training and validation dataset contained 90 sequences, 55,544 frames, and 608,152 annotated objects. - Inspect representative sequences to verify that the frame order, bounding-box coordinates, and identity labels remain consistent with the original benchmark annotations.
- Preserve the converted annotation files without modification throughout detector preparation, tracking inference, and evaluation so that all methods use the same dataset partition and evaluation protocol.
NOTE: The expected outcome of this section is a standardized SportsMOT detector-training directory containing the converted annotations, the conversion manifest, and the dataset split files required for detector preparation and tracking evaluation.
2. Prepare detector outputs
- Fine-tune the object detector using the prepared SportsMOT training split. Optimize the detector using the classification loss and bounding-box regression loss defined in Equation 1. Use the detector input resolution, batch size, learning rate, number of training epochs, and other training parameters reported in the implementation setup and the Table of Materials
Ldet = Lcls + Lbox (1)
Here, Ldet denotes the total detector loss, Lcls denotes the classification loss, Lbox and denotes the bounding-box regression loss.
NOTE: The detector checkpoint used in the primary experiments (internal experiment identifier e3) was trained using the Ultralytics YOLO framework with the SportsMOT YOLO-format dataset configuration (data/processed/SportsMOT_yolo/data.yaml). Execute detector training using the following command: yolo detect train data=data/processed/SportsMOT_yolo/data.yaml model=yolo11x.pt epochs=80 imgsz=960 batch=16 lr0=0.01 project=outputs/formal name=checkpoints/detector device=0. After training, use the resulting best-performing checkpoint to generate detector outputs for the validation sequences using the following command: python scripts/formal_detect_yolo.py --dataset-root datasets/SportsMOT/dataset --split val --model outputs/formal/checkpoints/detector/weights/best.pt --out-dir outputs/formal_runs/sportsmot_val_yolo11x_i960_e3_threshold_sweep/t005/detections --imgsz 960 --conf 0.05 --device 0 --batch 16. - Save the trained detector checkpoint, the corresponding metadata file, and the training log after training.
NOTE: In this study, the detector checkpoint used for the formal experiments was saved as:
outputs\formal\checkpoints\detector\sportsmot_yolo11x_i960_e3_best.pt. The corresponding metadata file was saved as: outputs\formal\checkpoints\detector\sportsmot_yolo11x_i960_e3_best.json. The detector-output directory used for the main SportsMOT validation experiments was: outputs\formal_runs\sportsmot_val_yolo11x_i960_e3_threshold_sweep\t005\detections. - Run the trained detector on each validation sequence to generate athlete bounding boxes and confidence scores. Export one detection file for each sequence containing the frame index, bounding-box coordinates, detection confidence, and class label.
NOTE: In the SportsMOT validation run used for the main experiments, a confidence threshold of 0.05 generated 343,990 athlete detections. - Inspect the detector-output directory before tracking inference. Confirm that every sequence has a corresponding detection file, that the frame indices match the prepared image sequence, and that every detection record contains a confidence score.
NOTE: The expected outcome of this section is a complete detector-output directory that serves as the input for jersey semantic extraction, confidence-level partitioning, and tracking association.
3. Extract jersey semantic features
- Use the detector-output files to crop athlete regions from each video frame. Save each cropped athlete image with its sequence identifier, frame index, and detection index. Exclude invalid crops with missing image content or bounding boxes extending outside the image boundary. Maintain the linkage between each crop filename and its original detection record so that the extracted semantic features can be matched to the corresponding detection during tracking association.
- Extract jersey color features from the cropped athlete images using the semantic extraction script employed in this study.
NOTE: The semantic feature extraction scripts (scripts/extract_fast_color_semantics.py and scripts/formal_extract_semantics.py) are available in the JerseyTrack source code repository (https://doi.org/10.5281/zenodo.21274352). No separate configuration file is required; all runtime parameters are provided through the command-line arguments.
Generate jersey-color descriptors using the following command: python scripts/extract_fast_color_semantics.py --detections-dir outputs/formal_runs/sportsmot_val_yolo11x_i960_e3_threshold_sweep/t005/detections --frames-root datasets/SportsMOT/dataset/val --out-dir outputs/formal_runs/sportsmot_val_yolo11x_i960_e3_t005_color. Generate player-number semantic features using the OCR model with the following command: python scripts/formal_extract_semantics.py --detections-dir outputs/formal_runs/sportsmot_val_yolo11x_i960_e3_threshold_sweep/t005/detections --frames-root datasets/SportsMOT/dataset/val --out-dir outputs/formal_runs/sportsmot_val_yolo11x_i960_e3_t005_ocr. The generated jersey-color descriptors and player-number probability outputs are linked by sequence identifier and combined into the semantic-feature files used during tracking association. - Convert each cropped athlete image to the Hue, Saturation, Value (HSV) color space. Extract foreground pixels from the jersey region and summarize the dominant jersey color using K-means clustering with K = 3. Normalize the resulting color descriptor using L2 normalization before feature comparison.
- Train the player-number recognition branch using cropped athlete images with an input size of 128 × 64 pixels. Generate player-number pseudo-labels using the weakly supervised labeling procedure employed in this study. Exclude crops with invisible, unreadable, severely occluded, or low-confidence player-number regions from Optical Character Recognition (OCR) loss calculation.
- Optimize the OCR branch using the cross-entropy loss defined in Equation 2.
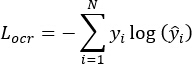 (2)
(2)
Here, Locr denotes the OCR loss, yi denotes the supervised player-number label, and denotes the predicted player-number category.
 - Optimize the semantic feature extraction module using the adaptive optimizer, learning rate, batch size, weight decay, and training duration listed in the Table of Materials. Combine the detector loss and OCR loss using the total training objective defined in Equation 3.
Ltotal = Ldet + γLocr (3)
Here, Ltotal denotes the total training loss, Ldet denotes the detector loss defined in Equation 1, Locr denotes the OCR loss defined in Equation 2, and denotes the user-defined weighting coefficient for the OCR loss. - Apply the trained OCR branch to each cropped athlete image. Save the predicted player-number category or probability vector for each crop. If the player number is not visible or the OCR confidence is below the threshold defined in the implementation, record the player-number feature as unavailable rather than forcing a prediction.
- Combine the jersey color descriptor and player-number output into the semantic-feature file used by the tracking module.
NOTE: In the main SportsMOT validation run, the semantic extraction script processed 343,990 detections without missing frames or invalid crops. In the current revision package, the semantic extraction summary reported an overall color-and-OCR semantic extraction accuracy of 86.7% under the evaluated SportsMOT setting. The expected outcome of this section is a semantic-feature file in which each valid detection record is linked to a jersey color descriptor, a player-number output when available, and a flag indicating whether semantic information is available for tracking association.
4. Partition detection confidence levels
- Load the detector-output file for each video sequence. Collect the confidence scores of all athlete detections in each frame.
- Partition the frame-level confidence scores into high-, medium-, and low-confidence intervals using K-means clustering with K = 3, following the confidence-guided association workflow shown in Figure 2. Determine the adaptive confidence thresholds by minimizing the within-cluster variance according to Equation 4.
 (4)
(4)
Here, sd denotes the confidence score of detection d; D1, D2, and D3 denote the high-, medium-, and low-confidence intervals, respectively; μ1, μ2, and μ3 denote the mean confidence scores of the three intervals; and τ1 and τ2 denote the adaptive confidence thresholds obtained from the K-means clustering results.
NOTE: The confidence-partitioning script (scripts/formal_partition_confidence.py) is available in the JerseyTrack source code repository (https://doi.org/10.5281/zenodo.21274352). The confidence-partitioning module uses a NumPy-based one-dimensional K-means clustering procedure with K = 3. No separate configuration file is required; the input directory, output directory, and clustering parameter are specified through the command-line arguments. Execute the confidence-partitioning procedure using the following command: python scripts/formal_partition_confidence.py --detections-dir outputs/formal_runs/sportsmot_val_yolo11x_i960_e3_threshold_sweep/t005/detections --out-dir outputs/formal_runs/sportsmot_val_yolo11x_i960_e3_threshold_sweep/t005/confidence --k 3. The required software dependencies, including the NumPy version, are specified in environment.yml. - Run the confidence-partitioning procedure using the detector-output directory as the input.
NOTE: In this study, the detector-output directory was: outputs\formal_runs\sportsmot_val_yolo11x_i960_e3_threshold_sweep\t005\detections. The confidence-partition output directory was: outputs\formal_runs\sportsmot_val_yolo11x_i960_e3_threshold_sweep\t005\confidence. The generated output files included the per-sequence confidence CSV files, _confidence_frame_summary.csv, and _confidence_runtime.csv. - Assign a confidence-level label to every detection. Label high-confidence detections for motion-based association, medium-confidence detections for motion-semantic association, and low-confidence detections for trajectory recovery only. Preserve the original confidence score together with the assigned confidence-level label.
- Inspect the confidence-score distributions and representative frames, as illustrated in Figure 3. Verify that high-confidence detections correspond predominantly to complete and reliable athlete bounding boxes, whereas medium- and low-confidence detections mainly contain partial, occluded, blurred, or weak detections.
NOTE: The expected outcome of this section is a confidence-partition file containing the detection index, original confidence score, assigned confidence level, and frame-level adaptive confidence thresholds for every detection.
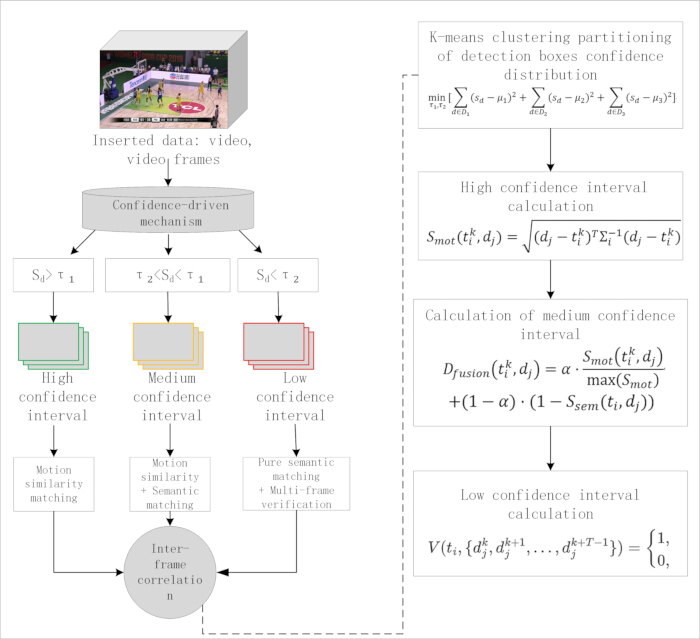
Figure 2. Confidence-guided association strategy. The workflow partitions detection confidence into high-, medium-, and low-confidence intervals using adaptive confidence clustering. High-confidence detections are associated using motion similarity, medium-confidence detections are associated using combined motion and jersey semantic similarity, and low-confidence detections are used for semantic-assisted trajectory recovery with multi-frame verification. The right panel summarizes the mathematical formulation used for confidence partitioning and association. Please click here to view a larger version of this figure.
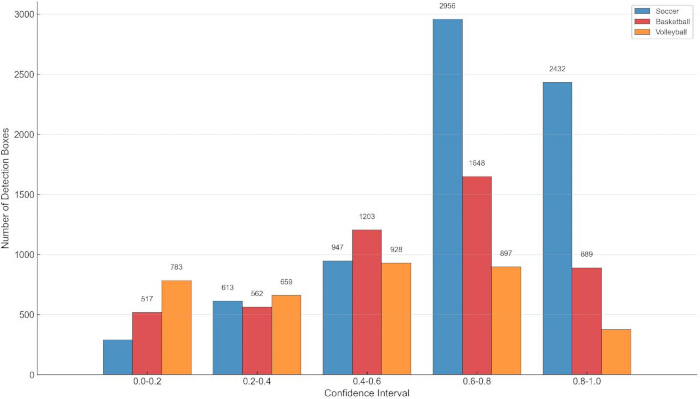
Figure 3. Distribution of detection confidence scores. The histogram shows the number of athlete detection boxes within five confidence intervals for soccer, basketball, and volleyball sequences in the SportsMOT dataset. The distribution illustrates differences in detector confidence across the evaluated sport categories. Please click here to view a larger version of this figure.
5. Run confidence-guided association
- Load the detector-output file, semantic-feature file, and confidence-partition file for each video sequence. Initialize the tracker using the first valid detections and maintain one trajectory state for each tracked athlete. For each subsequent frame, predict the position of every existing trajectory using the Kalman filter motion model.
- Calculate the motion similarity between each predicted trajectory and candidate detection using the Mahalanobis distance defined in Equation 5.
 (5)
(5)
Here, denotes the I-th trajectory in frame k,
  denotes the Kalman-predicted trajectory state, dj denotes the candidate detection,
  denotes the inverse covariance matrix of the predicted trajectory state, and Smot denotes the motion distance between the predicted trajectory and the detection.
NOTE: The core association workflow is implemented in jerseytrack/formal_tracker.py and executed through scripts/formal_track.py, both of which are available in the JerseyTrack source code repository (https://doi.org/10.5281/zenodo.21274352). No separate configuration file is required. All runtime parameters, including the confidence thresholds, maximum track age, motion-weight coefficients, and center-distance weight, are supplied through command-line arguments. The complete execution command and parameter settings are provided in Step 6.2. The implementation uses SciPy's linear sum assignment algorithm for Hungarian matching and NumPy for cost-based association. - Run the tracking workflow using the detector-output file, semantic-feature file, and confidence-partition file as inputs.
NOTE: In this study, the core tracker was implemented in jerseytrack\formal_tracker.py, and the tracking workflow was executed using scripts\formal_track.py. - Associate high-confidence detections with existing trajectories using motion consistency. Update matched trajectories and initialize new trajectories only when unmatched high-confidence detections satisfy the trajectory initialization criteria.
- Inspect the jersey semantic extraction outputs illustrated in Figure 4, and construct the jersey semantic feature vector for each detection by combining the team-color descriptor and player-number feature according to Equation 6.
fsem = [fcol;fid] (6)
Here, fsem denotes the fused semantic feature vector, fcol denotes the team-color descriptor, and fid denotes the player-number feature generated by the OCR branch. - Associate medium-confidence detections by combining motion similarity with jersey semantic similarity. Calculate the fused matching score according to Equation 7.
 (7)
(7)
Here, Ssem denotes the cosine similarity between the semantic feature vectors of the trajectory and candidate detection, Smot denotes the motion distance defined in Equation 5, and λ denotes the adaptive fusion coefficient balancing the motion and semantic similarity terms. - Calculate the adaptive fusion coefficient according to Equation 8.
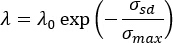 (8)
(8)
Here, λ0 denotes the initial motion-weight coefficient, σsd denotes the standard deviation of the detection-confidence scores in the current frame, and σmax denotes the maximum confidence-score standard deviation used for normalization. - Use low-confidence detections only for trajectory recovery. Match low-confidence detections with interrupted trajectories only when semantic information is available and the recovery criteria are satisfied. Apply multi-frame verification before restoring a trajectory identity, and discard detections that fail verification.
NOTE: When the player-number feature is unavailable, perform association using the available semantic information and motion consistency rather than forcing a player-number match. The expected outcome of this section is a frame-by-frame tracking record containing trajectory identities, bounding boxes, confidence-level labels, motion costs, semantic information, and final association decisions. In the revision evidence package, the tracking results were stored under: outputs\formal_runs\sportsmot_val_yolo11x_i960_e3_center_motion_sweep_round2\age45_h0p95_m0p94_l0p58_mw0p65_lw0p5_va0p25_hsp0p0_cdw0p1\tracking.
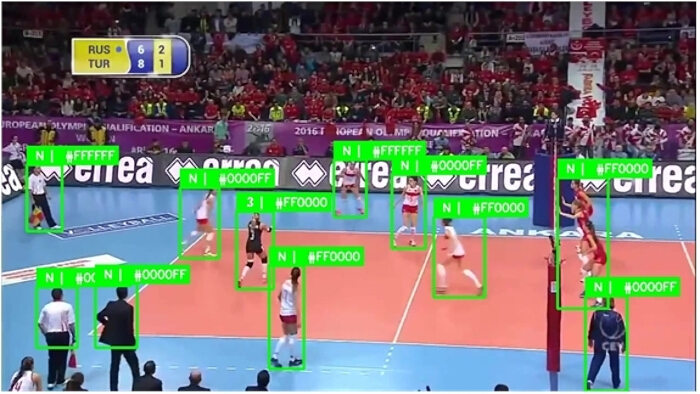
Figure 4. Jersey semantic feature extraction. Representative athlete detections are annotated with the extracted team-color descriptors and player-number information generated by the jersey semantic extraction module. The extracted semantic features are subsequently incorporated into confidence-guided data association. Please click here to view a larger version of this figure.
6. Run tracking inference and export results
- Run tracking inference for each video sequence using the prepared detector-output files, semantic-feature files, and confidence-partition files. Process the video frames in chronological order so that trajectory states, semantic history, and trajectory recovery decisions are updated consistently throughout the sequence. Use the same inference configuration for all evaluated sequences unless a dataset-specific setting is explicitly reported.
NOTE: Tracking inference was executed using scripts/formal_track.py, which is available in the JerseyTrack source code repository (https://doi.org/10.5281/zenodo.21274352). No separate configuration file is required. Execute tracking inference using the following command: python scripts/formal_track.py --detections-dir outputs/formal_runs/sportsmot_val_yolo11x_i960_e3_threshold_sweep/t005/detections --semantic-dir outputs/formal_runs/sportsmot_val_yolo11x_i960_e3_t005_color --confidence-dir outputs/formal_runs/sportsmot_val_yolo11x_i960_e3_threshold_sweep/t005/confidence --out-dir outputs/formal_runs/sportsmot_val_yolo11x_i960_e3_center_motion_sweep_round2/age45_h0p95_m0p94_l0p58_mw0p65_lw0p5_va0p25_hsp0p0_cdw0p1/tracking --max-age 45 --high-threshold 0.95 --medium-threshold 0.94 --low-threshold 0.58 --medium-motion-weight 0.65 --low-motion-weight 0.5 --velocity-alpha 0.25 --center-distance-weight 0.1. All unspecified parameters retained the default values recorded in the archived source code. - Following inference, apply the primary post-processing sequence using the following commands: python scripts/merge_tracklets.py and python scripts/sweep_track_filter.py --min-len 95.
- Export the tracking results in the format required by the evaluation toolkit. Include the frame index, trajectory identity, bounding-box coordinates, and all fields required by the benchmark evaluation format. Save one tracking-result file for each sequence using a consistent file-naming convention so that each result file can be matched with its corresponding ground-truth annotation file.
- Apply only the post-processing operations used in this study. Perform tracklet merging and track filtering using the post-processing scripts described in the revision package.
NOTE: In this study, the post-processing workflow used the following scripts:
⋅ scripts\merge_tracklets.py
⋅ scripts\sweep_track_filter.py
⋅ scripts\correct_identity_swaps.py
⋅ scripts\sweep_identity_swap_correction.py
⋅ scripts\interpolate_tracks.py
⋅ scripts\sweep_track_interpolation.py - Inspect the exported tracking results before quantitative evaluation. Confirm that trajectory identities remain numeric and consistent within each sequence, that no frame indices are missing, and that all bounding boxes remain within the image boundaries.
NOTE: The expected outcome of this section is a complete set of sequence-level tracking-result files ready for quantitative evaluation.
7. Evaluate tracking performance
- Evaluate the exported tracking-result files using the evaluation toolkit listed in the Table of Materials. Match each tracking-result file with the corresponding ground-truth annotation file and dataset split. Use the same evaluation configuration for all compared methods to ensure that performance differences arise from the tracking results rather than from the evaluation settings.
- Run the evaluation using the following command
\.venv\Scripts\python.exe evaluation\trackeval\scripts\nun_mot_challenge.py --GT_FOLDER datasets\SportsMOT\dataset\val --RESULTS_DIR outputs\formal_runs\sportsmot_val_yolo11x_i960_e3_center_motion_filter_fine
_round1\minlen95 --OUTPUT_FOLDER outputs\formal_runs\sportsmot_val_yolo11x_i960_e3_center_motion_filter_fine_
round1\minlen95\trackeval --TRACKERS_TO_EVAL JerseyTrack_i960_e3_center_motion_minlen95 --BENCHMARK SportsMOT --SPLIT_TO_EVAL val
NOTE: Evaluation was performed using the standard TrackEval (Version 1.3.0) metric implementation archived within the JerseyTrack reproducibility package. No modifications were made to the Higher Order Tracking Accuracy (HOTA), CLEAR, or Identity metric implementations. The repository includes the MOTChallenge-style execution wrapper located at evaluation/trackeval/scripts/run_mot_challenge.py, which configures the dataset and result paths and invokes the standard TrackEval evaluation metrics. - Record the evaluation metrics reported in the manuscript, including Multiple Object Tracking Accuracy (MOTA), IDentity F1 Score (IDF1), Higher Order Tracking Accuracy (HOTA), Detection Accuracy (DetA), Association Accuracy (AssA), false positives (FPs), false negatives (FNs), and identity-switching events. Export the evaluation summary as a table and retain the per-sequence evaluation files for verification.
- When comparing JerseyTrack with baseline methods, use the same dataset split, detector outputs, and evaluation configuration for all methods. Record the dataset, detector-output source, evaluation toolkit configuration, and metric values for each comparison.
- Inspect the evaluation logs to verify that all sequences are evaluated successfully and that no tracking-result files are missing.
NOTE: In this study, the primary TrackEval summary file was stored at: outputs\formal_runs\sportsmot_val_yolo11x_i960_e3_center_motion_filter_fine_
round1\minlen95\trackeval\JerseyTrack_i960_
e3_center_motion_minlen95\pedestrian_summary.txt. The expected outcome of this section is a complete evaluation summary table together with the per-sequence metric files supporting the reported Results and subsequent verification.
Access restricted. Please log in or start a trial to view this content.
Results
This section reports the quantitative and qualitative results obtained from the evaluated sports multi-object tracking experiments. The results focus on tracking accuracy, identity preservation, association quality, and robustness under the tested dataset settings. Performance claims are restricted to the evaluated methods, datasets, detector outputs, and evaluation toolkit configuration described in the Protocol and Implementation Setup.
Experimental setup and evaluation design
Access restricted. Please log in or start a trial to view this content.
Discussion
This study evaluated a confidence-guided sports MOT workflow that combines detection-confidence partitioning with jersey semantic cues. Confidence-guided association and semantic feature fusion have been investigated as complementary strategies for improving data association in multi-object tracking12,20,23,24,46. The results show that the complete JerseyTrack...
Access restricted. Please log in or start a trial to view this content.
Disclosures
The authors declare that they have no financial conflicts of interest.
Acknowledgements
The authors have no acknowledgments to declare.
Access restricted. Please log in or start a trial to view this content.
Materials
| Name | Company | Catalog Number | Comments |
|---|---|---|---|
| CUDA Runtime | NVIDIA | Version 12.8 | GPU computing runtime used for detector training, semantic feature extraction, and tracking inference. |
| EasyOCR | Jaided AI | Version 1.7.2 | Optical character recognition toolkit used for player-number recognition. |
| JerseyTrack source code | Authors | N/A | Custom implementation containing the data preparation, semantic feature extraction, confidence partitioning, tracking, post-processing, and evaluation scripts. Available at: https://doi.org/10.5281/zenodo.21274352 |
| Lightweight CRNN OCR model | Authors | N/A | Custom convolutional recurrent neural network (CRNN) used for player-number recognition. |
| MOT17 dataset | MOTChallenge | N/A | Public benchmark dataset used for cross-dataset evaluation. Available from: https://motchallenge.net/data/MOT17/ |
| MOT20 dataset | MOTChallenge | N/A | Public benchmark dataset used for cross-dataset evaluation. Available from: https://motchallenge.net/data/MOT20/ |
| motmetrics | motmetrics Developers | Version 1.4.0 | Library used for diagnostic multi-object tracking metric calculation. |
| NVIDIA GPU | NVIDIA | GeForce RTX 5090 D V2 | Graphics processing unit used for detector training and tracking inference. |
| NVIDIA GPU Driver | NVIDIA | Version 610.62 | GPU driver used in the experimental environment. |
| NumPy | NumPy Developers | Version 2.4.4 | Numerical computing library used for feature processing and data handling. |
| OpenCV | OpenCV | Version 4.10.0 | Computer vision library used for image loading, cropping, preprocessing, and visualization. |
| Python | Python Software Foundation | Version 3.12.2 | Programming language used throughout the workflow. |
| PyTorch | PyTorch Foundation | Version 2.11.0+cu128 | Deep learning framework used for detector and semantic model implementation. |
| scikit-learn | scikit-learn Developers | Version 1.9.0 | Machine-learning library used for K-means clustering during jersey-color extraction and confidence partitioning. |
| SoccerNet Tracking dataset | SoccerNet | N/A | Public football tracking benchmark used for cross-dataset evaluation. Available from: https://www.soccer-net.org/tasks/tracking |
| SportsMOT dataset | SportsMOT Benchmark | N/A | Primary benchmark dataset used for detector preparation and tracking evaluation. Available from: https://deeperaction.github.io/datasets/sportsmot.html |
| TeamTrack dataset | TeamTrack Benchmark | N/A | Public sports tracking benchmark used for cross-dataset evaluation. Available from: https://atomscott.github.io/TeamTrack/ |
| Torchvision | PyTorch Foundation | Version 0.26.0+cu128 | Computer vision library used with PyTorch for image transformation and model support. |
| TrackEval | TrackEval Developers | Version 1.3.0 | Evaluation toolkit used to calculate Multiple Object Tracking Accuracy (MOTA), IDentity F1 Score (IDF1), Higher Order Tracking Accuracy (HOTA), Detection Accuracy (DetA), Association Accuracy (AssA), false positives (FP), false negatives (FN), and identity switches (IDs). |
| Ultralytics | Ultralytics | Version 8.4.90 | Object detection framework used to train the detector and generate athlete detections. |
References
- Naik BT, Hashmi MF, Bokde ND. A comprehensive review of computer vision in sports: open issues, future trends and research directions. Applied Sciences. 2022;12(9):4429-46.
- Cao W, Wang X, Liu X, Xu Y. A deep learning framework for multi-object tracking in team-sports videos. IET Computer Vision. 2024;18(5):574-90.
- Fu X, et al. A novel dataset for multi-view multi-player tracking in soccer scenarios. Applied Sciences. 2023;13(9):5361-77.
- Guo Y, et al. Does visual training enhance athletes' decision-making skills and sport-specific performance? A systematic review and meta-analysis. Scand J Med Sci Sports. 2025;35(10):e70140.
- Chen X, et al. Multi-object detection and tracking based on CRF network and spatio-temporal attention for sports videos. Scientific Reports. 2025;15(1):6808-21.
- Cheng X, Zhao H, Deng Y, Shen S. Multi-object tracking with predictive information fusion and adaptive measurement noise. Applied Sciences. 2025;15(2):736-48.
- Hu Q, Scott A, Yeung C, Fujii K. Basketball-SORT: an association method for complex multi-object occlusion problems in basketball multi-object tracking. Multimedia Tools Appl. 2024;83(38):86281-97.
- Meng W, Duan S, Ma S, Hu B. Motion-Perception Multi-Object Tracking (MPMOT): enhancing multi-object tracking performance via motion-aware data association and trajectory connection. Journal of Imaging. 2025;11(5):144.
- Nie G, Wang X, Zhang D, Wang H. SCT-Diff: seamless contextual tracking via diffusion trajectory. Journal of Imaging. 2026;12(1):38.
- Yue Y, et al. Improving multi-object tracking by full occlusion handle and adaptive feature fusion. IET Image Processing. 2023;17(12):3423-40.
- Li H, et al. Synergistic-aware cascaded association and trajectory refinement for multi-object tracking. Image Vis Comput. 2025;154:105695.
- Wang C, Xie H. FCD-Net: feature decorrelation and confidence-driven dynamic fusion for robust pedestrian recognition in autonomous driving. IEEE Trans Intell Transp Syst. 2025;26(1):1-13.
- Wan S, Chen W. Improved multi-target athlete tracking in sports videos using IYOLOv8-MTD and enhanced DeepSORT with hybrid attention and IMM. Informatica. 2025;49(35):101-16.
- Sun Z, et al. Multiple pedestrian tracking under occlusion: a survey and outlook. IEEE Trans Circuits Syst Video Technol. 2025;35(2):1009-27.
- Qian H, et al. Low-altitude multi-object tracking via graph neural networks with cross-attention and reliable neighbor guidance. Remote Sensing. 2025;17(20):3502.
- Liu C, Li H, Wang Z. FastTrack: a highly efficient and generic GPU-based multi-object tracking method with parallel Kalman filter. Int J Comput Vis. 2024;132(5):1463-83.
- Urdiales J, Martín D, Armingol JM. An improved deep learning architecture for multi-object tracking systems. Integr Comput Aided Eng. 2023;30(2):121-34.
- You L, et al. Multi-object vehicle detection and tracking algorithm based on improved YOLOv8 and ByteTrack. Electronics. 2024;13(15):3033.
- Stanczyk T, Yoon S, Bremond F. No train yet gain: towards generic multi-object tracking in sports and beyond [conference paper]. In: Proceedings of the IEEE/CVF Conference on Computer Vision and Pattern Recognition Workshops; 2025. p. 6085-94. https://doi.org/10.48550/arXiv.2506.01373
- Mandel T, et al. Detection confidence driven multi-object tracking to recover reliable tracks from unreliable detections. Pattern Recognit. 2023;135:109107.
- Hou M, Wu Y, Shi H, Mu X. A two-stage multi-object tracking algorithm with transformer and attention mechanism. Scientific Reports. 2025;15(1):31414.
- Wenkel S, et al. Confidence score: the forgotten dimension of object detection performance evaluation. Sensors. 2021;21(13):4350.
- Zhang F, Hu Y, Li Z, Luo D. Two-stage multi-object tracking via low confidence dynamic adaptive matching enhancement for autonomous driving. Applied Soft Computing. 2025;168:112101.
- Stanojevic VD, Todorovic BT. BoostTrack: boosting the similarity measure and detection confidence for improved multiple object tracking. Mach Vis Appl. 2024;35(3):53.
- Tan S, Kuang Z, Jin B. AppleYOLO: apple yield estimation method using improved YOLOv8 based on Deep OC-SORT. Expert Syst Appl. 2025;272:126764.
- Li YF, et al. Multi-object tracking with robust object regression and association. Comput Vis Image Underst. 2023;227:103586.
- Mao H, Chen Y, Li Z, Chen F, Chen P. SCTracker: multi-object tracking with shape and confidence constraints. IEEE Sensors Journal. 2023;24(3):3123-30.
- Ma J, Yang J, Zhang J, Fu F. Online multiple object tracker with enhanced features. Journal of Electronic Imaging. 2023;32(1):013030.
- Liu Y, et al. A full-detection association tracker with confidence optimization for real-time multi-object tracking. J Real-Time Image Process. 2024;21(4):1-15.
- Song Z, et al. Temporal coherent object flow for multi-object tracking [conference paper]. In: Proceedings of the AAAI Conference on Artificial Intelligence; 2025;39(7):6978-86. https://doi.org/10.1609/aaai.v39i7.32749.
- Scarrica VM, Staiano A. Learning from outputs: improving multi-object tracking performance by tracker fusion. Technologies. 2024;12(12):239.
- Miah M, Bilodeau GA, Saunier N. Learning data association for multi-object tracking using only coordinates. Pattern Recognit. 2025;160:111169.
- Yang C, Yang M, Li H. A survey on soccer player detection and tracking with videos. Visual Computer. 2025;41(2):815-29.
- Pham DT, Thuy NTT, Tran LQ. SportsORT: overcoming challenges of multi-object tracking in sports through domain-specific features and out-of-view re-association. Mach Vis Appl. 2025;36(6):1-17.
- Naik BT, Hashmi MF, Geem ZW, Bokde ND. DeepPlayer-Track: player and referee tracking with jersey color recognition in soccer. IEEE Access. 2022;10:32494-509.
- Scott A, et al. TeamTrack: a dataset for multi-sport multi-object tracking in full-pitch videos. Sports Engineering. 2024;27(2):24.
- Vats K, et al. Player tracking and identification in ice hockey. Expert Syst Appl. 2023;213:119250.
- Liu W, Yao J, Jiang F, Wang M. An improved multi-object tracking algorithm designed for complex environments. Sensors. 2025;25(17):5325.
- Kausalya K, Kanaga Suba Raja S. OTRN-DCN: an optimized transformer-based residual network with deep convolutional network for action recognition and multi-object tracking of adaptive segmentation using soccer sports video. Int J Wavelets Multiresolut Inf Process. 2024;22(1):2350034.
- Lopes JM, et al. Object and event detection pipeline for rink hockey games. Future Internet. 2024;16(6):179.
- Thulasya Naik B, Hashmi MF, Gupta A. EIoU-distance loss: an automated team-wise player detection and tracking with jersey colour recognition in soccer. Connection Science. 2024;36(1):2291991.
- Liu H, et al. Automated player identification and indexing using two-stage deep learning network. Scientific Reports. 2023;13(1):10036.
- Bhargavi D, Gholami S, Pelaez Coyotl E. Jersey number detection using synthetic data in a low-data regime. Front Artif Intell. 2022;5:988113.
- Dendorfer P, et al. MOTChallenge: a benchmark for single-camera multiple target tracking. Int J Comput Vis. 2021;129(4):845-81.
- Luiten J, et al. HOTA: a higher order metric for evaluating multi-object tracking. Int J Comput Vis. 2021;129(2):548-78.
- Pal SK, Pramanik A, Maiti J, Mitra P. Deep learning in multi-object video tracking: a review. Mach Vis Appl. 2021;51(9):6400-29.
Access restricted. Please log in or start a trial to view this content.