The Meta-Learning Hybrid Quantum-Classical Neural Classifier (ML-HQNC) protocol integrates quantum-inspired cognitive modeling, data preprocessing, feature selection, and hybrid neural learning to identify engineering students' interests. This protocol presents a reproducible hybrid quantum-inspired machine learning workflow for educational analytics, demonstrated through engineering student interest identification using multidimensional educational data.
A subscription to JoVE is required to view this content. Sign in or start your free trial.
Research Article
Data-Driven Student Interest Identification for Intelligent Teaching Management Systems in Engineering Colleges
In This Article
Summary
Abstract
This protocol presents a quantum-inspired computational framework for identifying engineering students' interests using multidimensional educational and behavioral data. The objective is to provide a systematic and reproducible workflow that integrates data preprocessing, behavioral pattern analysis, feature selection, and hybrid neural learning to support educational decision-making and personalized learning. The workflow begins with Box-Cox Robust IQR Scaling (BCRIS) to preprocess and normalize educational data by reducing semantic noise and improving data quality. Student learning behaviors are subsequently analyzed using the Quantum Cognitive State Model (QCSM), which represents behavioral transitions and evolving learning preferences under uncertain conditions. Relevant features are then selected using the Quantum-Enhanced Swarm–Whale Optimization Feature Selection (QES-WOFS) algorithm to reduce feature redundancy and identify informative behavioral characteristics. Finally, the Meta-Learning Hybrid Quantum-Classical Neural Classifier (ML-HQNC) integrates quantum-inspired learning with deep neural networks to classify student interests. The protocol was validated using a publicly available educational dataset. Model performance was evaluated using conventional metrics, including accuracy, F1-score, and the area under the receiver operating characteristic curve (AUC), together with Interest Detection Precision (IDP), Quantum Pattern Stability Index (QPSI), and Cross-Domain Adaptability Gain (CDAG). The framework achieved an overall classification accuracy of 96.17% on the evaluated dataset. This protocol provides a reproducible computational workflow for analyzing multidimensional educational data to support intelligent educational management and personalized learning applications.
Introduction
Educational management systems are increasingly used across the education sector, driven by rapid advances in information technology and computer networks. The continued growth of higher education has been accompanied by increased student enrollment, particularly among engineering students, resulting in a substantial increase in educational management data. This growth supports sustainable educational development, accelerates educational informatization, and facilitates the establishment of standardized educational management systems that improve the consistency and efficiency of teaching administration. Machine Learning (ML) provides computational techniques that enable systems to analyze data, learn from patterns, and continuously improve predictive performance without explicit programming1,2.
Educational quality is a fundamental component of higher education. In recent years, examinations have been widely used to assess engineering students' understanding of course content and their ability to acquire new knowledge, thereby promoting continuous improvements in educational quality. Learner-centered environments can be established by leveraging diverse learning resources available through online educational platforms and applying multiple learning theories to address the needs of different learners. Effective teaching plays a key role in improving learning outcomes among engineering students in universities and colleges3,4. Furthermore, effective teaching promotes a positive learning environment, supports students' understanding of course content, and enhances academic performance. Educational quality is evaluated using multiple indicators throughout the learning process, including curriculum structure, classroom environment, and teaching content.
Higher education promotes students' intellectual, personal, and social development. At the same time, student engagement—including behavioral, emotional, and cognitive dimensions—and academic persistence have become important determinants of learning outcomes. High levels of student engagement contribute significantly to long-term academic success5,6. Advances in educational technology have created new opportunities for data-driven educational analytics by modeling complex nonlinear relationships among students' cognitive, behavioral, and academic characteristics using Machine Learning (ML) and Deep Learning (DL) techniques.
A major challenge remains the effective observation and assessment of classroom dynamics while accounting for evolving student behaviors. Traditional approaches for evaluating educational quality and analyzing engineering students' behavior are often time-consuming and susceptible to subjective human judgment. Student inattention during classroom activities adversely affects learning outcomes and academic performance7,8. However, maintaining sustained attention among engineering students remains challenging because of internal and external distractions and fluctuations in motivation.
Assessing and improving student engagement has become increasingly important with the widespread adoption of online learning, smart classrooms, and other interactive educational technologies. Ensuring inclusion across diverse groups of engineering students further highlights the need for comprehensive frameworks that integrate technology-driven approaches with educational practice while maintaining privacy and ethical standards. In addition, limited model transparency and challenges associated with technology integration9,10, including methodological bias and educational equity, continue to hinder the development of predictive systems capable of supporting learners through continuous monitoring.
Machine learning approaches have been widely used to address educational challenges such as predicting student risk and dropout rates. These approaches have demonstrated the ability to identify high-risk students, thereby supporting interventions that improve academic achievement11. Artificial Intelligence (AI)-based educational management systems have also been developed to enhance both administrative and academic processes within higher education institutions. Educational datasets commonly include academic records such as course grades, attendance records, and enrollment history12.
Previous studies have analyzed student behavior from three perspectives: evaluation data, methods, and outcomes13,14. Prediction models based on information literacy have been developed to analyze the behavioral characteristics of college students. These studies primarily focus on learner behavior assessment using Deep Learning (DL) methods. However, research on intelligent teacher behavior assessment remains at an early stage, limiting progress in this area. Fast Region-based Convolutional Neural Networks (Fast R-CNNs) have been applied to educational datasets to improve classroom activity detection, demonstrating significant performance improvements over traditional methods15.
Bi-Directional Long Short-Term Memory (Bi-LSTM) models incorporating self-monitoring mechanisms have also improved the accuracy of grade prediction for college students. Similarly, prediction models developed using online learning behavior datasets have demonstrated improved predictive performance16,17,18. In addition, k-means clustering (KMC) has been used to identify the characteristics of different student groups through cluster analysis, providing insights into student behavior that support improvements in teaching, management, and learning. Deep learning-based strategies have also been proposed to improve the detection and evaluation of classroom teaching behaviors. In these approaches, classroom behavioral features are used to establish relationships between feature representations and hyperplanes using linearly separable starting values for the Support Vector Machine (SVM)19,20. However, challenges such as occlusion, fine-grained behavioral details, and environmental interference continue to limit the accuracy of engineering student behavior recognition in classroom environments.
Deep learning has also been applied to outcome-based evaluation of university courses, including educational assessment in political and ideological education21,22. The effectiveness of these prediction models has been demonstrated using publicly available educational datasets. Feed-forward Spiking Neural Networks (FSNNs) have been employed to predict students' academic performance using data collected from online learning platforms and learning management systems. As illustrated in Figure 1, the proposed computational workflow incorporates an educational assessment dataset to identify engineering students' interests through sequential stages of data preprocessing, behavioral pattern analysis, feature selection, and classification. Table 123,24,25,26,27,28,29,30,31,32 summarizes representative methods reported in previous studies, together with the techniques employed and their associated limitations for identifying student interest within learning management systems.
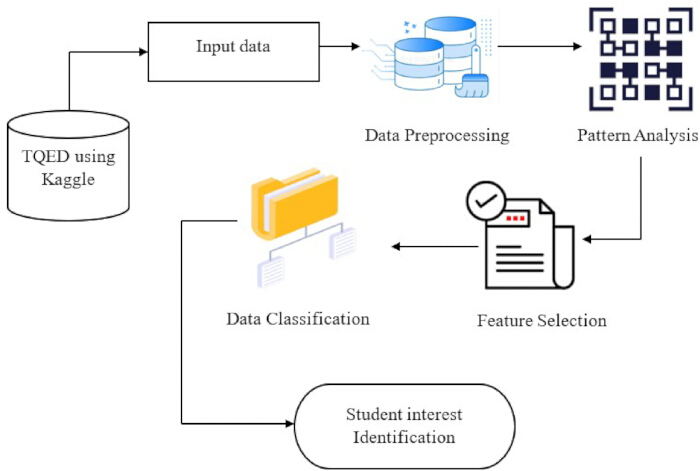
Figure 1: Student interest identification framework. Overall workflow of the proposed engineering student interest identification framework, including data acquisition, preprocessing, behavioral pattern analysis, feature selection, and classification. Please click here to view a larger version of this figure.
Table 1: Student behavior analysis in teaching management. Summary of representative methods, techniques, datasets, evaluation metrics, and reported limitations for student behavior analysis in teaching management. Please click here to download this Table.
The Swin Transformer and Lightweight Feature Pyramid Network (FPN) have been applied to student classroom behavior detection by efficiently processing multi-scale feature maps33. In addition, the Fruit-Fly-Optimized Adjustable Recurrent Neural Network (PFFO-ARNN) has been used to analyze students' online learning behavior and predict course achievement34. Studies based on student behavior data collected from university learning management systems have also highlighted the inefficiency and time-consuming nature of monitoring classroom behavior with conventional deep learning methods35. Table 236,37,38,39,40,41,42,43,44,45,46,47 summarizes representative classification methods, datasets, evaluation metrics, and reported limitations for intelligent teaching management systems in engineering education.
Table 2: Deep learning-based intelligent teaching management systems for engineering education. Comparison of representative deep learning-based teaching management systems, datasets, evaluation metrics, and reported limitations. Please click here to download this Table.
A previous study48 developed a blended teaching quality assessment model based on Deep Belief Networks (DBNs) and proposed a mixed evaluation strategy for assessing teaching quality in universities. The proposed approach outperformed the conventional Genetic Algorithm (GA) in both classification accuracy and execution time, achieving over 95% accuracy in under 5.4 ms. The model was trained using labeled educational datasets and evaluated using an independent testing strategy49,50. The reported results demonstrated strong predictive performance, with a Mean Absolute Error (MAE) of 0.593% and a Root Mean Square Error (RMSE) of 0.785%.
Recent attention-enhanced architectures, such as KANFormer51, integrate multi-head self-attention with Kolmogorov-Arnold networks to improve student performance prediction by capturing complex feature interactions. Transformer-based knowledge tracing models have also demonstrated improved prediction accuracy and interpretability by leveraging attention mechanisms to model students' learning trajectories52. Although transformer- and attention-based architectures have improved performance on educational prediction tasks by modeling contextual dependencies and long-range feature interactions, these approaches primarily focus on student performance prediction or knowledge tracing rather than uncertainty-aware student interest identification through quantum-inspired cognitive modeling, optimized feature selection, and hybrid meta-learning.
Despite recent advances in machine learning and deep learning for educational analytics, existing methods for identifying engineering students' interests have several limitations. Many conventional approaches focus primarily on prediction accuracy while overlooking the multifaceted nature of student behavior, including evolving learning preferences, behavioral uncertainty, contextual relationships, and semantic interactions. Furthermore, these methods often rely on conventional feature engineering and deterministic learning strategies, which may not adequately capture nonlinear behavioral patterns or adapt to dynamic learning environments. Consequently, a more comprehensive framework integrating robust data preprocessing, intelligent behavioral modeling, adaptive feature selection, and hybrid learning techniques is needed to improve the analysis of complex educational data.
To address these limitations, the proposed framework integrates robust data preprocessing, quantum-inspired behavioral modeling, optimized feature selection, and hybrid quantum-classical neural learning into a unified computational workflow for identifying engineering students' interests. By combining these complementary components, the proposed protocol provides a systematic and reproducible approach for analyzing complex educational data to support personalized learning and educational decision-making.
The objective of this study is to develop and validate the CQEI framework using multidimensional educational and behavioral data for engineering student interest identification. The framework combines robust data preprocessing, quantum-inspired cognitive state modeling, optimized feature selection, and the Meta-Learning Hybrid Quantum-Classical Neural Classifier (ML-HQNC) to analyze students' learning behaviors and facilitate accurate interest identification. Performance is evaluated using standard metrics, including accuracy, F1-score, and the area under the receiver operating characteristic curve (AUC), together with Interest Detection Precision (IDP), Quantum Pattern Stability Index (QPSI), and Cross-Domain Adaptability Gain (CDAG). By integrating these complementary components into a single computational workflow, the proposed framework provides a systematic approach for educational analytics and intelligent educational decision-making.
Access restricted. Please log in or start a trial to view this content.
Protocol
This study used a publicly available, anonymized dataset obtained from the Kaggle repository. No human participants were directly recruited or involved, and no personally identifiable information was collected. Therefore, institutional ethical approval and informed consent were not required. The research tools used in this study are listed in the Table of Materials.
1. Overview of the CQEI framework
The proposed Quantum-Inspired Conceptual Education Intelligence (CQEI) framework integrated data preprocessing, behavioral pattern analysis, feature selection, and classification to identify engineering students' interests using the Teaching Quality Evaluation Dataset obtained from the Kaggle repository. The dataset was first preprocessed using the Box–Cox Robust IQR Scaling (BCRIS) method to reduce semantic noise and normalize the input features. Student behavioral patterns were subsequently analyzed using the Quantum Cognitive State Model (QCSM). The Quantum-Enhanced Swarm–Whale Optimization Feature Selection (QES-WOFS) algorithm was then applied to identify informative features while reducing feature redundancy by modeling quantum-optimal selection, feedback significance, and transient behavioral variations. Finally, the Meta-Learning Hybrid Quantum-Classical Neural Classifier (ML-HQNC) integrated quantum-inspired learning with deep residual semantic layers to identify students' interests.
The overall workflow of the proposed ML-HQNC framework is illustrated in Figure 2. The protocol comprised six sequential stages, beginning with acquisition of the educational dataset from the Kaggle repository, followed by data preprocessing using Box–Cox Robust IQR Scaling (BCRIS), feature transformation and behavioral representation using the Quantum Cognitive State Model (QCSM), and feature selection using the Quantum-Enhanced Swarm–Whale Optimization Feature Selection (QES-WOFS) algorithm. The selected features were subsequently used for model training and validation with the Meta-Learning Hybrid Quantum-Classical Neural Classifier (ML-HQNC), and the framework was finally evaluated using accuracy, F1-score, the area under the receiver operating characteristic curve (AUC), Interest Detection Precision (IDP), Quantum Pattern Stability Index (QPSI), and Cross-Domain Adaptability Gain (CDAG).
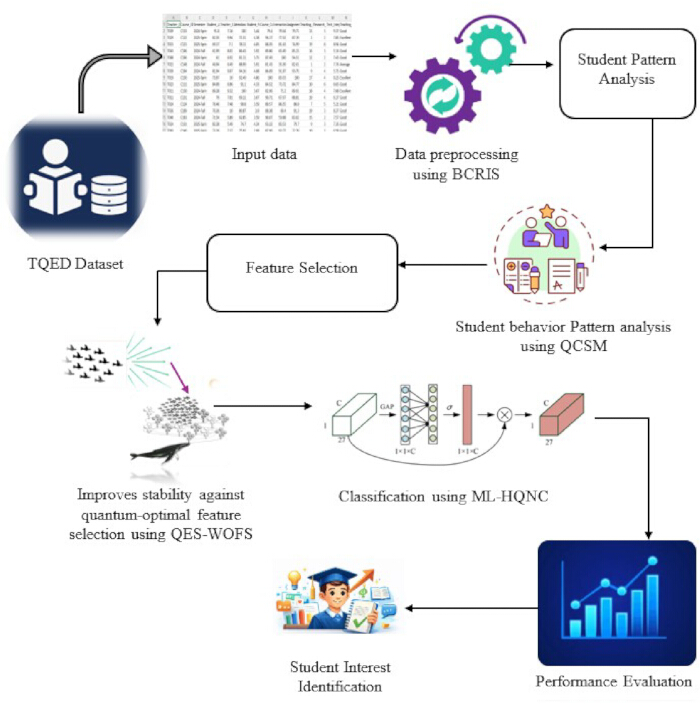
Figure 2: Meta-Learning Hybrid Quantum-Classical Neural Classifier (ML-HQNC) framework. Overall architecture of the proposed ML-HQNC framework integrating Box–Cox Robust IQR Scaling (BCRIS) for data preprocessing, the Quantum Cognitive State Model (QCSM) for behavioral pattern analysis, the Quantum-Enhanced Swarm–Whale Optimization Feature Selection (QES-WOFS) algorithm for feature selection, and hybrid quantum-classical neural learning for student interest classification. Please click here to view a larger version of this figure.
2. Teaching quality evaluation dataset
The proposed framework was developed using the publicly available Teaching Quality Evaluation Dataset obtained from the Kaggle repository. The dataset contained 1,014 educational records with 14 multidimensional features representing academic performance, assessment scores, attendance, instructional characteristics, and student behavioral indicators collected through the Comprehensive Education Management Platform (CEMP). These attributes provided the multidimensional educational information needed to model nonlinear relationships associated with identifying engineering students' interests.
As shown in Figure 3, the dataset was divided into training (80%) and testing (20%) subsets. A total of 800 records were used to train the proposed model, with 200 reserved for performance evaluation. The dataset is publicly available at: https://www.kaggle.com/datasets/ziya07/teaching-quality-evaluation-dataset. The training and testing datasets were subsequently processed using the proposed framework to construct the learning model and improve its predictive capability.
Although the underlying dataset is titled the Teaching Quality Evaluation Dataset, this study aimed to identify engineering students' interests. The educational, behavioral, and instructional attributes contained in the dataset served as input variables for training and evaluating the proposed framework. Consequently, all reported prediction results and performance metrics describe the framework's effectiveness in identifying engineering students' interests rather than evaluating teaching quality. Before data preprocessing, the imported dataset was verified to ensure that all 1,014 records were successfully loaded, the dataset schema matched the expected format, and any missing or duplicate records had been identified and addressed.
3. Data pre-processing using box–cox robust IQR scaling (BCRIS)
The Box–Cox Robust IQR Scaling (BCRIS) method was used to preprocess and normalize the educational dataset by combining the Box–Cox transformation with interquartile range (IQR)-based robust scaling to reduce the influence of extreme values. Symmetry correction together with median-centered normalization generated statistically stable and scalable feature representations suitable for subsequent analysis. Within the proposed educational intelligence framework, BCRIS transformed multidimensional educational, instructional, and behavioral indicators into variance-controlled feature representations. Features including attendance_rate, interactive_sessions_percentage, and related educational variables were normalized to improve the consistency of the training and testing datasets. Detailed mathematical explanations are provided in Supplementary File 1 (Section S1). The BCRIS method provided a quantum-compatible preprocessing strategy that normalized heterogeneous educational data prior to subsequent statistical analysis while preserving the underlying behavioral characteristics required for downstream modeling. Before behavioral analysis, the preprocessing pipeline was verified to ensure that the normalized dataset contained no invalid or missing values, semantic noise had been reduced, and the processed features were suitable for subsequent behavioral modeling.
4. Feature transformation and behavioral representation using the quantum cognitive state model (QCSM)
The Quantum Cognitive State Model (QCSM) was implemented to model the dynamics of engineering students' interests using quantum-inspired probabilistic representations. Student interest was represented as an overlap of multiple conceptual states that reflected the hierarchy of cognitive concepts, uncertainty, conceptual overlap, simultaneous engagement with multiple topics, hesitant or indecisive learning behaviors, and the probability of shifts in learning preferences. The multidimensional indicators from the Engineering Teaching Quality Assessment dataset, including Student_Avg_Score, Attendance_rate, and Student_Feedback_Rating, were represented as amplitude-weighted cognitive transitions within a normalized quantum state space. The QCSM combined quantum-state transitions with interference-based conceptual alignment to generate quantum-inspired cognitive representations that reflected the stability and evolution of student interest over time. Detailed mathematical formulations are provided in Supplementary File 1 (Section S2). The QCSM modeled probabilistic cognitive states to represent knowledge acquisition, conceptual change, learning engagement, and subject interest through normalized quantum-state representations. Behavioral representations were verified across all student records to ensure that the extracted cognitive-state features accurately captured learning behaviors and topic transitions.
5. Feature selection using Quantum-Enhanced Swarm–Whale Optimization Feature Selector (QES-WOFS) algorithm
The Quantum-Enhanced Swarm–Whale Optimization Feature Selection (QES-WOFS) algorithm was used to identify the optimal feature subset and determine high-information behavioral characteristics from multidimensional educational data. Quantum-inspired search mechanisms enhanced the integration of global and local search strategies for feature optimization. Educational variables, including interactive_sessions_percentage, assignments_time_percentage, and course_completion_rate, were evaluated according to their correlation with the target outcome. Candidate feature subsets were modeled using quantum probability representations, while a quantum tunneling mechanism enabled probabilistic transitions beyond local optima. Feature importance was estimated using marginal likelihood to quantify each feature's contribution to classification performance and adaptive swarm states. The QES-WOFS algorithm selected stable and behaviorally meaningful features, improving robustness to noise, semester-to-semester variation, and periodic behavioral fluctuations.
To overcome the limitations associated with using either Whale Optimization Algorithm (WOA) or Particle Swarm Optimization (PSO) independently, the QES-WOFS algorithm combined PSO-based global exploration with WOA-based local exploitation. A quantum tunneling mechanism further enabled probabilistic transitions beyond local optima, thereby increasing population diversity, reducing feature redundancy, and improving convergence toward an optimal feature subset for identifying engineering student interest.
Detailed mathematical formulations are provided in Supplementary File 1 (Section S3). The QES-WOFS algorithm combined quantum probabilistic feature encoding, a PSO-adapted velocity strategy, and a whale-inspired spiral search mechanism to identify the most informative educational features. Hyperparameters were empirically optimized using the training dataset. Candidate values were evaluated through systematic experimentation, and the combination producing the highest validation performance was selected. Specifically, the Box–Cox transformation parameter (λ = 0.25), the contrastive loss margin (m = 1.0), and the quantum tunneling coefficients (α = 0.7 and β = 0.3) were selected based on validation accuracy, F1-score, and convergence behavior. Before classifier training, the feature selection results were verified to ensure that the QES-WOFS algorithm had selected the optimal feature subset and removed redundant or low-importance features.
6. Model training and validation using the meta-learning hybrid quantum-classical neural classifier (ML-HQNC)
The Meta-Learning Hybrid Quantum-Classical Neural Classifier (ML-HQNC) was implemented by combining deep neural networks with quantum-inspired computations to identify engineering students' interests. Multi-head quantum attention mechanisms and deep residual semantic layers captured complex nonlinear relationships within multidimensional educational data represented using variational quantum circuits (VQCs). Behaviorally derived features, including student_average_grade, attendance_rate, and student_feedback_rating, were projected into a quantum state space, where normalized inputs were transformed into amplitude-based quantum representations to model overlapping and probabilistic engagement patterns. Normalized student behavioral feature vectors were calculated according to the equations provided in Supplementary File 1 (Section S4). The ML-HQNC subsequently classified and identified engineering students' interests.
The ML-HQNC classifier employed an episodic meta-learning strategy during training. One randomly selected meta-learning task from the training dataset was assigned to each episode. While maintaining the class distribution, the training data were divided into a support set (80%) and a query set (20%). The support set was used for task-specific parameter adaptation through the inner optimization loop, whereas the query set evaluated the adapted model and calculated the meta-loss used to update the shared parameters. A total of 100 meta-learning tasks were generated during each training cycle. Five gradient update steps with an inner learning rate of 0.001 were used for inner-loop adaptation, whereas the Adam optimizer with an outer learning rate of 0.0005 optimized the meta-parameters. Random task sampling was repeated for every training epoch to expose the model to diverse behavioral patterns and improve generalization to previously unseen student profiles. The loss estimation for quantum contrastive alignment is described in Supplementary File 1 (Equations 41–45). Model training was verified to ensure successful convergence without computational errors and that the training and validation loss curves had stabilized over successive epochs.
Access restricted. Please log in or start a trial to view this content.
Results
The proposed ML-HQNC framework was evaluated against Fast R-CNN, Bi-LSTM, CNN, and XGBoost using conventional classification metrics, including Accuracy, Precision, Recall, F1-score, and the area under the receiver operating characteristic curve (AUC), together with the proposed evaluation metrics Interest Detection Precision (IDP), Quantum Pattern Stability Index (QPSI), and Cross-Domain Adaptability Gain (CDAG). The mathematical definitions of these metrics are provided in Supplementary File 1 (Section S5)
Access restricted. Please log in or start a trial to view this content.
Discussion
The proposed ML-HQNC framework demonstrated improved performance in identifying engineering student interest by integrating quantum-inspired behavioral modeling, adaptive feature selection, and meta-learning into a unified computational workflow. Compared with Fast R-CNN, Bi-LSTM, CNN, and XGBoost, the framework consistently achieved higher performance across conventional classification metrics and the proposed behavioral evaluation metrics. These findings suggest that combining quantum-inspired cognitive state represent...
Access restricted. Please log in or start a trial to view this content.
Disclosures
The author declares no competing interests.
Acknowledgements
The author thanks Bengbu University, Bengbu, China, for providing the academic support and research environment that facilitated this study. This work was supported by the 2025 Annual School-Level Quality Engineering Project of Bengbu University (No. 2025zhkc1).
Access restricted. Please log in or start a trial to view this content.
Materials
| Name | Company | Catalog Number | Comments |
|---|---|---|---|
| Baseline Models (Fast R-CNN, Bi-LSTM, CNN, XGBoost) | Open-source implementations | Fast R-CNN (2015); TensorFlow/Keras implementation v2.16; XGBoost v2.1.1 | Benchmark models used for comparative performance evaluation. |
| BCRIS Preprocessing Module | Developed in this study | Version 1.0 | Custom preprocessing module implementing Box-Cox transformation and robust IQR normalization. |
| Jupyter Notebook | Project Jupyter | Version 7.2.2 | Interactive development environment used for implementation, training, and testing. |
| ML-HQNC Classifier | Developed in this study | Version 1.0 | Proposed hybrid quantum-classical neural network classifier with meta-learning framework. |
| Python | Python Software Foundation | Version 3.11.9 | Programming language used for model development and experimentation. |
| PyTorch | PyTorch Foundation | Version 2.5.1 | Deep learning framework used for model implementation and training. |
| QCSM Model | Developed in this study | Version 1.0 | Proposed Quantum Cognitive State Model for behavioral pattern representation. |
| QES-WOFS Algorithm | Developed in this study | Version 1.0 | Proposed Quantum-Enhanced Swarm–Whale Optimization Feature Selection algorithm. |
| Scikit-learn | Scikit-learn Developers | Version 1.6.1 | Machine learning library used for preprocessing, feature selection, and evaluation. |
References
- Xu Q, Deng H. Research on education management system based on machine learning and multidimensional data modeling. Applied Mathematics and Nonlinear Sciences. 2024;9(1). https://dialnet.unirioja.es/servlet/articulo?codigo=9386765
- Li D. An interactive teaching evaluation system for preschool education in universities based on machine learning algorithm. Comput Hum Behav. 2024;157:108211. https://doi.org/10.1016/j.chb.2024.108211
- Chunhua H, Kaabar MKA, Qiuju X, Zhang G. Fuzzy comprehensive evaluation of students' classroom experience in online teaching. International Journal of Emerging Technologies in Learning. 2023;18(21):79-88.
- He Z, et al. Assessment of influencing factors of college and universities' teaching effects using fuzzy and deep learning techniques. Scientific Reports. 2026;16:5168. https://doi.org/10.1038/s41598-026-35940-5
- Liu J. Innovation and practice of educational management system in colleges and universities based on the concept of data analysis education. Applied Mathematics and Nonlinear Sciences. 2023;9(1). https://www.researchgate.net/publication/377568313
- Li C, Cao Z. Deep learning-based AI model for predicting academic success and engagement among physical higher education students. Scientific Reports. 2025;15:45471. https://doi.org/10.1038/s41598-025-29000-7
- Kong Y, Dong R, Zhang H. Classroom behavior analysis and digital teaching quality evaluation based on spatiotemporal graph neural network. Discover Artificial Intelligence. 2025;5:404. https://doi.org/10.1007/s44163-025-00623-z
- Zedan F, Jabali RR, Raiyn J. Detecting student inattention using deep learning and behavioral analysis. Journal of International Education Practice. 2026;9(1):1-17.
- Feng F. Deep learning-based model for analyzing student engagement in activities. Scientific Reports. 2025;16:2552. https://doi.org/10.1038/s41598-025-32521-w
- Turkmenbayev A, et al. The application of machine learning in predicting student performance in university engineering programs: A rapid review. Frontiers in Education. 2025;10:1562586. https://doi.org/10.3389/feduc.2025.1562586
- Albreiki B, Zaki N, Alashwal H. A systematic literature review of student performance prediction using machine learning techniques. Education Sciences. 2021;11(9):552. https://doi.org/10.3390/educsci11090552
- Lai Q. Research on the refinement of college student education management based on artificial intelligence. Discover Artificial Intelligence. 2026;6:31. https://doi.org/10.1007/s44163-025-00651-9
- Yuanyuan L, et al. Research on the application framework of intelligent technologies to promote teachers' classroom teaching behavior evaluation. Frontiers of Education in China. 2023;18(1):12–35. https://doi.org/10.3868/s110-008-023-0012-8
- Shi Y, Sun F, Zuo H, Peng F. Analysis of learning behavior characteristics and prediction of learning effect for improving college students' information literacy based on machine learning. IEEE Access. 2023;11:50447-50461.
- Liu S, Zhang J, Su W. An improved method of identifying learner's behaviors based on deep learning. Journal of Supercomputing. 2022;78(10):12861-12872.
- Yang J. Accurate prediction and analysis of college students' performance from online learning behavior data. IEIE Transactions on Smart Processing and Computing. 2023;12(3):404-411.
- Xie Y, Zhang S, Liu Y. Abnormal behavior recognition in classroom pose estimation of college students based on spatiotemporal representation learning. Traitement du Signal. 2021;38(6):1769-1778.
- Shen X, Yuan C. A college student behavior analysis and management method based on machine learning technology. Wireless Communications and Mobile Computing. 2021;2021:6611630. https://doi.org/10.1155/2021/6611630
- Li G, et al. A convolutional neural network-based approach for the recognition and evaluation of classroom teaching behavior. Scientific Programming. 2021;2021:5513886. https://doi.org/10.1155/2021/5513886
- Feng C, et al. IMRMB-Net: A lightweight student behavior recognition model for complex classroom scenarios. PLoS ONE. 2025;20(2):e0318817. https://doi.org/10.1371/journal.pone.0318817
- Zhang Y, Liu T, Ru B. Effect evaluation and student behavior design method of moral education in colleges and universities under the environment of deep learning. Scientific Programming. 2022;2022:6056117. https://doi.org/10.1155/2022/6056117
- Liu C, Wang H, Yuan Z. A method for predicting the academic performances of college students based on education system data. Mathematics. 2022;10(19):3737. https://doi.org/10.3390/math10193737
- Vora DR, Iyer KR. Deep learning in engineering education: performance prediction using cuckoo-based hybrid classification. In: Machine Learning and Deep Learning in Real-Time Applications. Studies in Computational Intelligence, Vol. 841, pp. 187-218. Springer; Singapore; 2020.
- Li H, Liu Z. An intelligent educational system: analyzing student behavior and academic performance using multi-source data. Electronics. 2024;14(16):3328. https://doi.org/10.3390/electronics14163328
- Zhang Y, Li J. Deep learning-based model for predicting student learning behavior: a pathway to early intervention and enhanced outcomes. Journal of Computational Methods in Sciences and Engineering. 2025;25(2):1169-1184.
- Jia Q, He J. Student behavior recognition in classroom based on deep learning. Applied Sciences. 2024;14(18):7981. https://doi.org/10.3390/app14187981
- Luo H. Prediction of student decision-making behaviour based on machine learning algorithms. Pakistan Journal of Life and Social Sciences. 2024;22(2):11045-11058.
- Abdi A, Sedrakyan G, Veldkamp B. Students' feedback analysis model using deep learning-based method and linguistic knowledge for intelligent educational systems. Soft Computing. 2023;27(38):14073-14094.
- Ning X. Behavior recognition of college students based on improved deep learning algorithm. International Journal of Web-Based Learning and Teaching Technologies. 2023;18(1):1-16.
- Sravya MN, Prashanth D, Saifa S, Reddy LS. A comprehensive analysis of learning behaviour characteristics and predictive modeling of learning outcomes to enhance college-level academic performance. International Journal of Pharmacy and Medical Sciences. 2025;5(2):94-100.
- Kalita E, et al. Predicting student academic performance using Bi-LSTM: a deep learning framework with SHAP-based interpretability and statistical validation. Frontiers in Education. 2025;10:1581247. https://doi.org/10.3389/feduc.2025.1581247
- Alias MAH, Hambali N, Aziz MAA. Feature selection techniques and classification algorithms for student performance classification: a review. International Journal of Electrical and Computer Engineering. 2024;14(3):3230-3242.
- Wang Z, et al. Students' classroom behavior detection system incorporating deformable DETR with Swin Transformer and lightweight feature pyramid network. Systems. 2023;11(7):372. https://doi.org/10.3390/systems11070372
- Zou X. Design of student behavior analysis and management system based on deep learning. International Journal of High Speed Electronics and Systems. 2024;33(1):2450005. https://doi.org/10.1142/S012915642450005X
- Zhang Q. The impact of machine learning-based student behaviour detection on teaching in classroom scenarios. Journal of Information and Knowledge Management. 2025;24(1):2450101. https://doi.org/10.1142/S021964922450101X
- Yu C, Wang Y. College student management system based on K-means clustering algorithm. Int J New Dev Educ. 2022;4(2):28-33.
- Chen J, Lu H. Evaluation method of classroom teaching effect under intelligent teaching mode. Mobile Networks and Applications. 2022;27(3):1262-1270.
- Han X, Chen X. The evaluation model of engineering practice teaching with complex network analytic hierarchy process based on deep learning. Scientific Reports. 2025;15:14733. https://doi.org/10.1038/s41598-025-14733-x
- Guo S, et al. The analysis of teaching quality evaluation for college sports dance by convolutional neural network model and deep learning. Heliyon. 2024;10(8):e36067. https://doi.org/10.1016/j.heliyon.2024.e36067
- Gao Y. Deep learning-based strategies for evaluating and enhancing university teaching quality. Computers and Education: Artificial Intelligence. 2025;8:100362. https://doi.org/10.1016/j.caeai.2025.100362
- Li Y, Lu B. Intelligent educational systems based on adaptive learning algorithms and multimodal behavior modeling. PeerJ Computer Science. 2025;11:e3157. https://doi.org/10.7717/peerj-cs.3157
- Geng F, John AD, Chinnappan CV. Analysis of the teaching quality using novel deep learning-based intelligent classroom teaching framework. Progress in Artificial Intelligence. 2023;12(2):147-162.
- Veluri RK, et al. Learning analytics using deep learning techniques for efficiently managing educational institutes. Materials Today: Proceedings. 2022;51(Part 8):2317-2320.
- Chen W, Min L. The evaluation model of physical education teaching performance based on deep learning algorithm. Scalable Computing: Practice and Experience. 2025;26(3):458-466.
- Zhang Y. A comprehensive evaluation system for physical education teaching effectiveness supported by multimodal machine learning. Discover Artificial Intelligence. 2026;6:75. https://doi.org/10.1007/s44163-026-00075-x
- Pei Y, Lu G. Design of an intelligent educational evaluation system using deep learning. IEEE Access. 2023;11:29790-29799.
- Ding J, Su Y. A teaching management system for physical education in colleges and universities using the theory of multiple intelligences and SVM. Soft Computing. 2024;28(2):685-701.
- Li Y, Zhang L, Tian Y, Qi W. Research on teaching practice of blended higher education based on deep learning route. Computational Intelligence and Neuroscience. 2022;2022:5751843. https://doi.org/10.1155/2022/5751843
- Jiang X, Du Y, Zheng Y. Evaluation of physical education teaching effect using Random Forest model under artificial intelligence. Heliyon. 2024;10(1):e23576. https://doi.org/10.1016/j.heliyon.2024.e23576
- Li S, Liu T. Performance prediction for higher education students using deep learning. Complexity. 2021;2021:6620684. https://doi.org/10.1155/2021/6620684
- Alnasyan B, Basheri M, Alassafi MO, Alnasyan K. Kanformer: An Attention-Enhanced Deep Learning Model for Predicting Student Performance in Virtual Learning Environments. Social Network Analysis and Mining. 2025;15:25. https://doi.org/10.1007/s13278-025-01446-7
- Lu Y, Tong L, Cheng Y. Advanced Knowledge Tracing: Incorporating Process Data and Curricula Information via an Attention-Based Framework for Accuracy and Interpretability. Journal of Educational Data Mining. 2024;16(2):58-84.
Access restricted. Please log in or start a trial to view this content.