This protocol presents an operando electrochemical XPS platform for aqueous electrocatalysis, enabling catalyst characterization during membrane-electrode-assembly water electrolysis and three-electrode measurements. It combines controlled electrolyte delivery, Au-grid electrical contact, near-ambient-pressure XPS, optional gas/QMS analysis, and temperature control to study catalyst transformations under operating conditions.
Method Article
Design and Operation of a Versatile Operando Electrochemical X-ray Photoelectron Spectroscopy Platform for Aqueous Electrocatalysis
In This Article
Summary
Abstract
Understanding electrocatalyst activation and degradation under realistic operating conditions requires operando spectroscopic techniques capable of probing solid-liquid interfaces with running electrochemistry. Here, we present the design and implementation of a versatile operando electrochemical X-ray Photoelectron Spectroscopy (XPS) platform compatible with aqueous environments and controlled current- or potential-driven operation. The modular cell architecture enables both conventional three-electrode half-cell measurements as well as a two-electrode setup for zero-gap proton-exchange membrane or anion-exchange membrane water electrolysis at high current densities. Key design considerations, including electrolyte management, membrane integration into the cell, gas handling, and X-ray access geometry, are discussed in detail. The platform allows investigation of catalyst oxidation, hydroxylation, reduction, and surface restructuring under realistic electrochemical conditions. Representative measurements demonstrate stable operation during high-current water electrolysis as well as flexibility for broader electrocatalytic studies. This protocol provides a practical framework for implementing operando XPS in electrochemical research laboratories and facilitates reproducible investigation of dynamic catalyst transformations at electrified interfaces.
Introduction
Understanding electrocatalytic processes at the solid–liquid interface is essential for the development of efficient energy conversion technologies, including water electrolysis and fuel cells. However, the active state of electrocatalysts is often dynamic and strongly dependent on the applied potential, electrolyte environment, and operating conditions. As a result, ex situ. characterization frequently fails to capture the true chemical and electronic structure of catalysts under working conditions1.
To address this challenge, in situ. and operando spectroscopic techniques have been increasingly employed to probe catalysts during electrochemical operation. Among these, X-ray photoelectron spectroscopy (XPS) provides unique access to the electronic structure, oxidation state, and chemical environment of surface species. Recent advances in near-ambient pressure XPS (NAP-XPS) have enabled measurements in the presence of gases and thin liquid layers, partially bridging the pressure gap between ultra-high vacuum and realistic environments. Nevertheless, investigating electrochemical systems remains particularly challenging due to the presence of liquid electrolytes, potential gradients, and the need for stable electrochemical control in the vacuum chamber2.
Several approaches have been developed to enable electrochemical XPS measurements, including dip-and-pull configurations, liquid jets, graphene-capped cells, and membrane-based designs. While these methods have significantly advanced the field, they often suffer from limitations such as restricted current densities, limited stability, complex operation, or incompatibility with realistic device architectures. In particular, achieving stable operation at relevant current densities (hundreds of mA cm-2)3, while maintaining XPS accessibility, remains a key challenge4.
Operando XPS measurements of electrochemical systems, including proton exchange membrane (PEM)-based configurations, have been demonstrated previously5,6. However, these approaches are often limited in flexibility with respect to cell design, operating conditions, and integration of complementary analytical techniques.
Here, we present a versatile operando electrochemical XPS platform designed to overcome these limitations, capable of operating at the current densities of several hundreds of mA cm-2, while staying at the pressures of 1–10 mbar of water vapor7. The system combines membrane-based electrolyte management with a modular cell architecture, enabling both conventional three-electrode measurements8,9 and zero-gap membrane electrode assembly (MEA) configurations7. The setup allows operation under controlled potential or current and is compatible with laboratory-based near-ambient-pressure XPS.
Compared with previously reported PEM-based electrochemical NAP-XPS cells6,10,11,12, the present platform was designed to improve the mechanical robustness of the cell pieces, water management, and electrical contact during high-current operation. The horizontal cell geometry and a mechanically rigid body facilitate stable sealing. Continuous high-flow water delivery to the counter-electrode side maintains membrane hydration while avoiding direct exposure of bulk liquid to the XPS-probed catalyst surface. In addition, the porous Au mesh current collector provides electrical contact over the catalyst layer while preserving XPS access to the active surface. Together with operation at stable water-vapor pressures of 1–10 mbar and compatibility with QMS, gas dosing, and temperature control, these features extend earlier PEM-based operando XPS concepts toward a more reproducible and flexible laboratory protocol.
Importantly, the platform integrates additional functionalities, including gas-phase control, temperature regulation, and simultaneous product detection via. quadrupole mass spectrometry (QMS), enabling direct correlation between electrochemical activity, gas evolution, and catalyst surface chemistry.
A practical limitation of this membrane-based geometry is that the electrochemically active surface probed by XPS must remain accessible to reactants and ionic transport from the membrane or electrolyte side. Therefore, the method is best suited for thin, porous, nanostructured, or membrane-supported catalyst layers. Dense, extended model electrodes such as single crystals are not directly compatible with this configuration without substantial cell redesign, because the surface exposed to the XPS analyzer would not be efficiently wetted or ionically connected during operation.
Overall, this protocol provides a practical framework for investigating dynamic catalyst transformations under realistic electrochemical conditions and extends previously reported operando approaches toward a more flexible, comprehensive methodology.
Protocol
The reagents and the equipment used are listed in the Table of Materials.
1. Preparation of Membrane Electrode Assembly (MEA) for anode investigation
- Cut the proton-exchange membrane (PEM) to 1.5 cm × 1.5 cm for the cell geometry used in this study. Using a mechanical punch, create four holes of approximately 3 mm diameter at the membrane corners according to the screw pattern of the cell body. These holes accommodate polyether ether ketone (PEEK) screws (M3) that mechanically fix and seal the titanium top plate to the cell body.
- Prepare the precut proton-exchange membrane (PEM) according to a membrane-specific published or supplier-recommended cleaning/protonation procedure. If no additional chemical pre-treatment is required, rinse the membrane thoroughly with deionized water and keep it fully hydrated until assembly.
NOTE: For perfluorosulfonic-acid proton-exchange membranes, commonly used pre-treatment protocols include sequential cleaning, acid protonation, and rinsing with deionized water. The exact temperature, duration, and chemical sequence should be selected according to the membrane type and the requirements of the experiment13. - Deposit the catalyst layer directly onto the membrane (e.g., by magnetron sputtering or drop casting) to obtain a thin-film anode (typically in the range of 20–100 nm).
NOTE: Thin-film catalysts enable direct probing of the catalyst surface by XPS without additional binders or ionomers. A thicker layer would require additional ionomer, which is also feasible. - Place a gas diffusion layer (GDL) on the cathode side using tweezers to ensure mechanical stability and electrical conductivity.
NOTE: A Pt-coated Ti GDL is recommended for corrosion resistance under anodic conditions if the electrochemical requirements of the measurement allow it; alternatively, use a carbon-based one. Depending on the thickness of the components, it might be necessary to stack several pieces of the GDL sublayer in order to achieve good electrical contact. - Prepare the cathode side using a commercial gas diffusion electrode (GDE) or catalyst-coated substrate.
NOTE: The setup can be reversed if the electrode of interest is the cathode of the PEM-WE. In that case, there should be an oxygen-evolution catalyst (e.g., Ir or IrOx) instead of Pt on the side facing the water inlet and the cell body.
2. Assembly of the operando XPS cell for anode investigation
- Prepare the cell housing and sealing components. Clean all components with isopropanol or ethanol and dry thoroughly. Inspect sealing surfaces to avoid leaks.
NOTE: Even minor contamination or particles can prevent proper sealing under near-ambient pressure conditions. Be aware of residual C particles from the carbon GDE, which often remain attached to the sealing surface. - Insert the catalyst-coated membrane (CCM) into the cell. Place the cathode side of the CCM facing the water inlet and the cell body. Ensure proper alignment of the active area with the XPS probing region.
NOTE: Misalignment may result in measuring inactive regions or support materials instead of the catalyst. The setup can be reversed if the electrode of interest is the cathode. In that case, the anodic, oxygen-evolving part of the CCM should be facing the water inlet and the cell body, while the hydrogen-evolving cathode should face the chamber and the XPS analyzer. The active area can be tuned by cutting the membrane with the catalyst to a smaller size (e.g., 3 mm in diameter) and placing it on a blank PEM, which serves as a seal. This approach increases ohmic resistance, but it also provides better control over the active area, as well as lowers the consumption of the investigated CCM. - Establish electrical connections. Connect the cathode as the counter electrode (CE) to the cell mains. Connect the anode as the working electrode (WE) to the cell mains. Ground the WE to minimize spectral shifts during XPS acquisition.
NOTE: Improper grounding may lead to artificial shifts in binding energy due to charging or potential gradients. The typical sign of an improper grounding is a linear shift in the measured binding energy with applied potential. - Position the Au grid current collector. Place a gold transmission electron microscopy (TEM) grid on the hole in the Ti piece, so that after the assembly, it is in direct contact with the catalyst layer. If the Au mesh does not stick to the Ti, it can be wetted by water to improve adhesion between the Au and Ti.
NOTE: Alternatively, the mesh can be placed directly onto the CCM. In this case, be aware not to damage the catalyst layer. The Au grid provides electrical contact while allowing X-ray access to the catalyst through its structure. The grid geometry (mesh size) should be chosen to balance electrical contact and exposed measurement area. Samples with lower lateral conductivity will require a denser mesh. Any other material can also be used for the grid, based on the specific experiment's requirements, to prevent electrochemical contamination and peak overlap in XPS. The mesh density should be optimized experimentally. An overly dense mesh reduces the exposed catalyst area, potentially leading to an insufficient catalyst signal or a dominant Au-related signal. An overly open mesh may provide insufficient lateral electrical contact, especially for poorly conductive catalyst layers. This can be recognized by linear binding-energy shifts with the applied potential, or, more commonly, by broadening or splitting of the measured catalyst peaks with the applied potential, rather than primarily by changes in peak intensity or chemical-state distribution. In this case, use a denser mesh, improve mechanical contact, or reduce the distance between the grid wires and the analyzed region. The typical grid sizes range from 300–1500 bars/inch, which is the standard used for their description. - Seal the cell. Assemble the top part of the cell, ensuring vacuum compatibility. Place the Ti part with the Au mesh on the top of the CCM. Be careful not to misalign the CCM with the GDE and GDL underneath it.
NOTE: Tighten the M3 PEEK screws in a cross pattern to ensure uniform compression and sealing. Non-uniform compression can lead to membrane damage or leakage. Non-conductive screws have to be used, e.g., from PEEK, to prevent short-circuiting. The PEEK screws should be replaced when they show signs of mechanical damage.
3. Water supply and electrolyte management
- Mount the assembled cell onto the sample holder using four M4 PEEK screws to ensure insulation between the cell cathode and the XPS apparatus
- Connect the water reservoir using quickdraws (e.g., deionized water).
- Connect the cell's main electric cable to the potentiostat through the vacuum feedthrough.
- Connect tubing between the reservoir, pump, and cathode compartment.
- Start the peristaltic pump to circulate water through the cathode side. Initially, use a high flow (100 mL min-1) of the pump to ensure initial hydration of the membrane.
NOTE: Water is transported to the anode through the membrane via. diffusion (in some configurations also by electro-osmotic drag). This design avoids direct liquid exposure at the anode surface facing the vacuum. - Verify the system integrity. Check for water leaks. Check the electrochemical response, and verify that there is no short circuit
NOTE: A typical sign of a short circuit is a very low voltage measured by the potentiostat, typically in the order of µV.
4. Transferring into the NAP-XPS System
- Slowly pump the vacuum chamber to the target pressures (1–10 mbar). Avoid fast changes to prevent membrane drying or freezing. This can be done sequentially, going through the pressures of 50 mbar, 40 mbar, 30 mbar, 20 mbar, and 10 mbar. Upon reaching the target pressure, reduce the pump flow to 15–30 mL min-1 to prevent excessive flooding of the catalyst layer.
- Align the X-ray beam with the exposed catalyst area (through the Au grid).
NOTE: The analyzed spot size should match the open area of the Au grid to avoid signal contamination if the grid size allows it. The Au signal can serve as a reference to verify the cell’s grounding. - Set the final working pressure (typically 1–10 mbar).
NOTE: The pressure must be optimized as a trade-off between XPS signal quality and water evaporation suppression. If it is not possible to reach the desired water vapor pressure, additional water can be introduced to the system via. a dedicated valve in the NAP-XPS vacuum chamber.
5. Operando electrochemical measurement
- Connect the potentiostat in a two- or three-electrode configuration.
- Record initial spectra (e.g., Ir 4f, Au 4f, C 1s, O 1s, F 1s, and VB)at open circuit voltage (OCV).
- Apply controlled potentials or currents. Perform chronoamperometry or chronopotentiometry with the selected electrochemical parameters (e.g., chronoamperometry ramp from 1 V to 2 V with steps of 0.2 V).
NOTE: It is also beneficial to measure electrochemical impedance spectroscopy (EIS), at least at OCV potential (amplitude 5 mV, 10 points per decade, frequency range 1 MHz to 500 mHz) in order to track the evolution of the ohmic resistance. Continuously increasing ohmic resistance can be a sign of insufficient hydration of the PEM.- Record XPS spectra (e.g., Ir 4f, Au 4f, C1s, O 1s, F 1s and VB) during operation.
NOTE: Stabilization time (e.g., several minutes) is recommended before acquiring spectra at each condition if the aim is to measure the steady state. Stabilization can be confirmed by the behavior of the electrochemical response: when it becomes constant or linear, the system can be considered stabilized. The main aim is to avoid the measurements during the initial electrochemical double-layer charging period, which occurs after a change of potential or current density. In the current experimental setup, XPS measurements were performed using a monochromatized Al Kα (1484.71 eV) X-ray source and a hemispherical photoelectron analyzer. Spectra were acquired with a pass energy of 20 eV, a dwell time of 0.3 s, and an energy step size of 0.1 eV. The analyzed spot size was 300 µm in diameter.
- Record XPS spectra (e.g., Ir 4f, Au 4f, C1s, O 1s, F 1s and VB) during operation.
- Perform high-current electrolysis measurements. Increase cell voltage to reach relevant current densities (hundreds of mA cm-2).
NOTE: Mass transport limitations may occur at high current densities due to limited water supply through the membrane. A typical sign is a rapid, continuous deterioration in the measured performance. Additionally, it can be observed by measuring and deconvoluting EIS at high voltages: the typical sign is continuously increasing ohmic resistance. Verify stable electrolyte management before acquiring operando spectra. Stable operation is indicated by a constant chamber pressure at the selected water-vapor setpoint, a stable water-related QMS signal, and a stable O 1s water vapor spectral contribution. Pressure fluctuations, rapid current decay, strong XPS signal attenuation, or loss of O 1s water vapor contribution indicate unstable water management, such as membrane drying, flooding, or loss of electrolyte contact, as seen from the spectral perspective. - Optional: perform reduction or cycling steps. Apply low or negative potentials (e.g., 0 V or -1 V)to probe the reversibility of catalyst oxidation and separate reversible and irreversible behavior. If there is hysteresis in the evolution of the XPS spectra with the applied voltage, the system demonstrates irreversible behavior, whereas if there is none, it is perfectly reversible.
6. Shutdown procedure
- Return to OCV.
- Use the water pump to remove the water from the water circuit and the cell. This can be done by inserting the water circuit inlet into an empty vessel; consequently, the peristatic pump will suck air and push out the remaining water.
- Stop the water pump.
- Vent the vacuum chamber to atmospheric pressure. Remove the cell from the chamber by unscrewing the PEEK screws and disconnecting the electrical and water-circuit quickdraws. If there is remaining water in the water circuit, it can be flushed out by compressed air or N2 from a pressure cylinder.
- Disassemble the cell and inspect components for degradation.
NOTE: Post-experiment inspection may reveal membrane drying, catalyst delamination, or corrosion effects. Another possible step is to perform additional XPS analysis after the removal of the water and prior to venting the cell and measure the state of the catalyst in the absence of reactants. This approach can provide valuable information about the catalyst's state after electrochemistry, without water or exposure to the atmosphere.
7. Optional system configurations and extensions
- Gas environment control
- Introduce reactive gases (e.g., H2, O2, or inert gases) directly into the analysis chamber using the NAP-XPS gas handling system.
NOTE: The gas environment can be adjusted to simulate realistic operating conditions for various electrochemical systems, including fuel cell operation. Care must be taken to maintain stable pressure conditions and avoid excessive attenuation of photoelectrons. High flows of dry gases (>50 mL min-1) can cause excessive membrane drying. Therefore, the ohmic resistance should be monitored using EIS during gas introduction to detect it and reduce the flow accordingly.
- Introduce reactive gases (e.g., H2, O2, or inert gases) directly into the analysis chamber using the NAP-XPS gas handling system.
- Coupling with quadrupole mass spectrometry (QMS)
- Connect the outlet of the analysis chamber to a QMS. Monitor gaseous reaction products during electrochemical operation, optimally select several m/z (mass to charge) ratio values of interest, typically water (m/z = 18), oxygen (m/z = 32), and hydrogen (m/z = 2) for PEM-WE.
NOTE: QMS detection is particularly effective at high current densities, where product formation rates are sufficient for reliable detection. Synchronization of electrochemical data with QMS signals enables correlation between surface states and product evolution.
- Connect the outlet of the analysis chamber to a QMS. Monitor gaseous reaction products during electrochemical operation, optimally select several m/z (mass to charge) ratio values of interest, typically water (m/z = 18), oxygen (m/z = 32), and hydrogen (m/z = 2) for PEM-WE.
- Temperature control
- Activate the integrated heating element in the cell body. Set the desired temperature (typically up to 30–80 °C).
NOTE: Elevated-temperature operation enables more realistic simulation of industrial electrochemical conditions. Temperature stabilization is required before acquiring XPS spectra to avoid drift and instability. This is directly evident from the thermocouple readings, which show a value (e.g., 50 °C) that does not change over time. Excessive heating may increase water evaporation and affect the stability of the water layer on the catalyst. This can be used to advantage if the catalyst is flooded with water, but it can also dry it out. The drying can be monitored using EIS by tracking the evolution of ohmic resistance with time.
- Activate the integrated heating element in the cell body. Set the desired temperature (typically up to 30–80 °C).
- Half-cell setup
NOTE: The cell can be used in a three-electrode half-cell setup, in which a dedicated reference electrode (RE) is needed.- Use Pt wire as a CE and H2/H+ RE or Ag/AgCl RE with low volume, which fits into the cell’s body. This setup has an inevitable gap between the PEM and the RE and CE. Consequently, an electrolyte is needed for the measurements (e.g., 0.1 M H2SO4 or 0.1 M HClO4).
NOTE: Due to the large distance between the WE, RE, and CE, this variant of the cell is associated with larger ohmic resistance (tens of ohms); therefore, lower current densities are typically achieved compared to the zero-gap setup.
- Use Pt wire as a CE and H2/H+ RE or Ag/AgCl RE with low volume, which fits into the cell’s body. This setup has an inevitable gap between the PEM and the RE and CE. Consequently, an electrolyte is needed for the measurements (e.g., 0.1 M H2SO4 or 0.1 M HClO4).
Results
Representative measurements demonstrate the stable operation of the operando XPS platform under near-ambient-pressure conditions during aqueous electrochemical reactions on a 50 nm-thick layer of metallic Ir, prepared by magnetron sputtering7. Firstly, the cell design is presented: The conceptual cell operation is shown in Figure 1. The details of the inner cell working principle are in Figure 2 for PEM-WE and in Figure 3 for the three-electrode, half-cell variant. Figure 4 shows the exploded view of the cell parts and a detailed drawing of each part with dimensions in mm. Figure 5 depicts the photo of a real implementation of the operando cell and its incorporation into the NAP-XPS machine.
In proton-exchange membrane (PEM) water electrolysis, the anode and cathode are separated by a solid PEM electrolyte, and the supplied water is electrochemically dissociated to hydrogen and oxygen. The use of a thin, solid electrolyte enables low ohmic resistance, which is crucial for electrical efficiency. The oxygen evolution reaction (OER) occurs at the anode, positive electrode. OER requires an overpotential >1.48 V to be thermodynamically sustainable. On the negative electrode (cathode), a hydrogen evolution reaction (HER) takes place. Because the HER is orders of magnitude faster than the OER, the cathode contributes less to the overall cell voltage14.
In a commercial electrolyzer, water is supplied to the anode side. However, in this example, where the anode is the catalyst layer under investigation, water must be supplied from the cathode side via. diffusion through the membrane to prevent the photoelectrons from being attenuated in water. While this imposes certain mass-transport limits on the system's maximum current density, we reach 300 mA.cm-2 at 2.5 V7.
Such cell voltages during electrolysis are highly oxidizing for the anode catalyst layer and its immediate interface. Thus, it is expected that the catalyst and any metal in contact with it will undergo surface oxidation. The extent and nature of the oxidation depend on the specific structure of the material and environment. For example, gold that is used as a current collector is expected to develop a <1 nm thick Au2O3 layer below 2 V, while above 2 V, a thick 60 nm Au(OH)3 layer grows15. While this should result in a visible shift in XPS Au position16, we do not observe any change in peak position as the oxide forms strictly on the interface with the catalyst, and the thickness of the gold mesh attenuates the signal. While gold oxide layers are still good conductors, Ti oxides are not, and using a titanium mesh as a current collector will increase contact resistance. Iridium metal catalyst in contact with the current collector also forms oxides at high anodic potentials17. Ir 4f XPS spectra recorded during electrochemical operation (Figure 6) reveal a clear evolution of the catalyst surface states. In the initial OCV state (1), the iridium-based catalyst is dominated by metallic Ir0 (orange doublet at 60.8 eV), with a minor contribution from oxidized IrIV species in IrO2 (green component at 61.8 eV). Application of anodic potentials induces the formation of additional, higher-binding-energy components associated with reactive intermediate states. After a 30-min hold at 1.7 V (2), the IrIV contribution increases markedly, while two new components appear at 62.5 eV (red) and 63.2 eV (purple). These components were assigned to IrIII and IrVI, respectively, and are associated with operando OER intermediates such as hydrous Ir(OHy)x7. Increasing the potential to 2.0 V (3) results in a substantial decrease of the Ir0 and IrIV contributions, complete disappearance of the IrIII component, and dominance of the IrVI species. During the subsequent OCV period (4), the spectrum becomes dominated by the IrIV component attributed to stable IrO2, while the intensity of the reactive IrVI species associated with Ir(OHy)x strongly decreases. The low intensity of the metallic Ir0 component indicates conversion of the surface into a stable oxidized phase. As expected, a subsequent 30 min hold at 2.5 V (5) again leads to dominance of the IrVI component. However, unlike the 2.0 V step, the metallic Ir0 contribution becomes significantly more pronounced. The most plausible explanation is a temporary increase in metallic Ir-Ir interactions resulting from lattice oxygen participation in the OER process18. Following 90-min hold at OCV (6), the system relaxes to a stabilized ex situ. state commonly reported in previous studies, characterized by a dominant IrIV contribution. Figure 7 shows an Ir 4f spectrum of a nominally identical Ir catalyst layer measured in the PEM-WE configuration at 2.0 V without the Au grid current collector. The distorted peak shape illustrates the effect of insufficient electrical contact/current collection within the Ir layer and highlights the importance of using the Au grid to ensure reliable operando XPS measurements. The observed spectral changes correlate well with the onset of electrochemical activity and the increase in current density observed in Figure 8.
When coupled with QMS, the platform enables detection of gaseous reaction products during high-current operation, enabling direct correlation between surface chemical-state evolution and oxygen (m/z = 32) formation during oxygen evolution reaction (Figure 9). The combination of spectroscopic and electrochemical data provides a comprehensive picture of catalyst behavior under realistic operating conditions. These results demonstrate the successful integration of electrochemical control, XPS analysis, and QMS detection within a single operando platform.
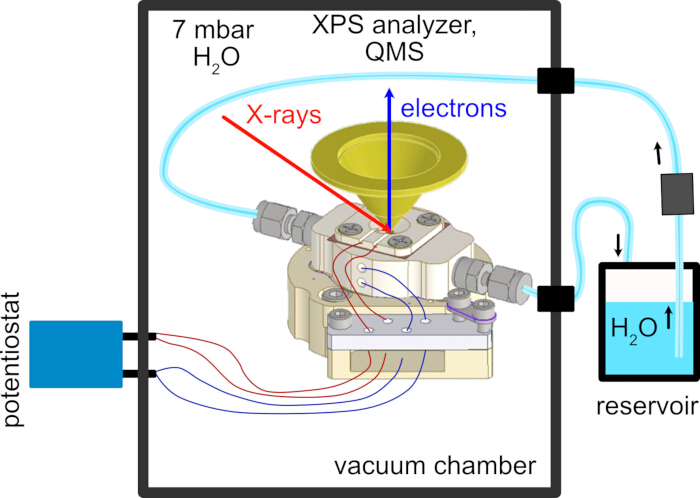
Figure 1: Schematic of the operando XPS setup for electrochemical measurements under near-ambient pressure conditions. The electrochemical cell is operated inside a vacuum chamber at controlled water vapor pressure (1–10 mbar), while X-rays irradiate the catalyst surface, and emitted photoelectrons are detected by the NAP-XPS analyzer. Simultaneously, gaseous reaction products are monitored by a QMS. Electrical connections enable potentiostatic control of the working electrode during operando measurements. Please click here to view a larger version of this figure.
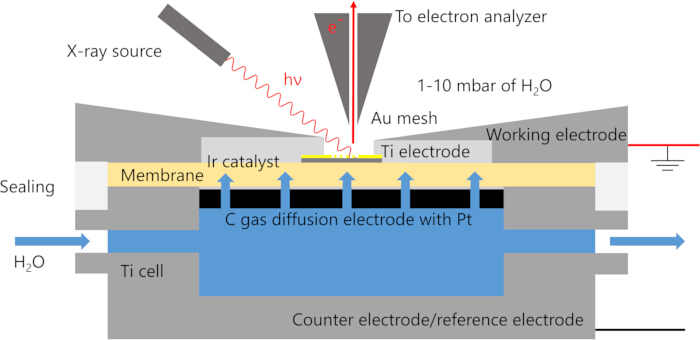
Figure 2: PEM-based operando electrochemical XPS cell configuration. Design of the operando electrochemical cells used in this study, a PEM-based configuration consisting of an Ir catalyst deposited on a PEM membrane and with a platinized Gas Diffusion Electrode (GDE), serving as a counter electrode. Please click here to view a larger version of this figure.
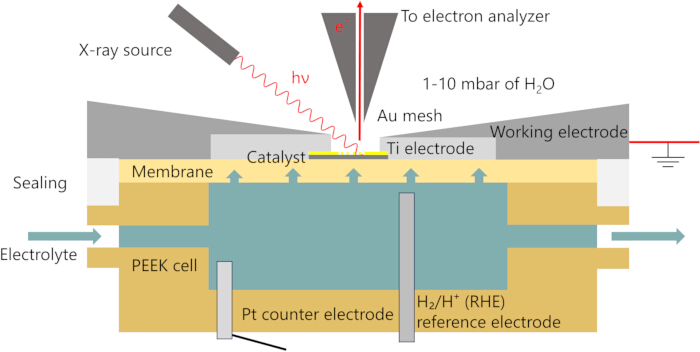
Figure 3: Three-electrode operando electrochemical XPS cell configuration. Design of the operando electrochemical cells, Three-electrode half-cell variant, employing a PEEK cell body, Pt CE, and H2/H+ (RHE) RE. Please click here to view a larger version of this figure.
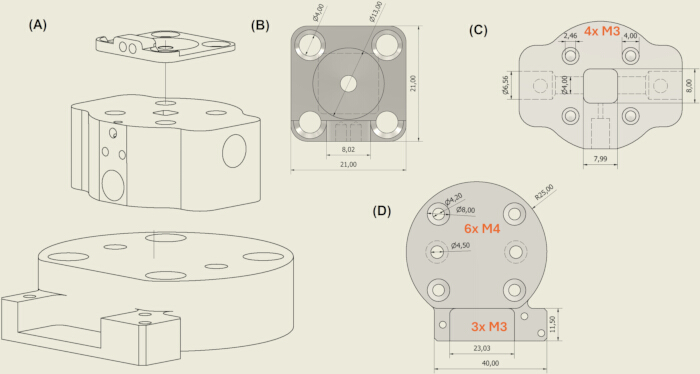
Figure 4: Design and construction details of the PEM-based operando electrochemical XPS cell. (A) An exploded-view schematic showing the top plate, main cell body, and the cell mount used for the cell attachment to the NAP-XPS. (B) Technical drawing of the titanium top plate with the central opening for X-ray and photoelectron access. (C) Technical drawing of the titanium cell body with electrolyte/gas connection channels, entry for heating cartridge and a thermocouple, and four M3 screw positions used for sealing. (D) Technical drawing of the cell mount to the NAP-XPS sample holder with M4 mounting holes and M3 connection points. The drawings provide the key dimensions needed to reproduce the custom cell components and clarify the mechanical arrangement that ensures sealing, electrical isolation, and spectroscopic access. Please click here to view a larger version of this figure.
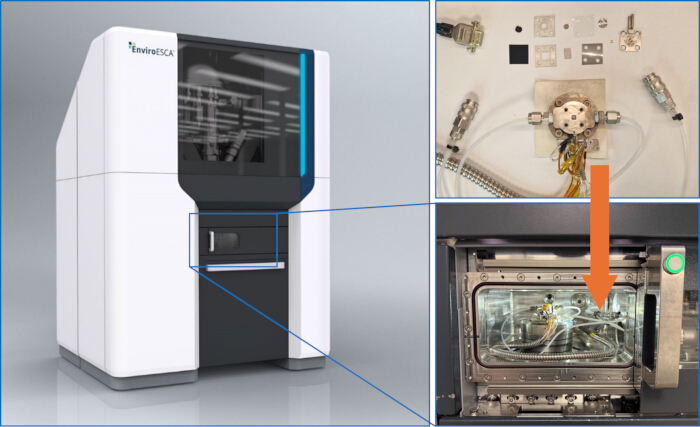
Figure 5: Practical integration of the operando electrochemical cell into the near-ambient-pressure XPS system. The left panel shows the instrument and the chamber region where the cell is installed. The upper-right panel shows the assembled cell and representative components before insertion, including sealing elements, membrane/electrode parts, tubing, and electrical connections. The lower-right panel shows the cell mounted inside the analysis chamber, with the orange arrow indicating the cell position. This layout demonstrates the spatial arrangement used to combine electrolyte delivery, electrical control, gas handling, and spectroscopic access to the catalyst surface. Please click here to view a larger version of this figure.
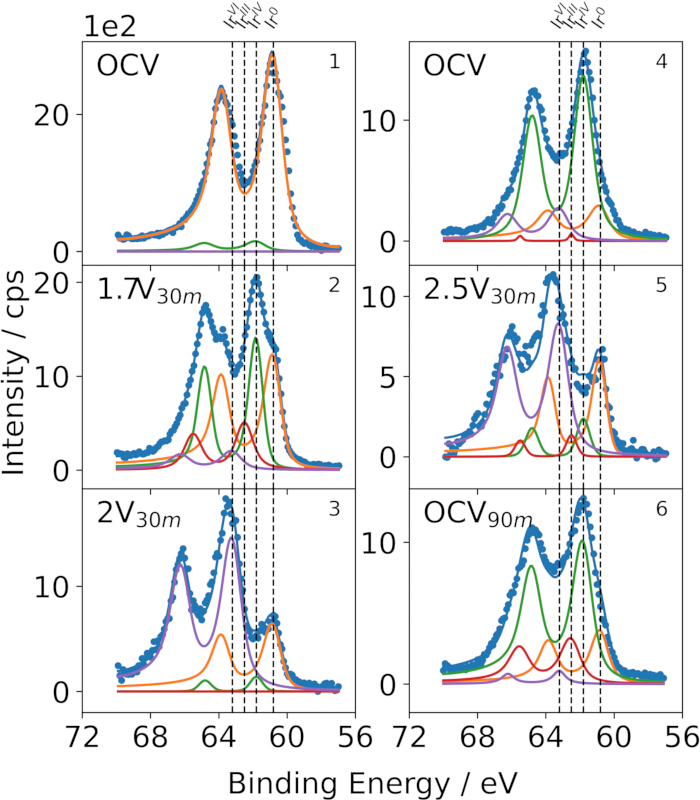
Figure 6: Operando Ir 4f XPS spectra under electrochemical polarization. Operando XPS spectra of the Ir 4f region acquired under different electrochemical conditions. Experimental data (points) are shown together with fitted components corresponding to different Ir oxidation states. The evolution of spectral features with applied potential reveals changes in the catalyst's oxidation-state distribution under operando conditions. Please click here to view a larger version of this figure.
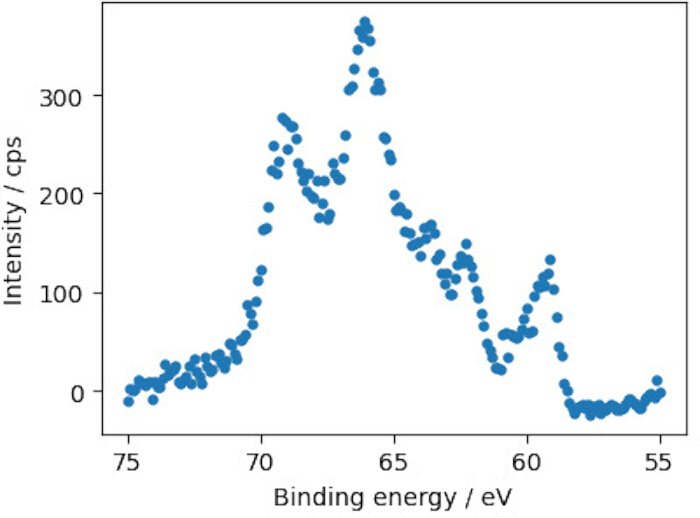
Figure 7: Example of spectral distortion caused by insufficient electrical contact or grounding. Ir 4f spectra obtained at 2 V from a sample of sputtered Ir (50 nm) without any Au mesh enhancing the electrical contact. Please click here to view a larger version of this figure.
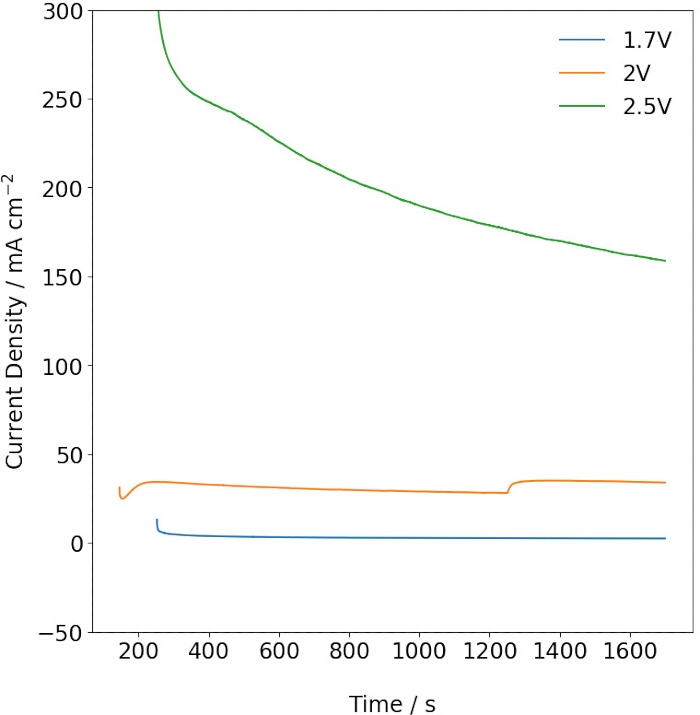
Figure 8: Current-density response during potentiostatic operando XPS measurements. Current density as a function of time during potentiostatic operation at different applied potentials (1.7 V, 2.0 V, and 2.5 V). The measurements demonstrate the electrochemical performance of the operando cell. The indicated conditions correspond to those used for operando XPS measurements. Please click here to view a larger version of this figure.
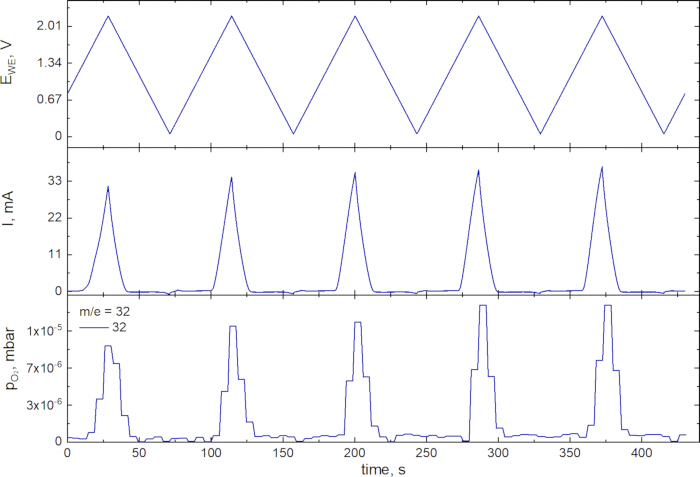
Figure 9: Simultaneous electrochemical and mass spectrometric characterization during cyclic voltammetry. The current response is shown alongside the corresponding QMS signal for oxygen (m/z = 32). The correlation between current density and O2 signal confirms that the measured electrochemical activity is associated with oxygen evolution. Please click here to view a larger version of this figure.
Discussion
The operando XPS platform presented here enables direct investigation of electrocatalyst surfaces under realistic aqueous electrochemical conditions, thereby addressing the long-standing challenge of bridging the pressure and environmental gaps between conventional XPS and working electrochemical systems2.
A key advantage of the design is the membrane-based electrolyte delivery, which allows a continuous supply of liquid water to the catalyst while maintaining near-ambient pressure conditions compatible with XPS. This approach avoids direct exposure of bulk liquid to vacuum and ensures stable operation during high-current electrolysis. The use of a porous Au grid as a current collector provides a simple, effective solution for both electrical contact and X-ray accessibility.
The successful operation of the method is mainly determined by three critical steps: (1) maintaining membrane hydration during pump-down and operation, (2) obtaining stable electrical contact between the catalyst layer and the current collector, and (3) preventing catalyst flooding to have a sufficient XPS signal for spectral acquisition. In practice, unstable chamber pressure, rapid current decay, or increasing ohmic resistance (measured by EIS) indicate insufficient water management or membrane drying, whereas significant distortions of the measured XPS spectrum shape with applied potential indicate insufficient electrical contact. These issues can often be mitigated by adjusting the water flow to reduce flooding, slowing the pump-down procedure to prevent drying, improving mechanical contact to the Au grid by using more supporting GDL for the cell assembly, or using a denser Au mesh for poorly conductive catalyst layers (for example, 1500 bars per inch, instead of 300 bars per inch).
The modular architecture enables flexible operation across multiple configurations, including MEAs for high-current water electrolysis and conventional three-electrode setups for fundamental studies. Beyond anodic water electrolysis, related membrane-based operando XPS configurations have been applied to other electrochemical systems, including Pt and Pt3Co degradation under oxygen-reduction-reaction (ORR) conditions in proton-exchange-membrane fuel cells9, as well as hydrogen-evolution studies on Pt3Te4 nanosheets8. These examples illustrate that the general approach can be adapted to different electrocatalytic reactions by changing the reactant-delivery pathway and electrode configuration. Reactants can be supplied through the membrane/electrolyte side, introduced as gases into the near-ambient-pressure chamber, or delivered through a gas-diffusion electrode, depending on the reaction studied. Gas-phase products, such as O2 or H2, can be monitored by QMS when their formation rate is sufficient, while non-volatile products or dissolved species require complementary analysis of the electrolyte outside the XPS chamber. Therefore, the achievable current density, reactant delivery, and product-detection strategy depend strongly on the specific cell configuration. The cell design is compatible with additional extensions, including gas-phase control, which is inherent to most NAP-XPS machines, temperature regulation up to 80 °C, and coupling with QMS. In the present representative experiment, QMS coupling was demonstrated by monitoring oxygen evolution during electrochemical operation of PEM-WE, whereas gas-atmosphere and temperature-controlled operation should be selected and validated in the specific use cases. Previously reported PEM-based electrochemical NAP-XPS cells have demonstrated the feasibility of studying OER catalysts using batch-type and continuous-flow configurations, including three-electrode PEM-based designs19. The present implementation builds on these concepts but emphasizes mechanical robustness, horizontal cell mounting, reproducible water sealing, continuous water delivery from the counter-electrode side, and Au-grid current collection that preserves XPS access to the catalyst surface and is stable even under high applied potentials (>2 V), in contrast to commonly used graphene2,20. Compared with liquid-jet, dip-and-pull, or closed liquid-cell approaches, the membrane-based geometry avoids direct exposure of bulk liquid to the analyzer side and is therefore compatible with stable near-ambient-pressure operation, allowing for longer measurements; however, it requires catalyst layers that remain ionically connected to the membrane/electrolyte side while being accessible to XPS from the gas/vacuum side21.
Several limitations should be considered. Mass transport through the membrane may become limited at high current densities, potentially affecting local reaction conditions and leading to catalyst drying, as can be seen in the fast drop in the current density in Figure 8 at 2.5 V. The requirement to balance pressure to achieve sufficient XPS signal quality while suppressing electrolyte evaporation introduces an additional experimental constraint, which limits the speed at which the electrochemical steps can be performed. Moreover, the performance is limited by the lateral conductivity of the catalyst layers, as there is always a gap between the Au grid contact and the active sites; however, this can also be considered an advantage, as it allows modeling the real transport issues in PEM-WE, where the electrode also cannot fully cover the catalyst to facilitate transport of oxygen and water22.
Despite these limitations, the mechanically rigid cell design provides a practical framework for operando studies of electrocatalysts and related electrochemical interfaces. Its applicability is supported by several published case studies using related membrane-based operando XPS configurations, including PEM water electrolysis7, ORR-related Pt/Pt3Co degradation in PEM fuel-cell conditions9, and HER studies on Pt3Te4 nanosheets8. The ability to directly correlate electrochemical performance, surface chemical state, and product formation offers valuable insight into catalyst activation, degradation, and reaction mechanisms. This approach is expected to facilitate the development of advanced electrocatalysts for energy conversion technologies, including water electrolysis and fuel cells.
Disclosures
The authors have nothing to disclose.
Acknowledgements
This work was supported by the project "The Energy Conversion and Storage", funded as project No. CZ.02.01.01/00/22_008/0004617 by Programme Johannes Amos Commenius, call Excellent Research.
Materials
| Name | Company | Catalog Number | Comments |
|---|---|---|---|
| Deionized water | Milli-Q IQ 7000 Ultrapure Water Purification System | https://www.sigmaaldrich.com/US/en/product/mm/ziq7000t0c | Electrolyte (resistivity ≥18 MΩ·cm recommended) |
| Gas diffusion electrode | 0.5 mg/cm² 60% Platinum on Vulcan - Carbon Paper Electrode | https://www.fuelcellstore.com/fuel-cell-components/gas-diffusion-electrode/platinum- electrodes/05-ptc-paper-electrode?path=25_30_100?ovs=51&path=25_30_100 | Serves as the counter electrode (CE) for the single cell, zero-gap setup |
| Gas diffusion layer (carbon) | Toray Carbon Paper 090 with Micro Porous Layer | https://www.fuelcellstore.com/gas-diffusion-layers/carbon-paper/toray-carbon-paper/toray- paper-090-micro-porous-layer | Cathode support and current collector |
| Gas diffusion layer (Pt-coated Ti) | Mott | 1191994-Gr2-100 (Mott 1100 Series for PEM electrolysis, Material: Mott Grade 2 Titanium, Porosity: 28-47% | Cathode support and current collector |
| Gold TEM grid | Agar Scientific, Square Pattern 300 Mesh TEM Support Grids, 10.5 um hole size | https://www.agarscientific.com/tem/grids-agar/square-mesh/square-300-mesh-tem- support-grids | Transparent current collector enabling X-ray access |
| H2SO4 | Roth, ROTIPURAN 95%-98 % | H314-H290 | |
| Heating element / temperature controller | Custom made | — | Enables operation up to 60–80 °C |
| Iridium catalyst (thin film or powder) | K. J. Lesker, 99.9% 2inch diameter, 3 mm thick | https://www.lesker.com/newweb/deposition_materials/depositionmaterials_sputtertargets _1.cfm?pgid=ir1 | Deposited via sputtering or drop-casting |
| Nafion membrane (e.g., Nafion 117) | Sigma-Aldrich / Chemours | https://ion-power.com/membranes/ | Proton-exchange membrane for MEA preparation |
| Near-ambient pressure XPS system | SPECS | https://www.specs-group.com/ | XPS measurements under near-ambient pressure |
| PEEK cell components | Custom made, CETIMA cz | — | Chemically resistant housing for half-cell configuration |
| PEEK screws M3 | PEEK countersunk screws | https://www.plastovesoucastky.cz/en/c/peek/peek-countersunk-screws-181 | Screws used to seal the WE to the cell body |
| PEEK screws M4 | PEEK socket head screws | https://www.plastovesoucastky.cz/en/c/peek/peek-socket-head-screws-183 | Screws used to attach the cell to the NAP-XPS machine |
| Peristaltic pump | Masterflex L/S Digital Precision Pump Systems with Open-Head Sensor and Easy-Load Head | https://www.fishersci.com/shop/products/masterflex-l-s-digital-precision-pump-systems- open-head-sensor-easy-load-head-4/11747347#?keyword= | Used for water circulation |
| Platinum wire (counter electrode) | Safina a.s. | https://www.safina.eu/product/platinum-wires/ | Used in half-cell configuration |
| Potentiostat | BioLogic SP150e | https://www.biologic.net/products/sp-150e-potentiostat/?https://www.biologic.net/why-potentiostats- galvanostats/&gad_source=1&gad_campaignid= 9940642440&gbraid=0AAAAACffouU KWqGQREZ21v DMiYf48YwiI&gclid= Cj0KCQjw54nRBhDCARIsAMcY_SA 9mM0vYc_zEeBhG5cFrMZTj8BTwG JP32nR0P2m YcK5uvHcpZj5Y e8aAjLSEALw_wcB | Electrochemical control |
| Quadrupole mass spectrometer (QMS) | Bruker | https://www.bruker.com/en.html | Gas analysis during operation |
| Reference electrode (H2/H+, RHE) | Gaskatel, Mini-HydroFlex Hydrogen Reference Electrode | https://gaskatel.com/shop/reference-electrodes/mini-hydrogen-reference-electrode-mini- hydroflex/ | Reference electrode for three-electrode setup |
| Titanium plates (Ti electrode) | Custom made, CETIMA cz | — | Working electrode support |
| Tubing (PTFE or similar) | PTFE tubes, 3 mm diameter | https://ptfetubeshop.com/en/product/ptfe-tube-awg-9l-300-mm-id-x-340-mm-od/ | Chemically resistant fluid transport |
Reprints and Permissions
This article has been published
Video Coming Soon