LC3 immunoblotting is a widely used method for monitoring autophagy but requires careful optimization. This protocol describes a robust approach for LC3-II detection and quantification in KPC-derived pancreatic cancer cells, including key technical considerations and a standardized workflow for densitometric analysis using Fiji.
A subscription to JoVE is required to view this content. Sign in or start your free trial.
Method Article
Western Blot Analysis of Microtubule-Associated Protein Light Chain 3 to Monitor Autophagosomal Dynamics in Mouse-Derived Pancreatic Cancer Cells
In This Article
Summary
Abstract
Autophagy plays a complex role in pancreatic ductal adenocarcinoma (PDAC), contributing to tumor progression, stress adaptation, and therapy resistance. Accurate assessment of autophagosomal dynamics is therefore essential for studies of cancer biology. Among the available methods, immunoblotting of microtubule-associated protein light chain 3 (LC3) is widely used to monitor autophagosomal dynamics by distinguishing between the cytosolic (LC3-I) and lipidated, autophagosome-associated (LC3-II) forms. However, the low molecular weight of LC3 and the minimal difference in electrophoretic mobility between these isoforms present technical challenges that require careful optimization. Presented here is a reproducible protocol for the semi-quantitative analysis of LC3-II levels by Western blot in KPC-derived murine pancreatic cancer cells. The method incorporates optimized conditions for cell lysis, electrophoresis, protein transfer, and antibody-based detection to ensure reliable separation and detection of LC3 isoforms. In addition, a standardized workflow for densitometric analysis of LC3-II bands using Fiji (ImageJ) is provided. The sensitivity of the method is demonstrated through the detection of increased LC3-II levels under conditions of autophagy induction (gemcitabine treatment) and impaired autophagic flux (VMP1 knockdown). Critical technical parameters that influence data interpretation, including lysis buffer composition and antibody specificity, are also examined, together with common experimental pitfalls. Although LC3 immunoblotting alone is insufficient to fully define autophagic flux, when combined with complementary assays it provides a robust and accessible approach for monitoring autophagic activity. The protocol can be adapted to other experimental contexts, facilitating mechanistic studies of autophagy in cancer models.
Introduction
Macroautophagy (hereafter referred to as autophagy) is a regulated degradative pathway through which cells degrade cytoplasmic material, including proteins and dysfunctional organelles. A hallmark of autophagy is the formation of a double-membraned structure known as the autophagosome, which sequesters cellular cargo and subsequently delivers it to lysosomes for degradation1,2,3. In normal cells, autophagy contributes to the controlled turnover of proteins and organelles, thereby limiting oxidative stress and reducing the risk of tumor development. In cancer cells, however, this process can be co-opted to support survival under conditions of high metabolic demand, nutrient deprivation, and hypoxia. By facilitating adaptation to a hostile microenvironment, autophagy also contributes to chemotherapy resistance, in part by mitigating treatment-induced cellular damage4,5.
Pancreatic cancer ranks as the third leading cause of cancer-related mortality in the United States. Approximately 90% of pancreatic cancers are classified as pancreatic ductal adenocarcinoma (PDAC). Unlike several other malignancies, for which early detection and therapeutic advances have improved patient survival, PDAC is diagnosed at an advanced stage in more than 80% of cases. This late-stage presentation, combined with aggressive tumor biology and marked resistance to therapy, results in a 5-year overall survival rate of approximately 11%6.
The KPC mouse model, based on pancreas-specific activation of oncogenic Kras and conditional deletion of Trp53 driven by Cre recombinase, is one of the most widely used genetically engineered models of pancreatic ductal adenocarcinoma. These mice spontaneously develop tumors that closely resemble the human disease, progressing from pancreatic intraepithelial neoplasia (PanIN) to invasive carcinoma. Importantly, this model recapitulates key features of pancreatic cancer, including a dense desmoplastic stroma and an immunosuppressive tumor microenvironment. Tumor cells isolated from KPC mice (KPC-derived cells) provide a complementary in vitro system that retains many of the genetic and phenotypic characteristics of the original tumors, enabling mechanistic studies and controlled evaluation of therapeutic responses7,8.
VMP1 is an essential autophagy-related protein that initiates autophagy through its interaction with Beclin-1 and recruitment of the PI3KC3 complex9,10. Beyond initiation, VMP1 participates in multiple stages of autophagy, including autophagosome formation10, closure11, and selective processes such as mitophagy12 and zymophagy13. VMP1 remains involved throughout autophagic flux and may exert additional functions as a phospholipid scramblase14. In the pancreas, VMP1 expression is typically low but is strongly induced under stress conditions, including pancreatitis and oncogenic transformation, where it promotes autophagy downstream of mutant KRAS signaling15,16. VMP1 is overexpressed in pancreatic cancer17, and experimental mouse models have shown that VMP1-dependent autophagy cooperates with KRAS to promote tumor initiation and PanIN formation18. Furthermore, VMP1 contributes to chemotherapy resistance because its upregulation by agents such as gemcitabine19 stimulates autophagy19 and supports tumor cell survival17, highlighting its pro-tumorigenic role15.
Autophagosomes are characterized by the presence of the autophagy-related protein microtubule-associated protein light chain 3 (LC3)20. Under basal conditions, LC3 is predominantly present in a soluble form (LC3-I) distributed throughout the cytoplasm and nucleus. Upon activation of autophagy, LC3 undergoes lipidation through conjugation to phosphatidylethanolamine, generating the membrane-associated form LC3-II1,21. Although LC3-II has a higher molecular weight than LC3-I due to this modification, it migrates more rapidly during SDS-PAGE, likely because of its increased hydrophobicity. Consequently, the conversion of LC3-I to LC3-II reflects lipidation rather than proteolytic processing, with LC3-I typically detected at approximately 16 kDa and LC3-II at approximately 14 kDa. Because LC3-II levels correlate with autophagosome abundance, LC3 immunoblotting is widely used to monitor autophagic activity22. Accurate assessment of LC3 dynamics is therefore essential for interpreting autophagy-related experimental findings.
This study details the standardization and technical optimization of a classical LC3 immunoblot protocol in a KPC-derived pancreatic cancer cell line. Optimization is particularly important because LC3 is a low-molecular-weight protein, the LC3-I and LC3-II forms differ by only ~2 kDa in electrophoretic mobility, and LC3-II is a lipidated species21,22. Consequently, minor procedural variations can compromise LC3 detection and lead to suboptimal results. In addition, the species origin of the samples represents an important consideration for achieving optimal immunoreactivity. The optimized protocol is sufficiently sensitive to detect increased LC3-II levels following treatment with the chemotherapeutic agent gemcitabine and following VMP1 knockdown, conditions known to stimulate autophagy and impair autophagic flux, respectively. Finally, two potential technical pitfalls are highlighted to demonstrate their impact on data quality and result interpretation. An overview of this experimental workflow is illustrated in Figure 1.
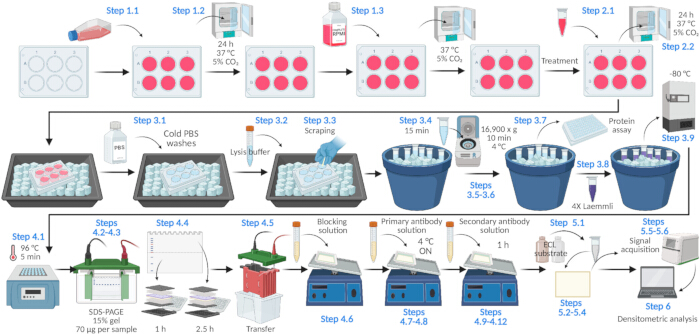
Figure 1: Schematic representation of the LC3 immunoblot protocol in KPC-derived cells. Schematic overview of the protocol used to detect and quantify LC3-II levels by immunoblotting. KPC-derived pancreatic cancer cells are cultured and subjected to experimental treatments, followed by cell lysis, protein quantification, SDS–PAGE, membrane transfer, antibody-based detection of LC3, chemiluminescent signal acquisition, and densitometric analysis of LC3-II bands normalized to a loading control. The workflow highlights the major procedural steps and critical stages required for reliable assessment of LC3 dynamics. Created with BioRender.com. Please click here to view a larger version of this figure.
Access restricted. Please log in or start a trial to view this content.
Protocol
All procedures involving animals were performed in accordance with institutional guidelines and approved by the Institutional Animal Care and Use Committee (IACUC) of Massachusetts General Hospital under protocol #2019N000111. The KPC-derived pancreatic cancer cell line used in this study was previously established in the Mostoslavsky laboratory under this approved protocol. The list of reagents, chemicals, and equipment information is provided in the Table of Materials.
1. Cell preparation
- Seed low-passage KrasG12D; Trp53f/+; p48-Cre (hereafter referred to as KPC)-derived pancreatic tumor cells in a 6-well plate in Roswell Park Memorial Institute medium (RPMI 1640) containing 10% fetal bovine serum, 100 U/mL penicillin, and 100 µg/mL streptomycin. Adjust the seeding density to obtain 70%–90% confluence on the day of lysis.
NOTE: A seeding density of 3.5 × 10⁵ cells per well resulted in ~80% confluence after 72 h. Because growth may vary among laboratories and KPC models, determine the optimal seeding density empirically before performing the experiment.
NOTE: To generate stable VMP1-knockdown cell lines, produce lentiviral particles by co-transfecting HEK293T cells with packaging plasmids and the respective lentiviral vector using polyethylenimine (PEI). Harvest lentiviral supernatants 72 h post-transfection, centrifuge at 300 × g for 10 min at 4 °C to remove cellular debris, and filter through a 0.45 µm syringe filter. Subject KPC cells to a single round of transduction with the harvested viral supernatants. Select stably transduced cells by treatment with 2.5 µg/mL puromycin (1:4,000 dilution from a 10 mg/mL stock solution) for 72 h. - Culture the cells at 37 °C in a humidified incubator with 5% carbon dioxide (CO₂).
- Replace the medium with fresh medium and continue incubation under the same conditions.
2. Treatment with 20 µM gemcitabine
- Prepare a 10 mM gemcitabine solution in RPMI medium one day before lysis. Treat each well with 4 µL of the 10 mM solution to achieve a final concentration of 20 µM.
- Incubate the cells for 24 h at 37 °C in a humidified incubator with 5% carbon dioxide (CO₂).
3. Cell lysates
- Place the plate on ice and wash three times with cold phosphate-buffered saline (PBS; 137 mM NaCl, 2.7 mM KCl, 8 mM Na₂HPO₄, and 2 mM KH₂PO₄).
- Add 80 µL of lysis buffer (50 mM Tris-HCl, pH 8.0, 150 mM NaCl, 1% Triton X-100, and 0.1% SDS) supplemented with protease inhibitors.
NOTE: If different confluence levels are observed between wells, adjust the lysis buffer volume to obtain comparable protein concentrations. As a guideline, use ~10 µL of lysis buffer per 10% confluence (e.g., 70 µL for 70% confluence and 90 µL for 90% confluence). - Using the wide (proximal) end of a P200 pipette tip, thoroughly scrape the entire surface of each well to detach and collect the cells in the lysis buffer.
- Collect the lysate into a microcentrifuge tube and keep it on ice for 15 min.
- Centrifuge the samples at 16,900 × g at 4 °C for 10 min.
- Transfer the supernatant to a clean microcentrifuge tube.
- Remove an aliquot for protein quantification and keep it on ice until analysis.
NOTE: For protein quantification, dilute 2.5 µL of lysate in 7.5 µL of lysis buffer and mix with 200 µL of bicinchoninic acid reagent. Alternative protein quantification methods may also be used. - Add 4× Laemmli sample buffer (250 mM Tris-HCl, pH 6.8, 8% SDS, 40% glycerol, 0.04% bromophenol blue, and 20% β-mercaptoethanol) to the lysates and mix thoroughly. For 77.5 µL of lysate, add 25.8 µL of Laemmli sample buffer.
- Store the samples at −80 °C.
NOTE: The protocol can be paused at this step. Samples may be stored at −80 °C for up to two weeks before SDS–PAGE.
4. SDS–PAGE and Western blot
- Heat the samples at 96 °C for 5 min.
- Load 70 µg of each sample onto a 15% SDS–PAGE gel (1.5 mm thickness) and run electrophoresis at 90 V until the dye front enters the resolving gel. Use a self-cast 15% polyacrylamide resolving gel containing 15% acrylamide/bis-acrylamide, 375 mM Tris-HCl (pH 8.8), and 0.1% SDS.
- Increase the voltage to 120 V and continue electrophoresis until the dye front reaches or runs off the bottom of the gel. Stop the run before the 10 kDa marker of the molecular weight ladder runs off the gel.
- Cut the gel at approximately 25 kDa to separate the upper and lower portions.
- Transfer proteins to a 0.2 µm PVDF membrane pre-activated with methanol in transfer buffer (25 mM Tris base, 192 mM glycine, and 20% [v/v] methanol) at 200 mA for 1 h for the lower gel portion (<25 kDa) and 2.5 h for the upper gel portion (>25 kDa).
- Block the membrane for 1 h in blocking buffer with gentle agitation.
- Prepare a 1:1,000 solution of anti-LC3 primary antibody in blocking buffer containing 0.1% Tween-20.
NOTE: The anti-LC3 primary antibody was used at a 1:1,000 dilution, and the anti-actin loading control antibody was used at a 1:4,000 dilution. - Incubate the membrane overnight at 4 °C with anti-LC3 primary antibody under gentle agitation.
- Wash the membrane four times for 5 min with TBS-T (0.1% Tween-20 in TBS; 20 mM Tris-HCl, pH 7.6, and 150 mM NaCl).
- Prepare a 1:2,000 solution of horseradish peroxidase-conjugated anti-rabbit secondary antibody in blocking buffer.
- Incubate the membrane with secondary antibody for 1 h at room temperature under gentle agitation.
- Wash the membrane four times for 5 min with TBS-T.
- Wash the membrane twice with TBS.
5. Chemiluminescent detection
- Prepare the two-component enhanced chemiluminescence substrate by mixing equal volumes of Reagent A (luminol/enhancer solution) and Reagent B (peroxide solution) immediately before use.
- Gently blot excess liquid from the membrane using a laboratory wipe.
- Place the membrane in an opaque box.
- Add the enhanced chemiluminescence solution to the membrane, close the box, and incubate for 5 min.
- Allow excess solution to drain from the membrane and place the membrane in the imaging system for signal detection.
- Acquire images according to the manufacturer's instructions for the imaging system.
6. Densitometric analysis using Fiji
- Drag and drop the image file into the Fiji window to open it.
- Convert the image to 8-bit grayscale (Image → Type → 8-bit).
- If necessary, rotate the image to align the bands horizontally (Image → Transform → Rotate).
- Enable Preview and set the grid to an appropriate number of lines (e.g., 20).
- Adjust the rotation angle until the bands are properly aligned.
- Use the rectangular selection tool to define a region of interest (ROI) around the first lane, including only the band corresponding to LC3-II.
NOTE: The selection should not be more than twice as wide as it is tall. Use the same ROI dimensions for all bands included in the analysis. - Select Analyze → Gels → Select First Lane.
- Move the same ROI to the next lane and position it around the corresponding band.
- Select Analyze → Gels → Select Next Lane.
- Repeat steps 6.6 and 6.7 until the final lane is selected.
- Generate intensity profiles (Analyze → Gels → Plot Lanes).
- Use the straight-line tool to define each peak baseline and quantify band intensity using the wand tool.
- Normalize the values to a loading control.
Access restricted. Please log in or start a trial to view this content.
Results
This protocol describes Western blotting to monitor LC3 dynamics in a KPC-derived pancreatic cancer cell line under different experimental conditions. The protocol generates chemiluminescent images of LC3 and a loading control. In this study, actin was used as the loading control.
Two representative applications of the protocol are shown. First, control KPC cells were compared with gemcitabine-treated KPC cells. Gemcitabine is a chemotherapeutic agent previously reported to induce autophagy in...
Access restricted. Please log in or start a trial to view this content.
Discussion
This article describes the technical optimization and standardization of a classical LC3 immunoblotting protocol in KPC-derived pancreatic cancer cells. Given the increasingly recognized role of autophagy and autophagy-related proteins in pancreatic cancer development and progression23, this standardized workflow provides a reliable approach for monitoring LC3 dynamics. The protocol can be applied to evaluate the autophagosomal pool under a variety of experimental conditions, including chemotherap...
Access restricted. Please log in or start a trial to view this content.
Disclosures
The authors declare no conflicts of interest.
Acknowledgements
This work was supported by grants from the Consejo Nacional de Investigaciones Científicas y Técnicas (CONICET) [PIP 2021–2023 GI-11220200101549CO], the Agencia Nacional de Promoción de la Investigación, el Desarrollo Tecnológico y la Innovación (Agencia I+D+i) [PICT-2021-I-A-00328], the Universidad de Buenos Aires [UBACyT 2023–2025, 20020220300232BA], and the Fundación Norberto Quirno, Ciudad de Buenos Aires.
The authors gratefully acknowledge The Company of Biologists for financial support through a Traveling Fellowship awarded by Disease Models & Mechanisms. This support contributed to the work arising from the funded visit. Further information about the charity is available at https://www.biologists.com/.
Access restricted. Please log in or start a trial to view this content.
Materials
| Name | Company | Catalog Number | Comments |
|---|---|---|---|
| C-DiGit Blot Scanner | LI-COR BioScience | 3600 | Used for chemiluminescent detection in Step 5.6 |
| 10x Phosphate-Buffered Saline (PBS) | Corning | 46-013-CM | Used to prepare sterile 1x PBS for washing cells prior to passaging in Step 1.1. |
| 2-Mercaptoethanol (β-mercaptoethanol) | Sigma-Aldrich (Merck) | M3148 | Used to prepare 4× Laemmli sample buffer for SDS-PAGE sample preparation in Step 3.8. |
| 3D Shaker | DLAB | SK-D1807-E | Used for incubating membranes in blocking, primary, and secondary antibody solutions, as well as during wash steps (Steps 4.6, 4.8, 4.9, 4.11, 4.12, and 4.13). |
| 6 Well- Cell Culture Plate | SORFA | SCP-11-006 | Used to seed cells in Step 1.1. |
| Acrylamide | Sigma-Aldrich (Merck) | A8887 | Used to prepare the 15% SDS-PAGE gel required for Steps 4.2–4.5. |
| Anti-Glyceraldehyde-3-Phosphate Dehydrogenase, mouse monoclonal, clone 6C5 | Merck Millipore | MAB374 | RRID:AB_2107445 Reactivity: human, feline, pig, mouse, rabbit, fish, canine, rat. Used as a loading control to evaluate knockdown efficiency (Figures 2C and 2D). |
| Anti-mouse IgG, HRP-linked Antibody | Cell Signaling Technology | 7076 | RRID: AB_330924. Used to prepare the secondary antibody solution in Step 4.10. |
| Anti-rabbit IgG, HRP-linked Antibody | Cell Signaling Technology | 7074 | RRID: AB_2099233. Used to prepare the secondary antibody solution in Step 4.10. |
| Anti-β-Actin (ACTB) Antibody mouse monoclonal, AC-15 | Sigma-Aldrich (Merck) | A1978 | RRID:AB_476744 Reactivity: sheep, carp, feline, chicken, rat, mouse, Hirudo medicinalis, rabbit, canine, pig, human, bovine, guinea pig. Used as a loading control in Figures 2A, 2B, 2E, 2F, 2G, and 2H. |
| Bromophenol blue | Sigma-Aldrich (Merck) | B0126 | Used to prepare 4× Laemmli sample buffer for SDS-PAGE sample preparation in Step 3.8. |
| Ethylenediaminetetraacetic acid (EDTA) | Sigma-Aldrich (Merck) | E9884 | Used to prepare the low-detergent lysis buffer (Figures 2G and 2H). |
| Fetal Bovine Serum | NATOCOR | Lintc-634 | Used to prepare complete medium for culturing cells (Steps 1 and 2). |
| Fiji | Open-source software | N/A | Image analysis software |
| Glycerol | Sigma-Aldrich (Merck) | G5516 | Used to prepare 4× Laemmli sample buffer for SDS-PAGE sample preparation in Step 3.8. |
| Glycine | Sigma-Aldrich (Merck) | G7126 | Used to prepare transfer buffer for Step 4.5. |
| Immun-Blot PVDF Membrane, Roll, 0.2 µm, 26 cm x 3.3 m | Bio-Rad | 1620177 | Used for transfer in Step 4.5. |
| Intercept (TBS) Blocking Buffer | LI-COR BioScience | 927-60001 | Used for blocking in Step 4.6, and for preparing primary and secondary antibody solutions in Steps 4.7 and 4.10. |
| LC3 A/B (D3U4C) Rabbit Monoclonal Antibody | Cell Signaling Technology | 12741 | RRID: AB_2617131 Reactivity: human, mouse, rabbit. Used to prepare the primary antibody solution in Step 4.7. |
| LC3B (D11) Rabbit Monoclonal Antibody | Cell Signaling Technology | 3868S | RRID: AB_2137707 Reactivity: Human. Used as the LC3 primary antibody in Figure 2H. |
| Methanol | Anedra | 6197 | Used to activate the PVDF membrane and prepare transfer buffer in Step 4.5. |
| Millex-HV Syringe Filter Unit, 0.45 μm PVDF | Merck Millipore | SLHV033RS | Used to filter lentivirus-containing medium (Step 1.1). |
| Mini digital dry bath | Labnet International, Inc. | D 5060075 | Used to heat samples in Step 4.1. |
| Mini-PROTEAN Tetra electrophoresis system | Bio-Rad | 1658025FC | Used for SDS-PAGE and transfer in Steps 4.2, 4.3, and 4.5. |
| MISSION shRNA targeting mouse Vmp1 (TRCN0000279038) | Sigma-Aldrich (Merck) | SHCLND-NM_029478 | Used to generate stable VMP1-knockdown cell lines (Step 1.1). |
| N,N'-Methylenebisacrylamide (Bis-acrylamide) | Sigma-Aldrich (Merck) | M7279 | Used to prepare the 15% SDS-PAGE gel required for Steps 4.2–4.5. |
| Nabigem 1g Gemcitabine | Microsules Argentina | M3060584-3 | Used for gemcitabine treatment in Step 2. |
| Pen-Strep Solution | Sartorius | 03-031-1B | Used to prepare complete medium for culturing cells (Steps 1 and 2). |
| Pierce BCA Protein Assay Kit | Thermo Fisher Scientific | 23227 | Used for protein quantification (Step 3.7). |
| Pierce Protease Inhibitor Tablets | Thermo Fisher Scientific | A32953 | Used to prepare lysis buffer in Step 3.2. |
| Polyethylenimine HCl MAX, Linear (PEI MAX), MW 40,000 | Polysciences | 24765-1 | Used for transfection with lentiviral plasmids (Step 1.1). |
| Potassium chloride (KCl) | Sigma-Aldrich (Merck) | P9333 | Used to prepare PBS in Step 3.1. |
| Potassium phosphate monobasic (KH2PO4) | Sigma-Aldrich (Merck) | P5655 | Used to prepare PBS in Step 3.1. |
| PowerPac Basic Power Supply | Bio-Rad | 1645050 | Used for SDS-PAGE and transfer in Steps 4.2, 4.3, and 4.5. |
| Prestained ProteinLadder | Genbiotech | PM201 | Used for SDS-PAGE in Steps 4.2 - 4.4. |
| Puromycin (10 mg/mL solution) | InvivoGen | ant-pr-1 | Used for selection of stably transduced cells (Step 1.1). |
| RPMI 1640 | Genbiotech | MC2012L | Used to prepare complete medium for culturing cells (Steps 1 and 2). |
| Sodium chloride (NaCl) | Sigma-Aldrich (Merck) | S9888 | Used to prepare PBS in Step 3.1, lysis buffers in Step 3.2, and TBS in Step 4.9. |
| Sodium dodecyl sulfate (SDS) | Sigma-Aldrich (Merck) | L3771 | Used to prepare lysis buffer in Step 3.2 and the 15% SDS-PAGE gel required for Steps 4.2–4.5. |
| Sodium fluoride (NaF) | Sigma-Aldrich (Merck) | S7920 | Used to prepare the low-detergent lysis buffer (Figures 2G and 2H). |
| Sodium phosphate dibasic (Na2HPO4) | Sigma-Aldrich (Merck) | S9763 | Used to prepare PBS in Step 3.1. |
| Sorval ST 16R Centrifuge | Thermo Fisher Scientific | 75004380 | Used to centrifuge cells in Step 1.1 and lysates in Step 3.5. |
| Sustrato quimioluminiscente SuperSignal West Pico PLUS | Thermo Fisher Scientific | 34577 | Used for chemiluminescent detection in Step 5.1. |
| Thermo Scientific 1300 Series A2 Class II, Type A2 Biosafety Cabinet | Thermo Fisher Scientific | 1386 | Used for sterile cell culture handling in Steps 1.1, 1.3, and 2.1. |
| Thermo Scientific BB 150 CO2 Incubator | Thermo Fisher Scientific | BB150-2TCS-L | Used for culturing cells in Steps 1.2, and 2.2. |
| TMEM49/VMP1 (D1Y3E) Rabbit Monoclonal Antibody | Cell Signaling Technology | 12929 | RRID: AB_2714018 Reactivity: human, mouse, rat. Used as a primary antibody to verify VMP1 knockdown efficiency in Figures 2C and 2D. |
| Tris base | Sigma-Aldrich (Merck) | T1503 | Used to prepare transfer buffer for Step 4.5. |
| Tris hydrochloride (Tris-HCl) | Sigma-Aldrich (Merck) | T3253 | Used to prepare lysis buffers in Step 3.2, 4× Laemmli sample buffer in Step 3.8, the 15% SDS-PAGE gel required for Steps 4.2–4.5, and TBS in Step 4.9. |
| Triton X-100 | Sigma-Aldrich (Merck) | T8787 | Used to prepare lysis buffers in Step 3.2. |
| Trypsin EDTA | Gibco | 11570626 | Used to passage cells in Step 1.1. |
References
- Grasso D, Renna FJ, Vaccaro MI. Initial steps in mammalian autophagosome biogenesis. Front Cell Dev Biol. 2018;6:146.
- Galluzzi L, et al. Molecular definitions of autophagy and related processes. EMBO J. 2017;36(13):1811–1836.
- Wang Q, Sun Y, Li TY, Auwerx J. Mitophagy in the pathogenesis and management of disease. Cell Res. 2026;36(1):11–37.
- Debnath J, Gammoh N, Ryan KM. Autophagy and autophagy-related pathways in cancer. Nat Rev Mol Cell Biol. 2023;24(8):560–575.
- Altalbawy FMA, et al. Deciphering autophagy signaling in cancer: A paradigm shift from molecular classifications to clinical innovations. Semin Oncol. 2025;52(5):152397.
- Stoffel EM, Brand RE, Goggins M. Pancreatic cancer: Changing epidemiology and new approaches to risk assessment, early detection, and prevention. Gastroenterology. 2023;164(5):752–765.
- Kugel S, et al. SIRT6 suppresses pancreatic cancer through control of Lin28b. Cell. 2016;165(6):1401–1415.
- Hingorani SR, et al. Trp53R172H and KrasG12D cooperate to promote chromosomal instability and widely metastatic pancreatic ductal adenocarcinoma in mice. Cancer Cell. 2005;7(5):469–483.
- Molejon MI, Ropolo A, Re AL, Boggio V, Vaccaro MI. The VMP1-Beclin 1 interaction regulates autophagy induction. Sci Rep. 2013;3:1055.
- Ropolo A, et al. The pancreatitis-induced vacuole membrane protein 1 triggers autophagy in mammalian cells. J Biol Chem. 2007;282(51):37124–37133.
- Zhao YG, et al. The ER-localized transmembrane protein EPG-3/VMP1 regulates SERCA activity to control ER-isolation membrane contacts for autophagosome formation. Mol Cell. 2017;67(6):974–989.e6.
- Vanasco V, Ropolo A, Grasso D, Alvarez S, Vaccaro MI. VMP1-dependent selective mitophagy and mitochondrial fragmentation are protective cellular mechanisms in pancreatitis. Pancreatology. 2018;18(4 Suppl):S86–S87.
- Grasso D, et al. Zymophagy, a novel selective autophagy pathway mediated by VMP1-USP9x-p62, prevents pancreatic cell death. J Biol Chem. 2011;286(10):8308–8324.
- Ghanbarpour A, Valverde DP, Melia TJ, Reinisch KM. A model for a partnership of lipid transfer proteins and scramblases in membrane expansion and organelle biogenesis. Proc Natl Acad Sci U S A. 2021;118(16):e2101562118.
- Renna FJ, Gonzalez CD, Vaccaro MI. Decoding the versatile landscape of autophagic protein VMP1 in cancer: A comprehensive review across tissue types and regulatory mechanisms. Int J Mol Sci. 2024;25(7):3758.
- Lo Ré AE, et al. Novel AKT1-GLI3-VMP1 pathway mediates KRAS oncogene-induced autophagy in cancer cells. J Biol Chem. 2012;287(30):25325–25334.
- Gilabert M, et al. Novel role of VMP1 as modifier of the pancreatic tumor cell response to chemotherapeutic drugs. J Cell Physiol. 2013;228(9):1834–1843.
- Loncle C, et al. The pancreatitis-associated protein VMP1, a key regulator of inducible autophagy, promotes Kras(G12D)-mediated pancreatic cancer initiation. Cell Death Dis. 2016;7(7):e2295.
- Ropolo A, et al. A novel E2F1-EP300-VMP1 pathway mediates gemcitabine-induced autophagy in pancreatic cancer cells carrying oncogenic KRAS. Front Endocrinol (Lausanne). 2020;11:411.
- Tanida I, Ueno T, Kominami E. LC3 and autophagy. Methods Mol Biol. 2008;445:77–88.
- Kabeya Y, et al. LC3, a mammalian homologue of yeast Apg8p, is localized in autophagosome membranes after processing. EMBO J. 2000;19(21):5720–5728.
- Mizushima N, Yoshimori T. How to interpret LC3 immunoblotting. Autophagy. 2007;3(6):542–545.
- Li J, Chen X, Kang R, Zeh HJ, Klionsky DJ, Tang D. Regulation and function of autophagy in pancreatic cancer. Autophagy. 2021;17(11):3275–3296.
- Moresco P, et al. Signal peptide-independent secretion of keratin-19 by pancreatic cancer cells. Proc Natl Acad Sci U S A. 2025;122(27):e2426218122.
- Gonzalez CD, Resnik R, Vaccaro MI. Secretory autophagy and its relevance in metabolic and degenerative disease. Front Endocrinol (Lausanne). 2020;11:266.
- Klionsky DJ, et al. Guidelines for the use and interpretation of assays for monitoring autophagy (4th edition). Autophagy. 2021;17(1):1–382.
- Renna FJ, Herrera Lopez M, Manifava M, Ktistakis NT, Vaccaro MI. Evaluating autophagy levels in two different pancreatic cell models using LC3 immunofluorescence. J Vis Exp. 2023;(194):e65005. doi:10.3791/65005.
Access restricted. Please log in or start a trial to view this content.
Reprints and Permissions
This article has been published
Video Coming Soon