Preoperative ultrasound biomicroscopy reveals that a shortened simulated cilio-lenticular distance, increased lens vault, and narrowed trabecular-ciliary process angle are exploratory anatomical clusters significantly associated with malignant glaucoma development following primary angle-closure glaucoma surgery.
Research Article
Deconstructing Anterior Segment Crowding: Preoperative Anatomical Predictors of Malignant Glaucoma After Primary Angle-Closure Glaucoma Surgery
In This Article
Summary
Abstract
Understanding anterior segment crowding is essential for identifying preoperative risk factors for malignant glaucoma (MG) following phacoemulsification, intraocular lens implantation, and goniosynechialysis (PEI‒GSL) in primary angle-closure glaucoma (PACG). This retrospective case-control study compared 24 PACG patients who developed postoperative MG (MG group) to 24 randomly selected controls (control group). Preoperative ultrasound biomicroscopy (UBM) metrics included anterior chamber depth (ACD), lens vault (LV), ciliary process distance (CCD), ciliary body thickness, anterior ciliary body placement, trabecular‒ciliary process angle (TCPA), and simulated cilio-lenticular distance (sCLD). To eliminate observer bias, all exported raw UBM images were completely anonymized, stripped of all identifiable metadata, randomized, and assigned unique computer-generated hashes before undergoing single-blinded evaluation. The MG group exhibited significantly shorter sCLD, greater LV, shallower ACD, and narrower TCPA preoperatively, with standardized mean differences exceeding 0.8. After False Discovery Rate correction, these differences remained significant (adjusted P < 0.05). Crucially, multivariable logistic regression adjusting for axial length (AL) demonstrated that a shortened sCLD (P < 0.001), an increased LV (P < 0.001), and a narrowed TCPA (adjusted P = 0.0099) maintained highly robust independent associations with MG development. The MG group showed a trend of weakened parameter coordination, particularly between AL and ACD (r = 0.334 vs. 0.718). Exploratory principal component analysis identified an architectural "anterior segment crowding" axis (explaining 62.2% of the variance), with the MG group clustering negatively. An exploratory, unweighted composite ciliary block score showed a large separation effect size (Cohen’s d = 1.995, P < 0.001). In conclusion, preoperative shortened sCLD, increased LV, and narrowed TCPA constitute an anatomical risk cluster independently associated with postoperative MG. While anterior segment crowding characterizes this cohort, these multivariate models function strictly as exploratory, sample-specific constructs and explicitly lack external clinical validation.
Introduction
Primary angle closure glaucoma (PACG) is a leading cause of irreversible blindness. It is particularly common in Asian populations, where anatomical predispositions to narrow anterior chamber angles are highly prevalent1. These patients frequently suffer from elevated intraocular pressure. They often require surgical treatment to lower this pressure and prevent permanent optic nerve damage. Phacoemulsification combined with intraocular lens implantation and goniosynechialysis (PEI-GSL) is currently a highly effective surgical option. This procedure has demonstrated superior clinical efficacy in enlarging the anterior chamber angle, reducing dependency on topical glaucoma medications, and stabilizing long-term intraocular pressure fluctuations compared to alternative traditional options, such as laser peripheral iridotomy or laser peripheral iridoplasty2. This procedure removes the thickened lens and separates the adhered anterior chamber angle. It effectively relieves pupillary block and opens the closed angle. However, while PEI-GSL offers significant clinical advantages over traditional filtering approaches (such as trabeculectomy) by lowering the incidence of prolonged postoperative hypotony, bleb-related infections, and early postoperative hyphema, it can sometimes lead to severe postoperative complications. Postoperative malignant glaucoma (MG) is one of the most challenging complications. Although rare, MG is a sight-threatening emergency. It is difficult to treat and often leads to treatment failure and severe visual impairment3,4. Early identification and prevention are therefore extremely important for PACG patients undergoing this surgery.
The clinical course of MG is complex and notoriously difficult to manage. Its core pathophysiological process involves the abnormal reversal of aqueous flow. In a healthy eye, aqueous humor drains anteriorly through the trabecular meshwork. In MG, the aqueous humor misdirects and accumulates in the posterior vitreous cavity. This continuous fluid buildup causes a rapid increase in vitreous pressure. The elevated pressure then pushes the entire lens-iris diaphragm forward. This physical displacement results in a generalized shallowing or complete flattening of the anterior chamber, distinguishing it from typical pupillary block configurations where a peripheral iridotomy remains patent. It also causes extensive secondary angle closure and a sharp rise in intraocular pressure. These events form a self-sustaining vicious cycle4,5,6. Traditionally, the occurrence of MG is closely linked to the concept of ciliary block. This mechanism suggests that the normal anatomical relationship among the ciliary body, crystalline lens, and anterior vitreous face is structurally disrupted. However, the exact anatomical risk factors for ciliary block remain unclear. We also lack precise preoperative predictive indicators. This lack of clarity creates significant challenges for early clinical identification and preventive surgical planning.
High-resolution imaging technologies have become essential tools for understanding these structural changes. Advances in ultrasound biomicroscopy (UBM) now allow for detailed measurements of the anterior segment. UBM can clearly visualize dark and hidden structures, including the ciliary body and the posterior chamber. This technology offers great potential for clarifying the anatomical basis of MG7,8. Previous UBM studies indicate that a combination of certain macroscopic anatomical features creates a high-risk foundation for malignant glaucoma. These features typically include a short axial length and a very shallow anterior chamber. An anteriorly positioned lens and an abnormal anterior rotation of the ciliary body also contribute to this risk profile9,10,11. Recently, researchers have introduced novel UBM parameters to improve risk assessment. The simulated cilio-lenticular distance (sCLD) is one such important parameter. It has gained significant attention in recent years. Researchers believe it may more directly reflect the localized risk of ciliary-lenticular block (ciliary block) compared to traditional global measurements12.
The specific mechanistic role of these novel parameters in predicting MG has not been systematically investigated. Furthermore, their synergistic relationships with other key structural parameters require deeper exploration. Evaluating isolated parameters may not be enough to accurately predict surgical risks. A comprehensive assessment of anterior segment crowding might be necessary. Anterior segment crowding represents a macrolevel anatomical phenotype, and it is likely driven by the underlying ciliary block mechanism. Analyzing the structural coordination among various ocular parameters before surgery could provide deeper insights into the disease process. Therefore, this study aims to systematically deconstruct the anatomical basis of anterior segment crowding. We retrospectively compared detailed preoperative ocular parameters between PACG patients who developed MG after PEI-GSL and a control group who did not12,13. Through this controlled comparison, we seek to identify potential high-risk anatomical features12.
From a practical applicability perspective, this quantitative UBM screening approach offers clinicians a reproducible blueprint to stratify surgical risks and implement preventive management strategies before undergoing acute ocular decompression14. However, readers must acknowledge the clinical limitations inherent to this technique: UBM is highly operator-dependent, demands contact-shell immersion, which can be technically challenging or hazardous in exceptionally shallow anterior chambers, and restricts its evaluation to static anterior structures, thereby leaving out the potential hemodynamic or hydrostatic influences exerted by dynamic posterior vitreous and choroidal status15,16. The ultimate goal of this research is to provide data-driven hypotheses regarding the pathological mechanisms of MG and establish reliable preoperative screening indicators for high-risk PACG patients1,12.
Protocol
Formal institutional approval was obtained from the institutional Medical Ethics Committee before the initiation of the retrospective review. The investigation was conducted in strict accordance with the ethical principles of the Declaration of Helsinki. For the retrospective study design utilizing de-identified historical data, a waiver of informed consent was obtained from the oversight committee. Broad general consent for research utilization had been secured from patients at the time of their initial surgical admission.
1. Patient selection and cohort stratification
Case screening and group assignment
The institutional electronic medical record database was screened to identify all patients diagnosed with primary angle-closure glaucoma (PACG) who had undergone phacoemulsification, intraocular lens implantation, and goniosynechialysis (PEI-GSL) during the defined study period.
Establishment of the Malignant Glaucoma (MG) group
Records of patients who developed postoperative malignant glaucoma (MG) within three months following the primary surgery were extracted. Strict diagnostic criteria were applied, including persistent shallowing or complete flattening of both the central and peripheral anterior chamber, accompanied by normal or elevated intraocular pressure (IOP), in the presence of a patent peripheral iridotomy. The diagnosis was independently confirmed by two senior glaucoma specialists who were masked to subsequent volumetric analyses.
Establishment of the control group
A random sampling sequence (e.g., generated using a computer-generated random number table) was implemented to select control participants from the remaining pool of patients who had undergone identical PEI-GSL surgery during the same time frame by the same surgeon but did not exhibit signs of postoperative aqueous misdirection.
Eligibility and exclusion screening
Strict exclusion criteria were applied to all candidate records to minimize potential confounding factors. Excluded records included those with: (1) incomplete demographic, clinical, or imaging datasets; (2) a history of prior intraocular surgery or laser interventions; (3) intraoperative complications, including expulsive suprachoroidal hemorrhage, posterior capsular rupture, or intraoperative choroidal detachment; (4) secondary glaucoma configurations, such as neovascular, traumatic, uveitic, or exfoliative glaucoma, or primary open-angle glaucoma; and (5) coexisting structural anomalies, specifically nanophthalmos (defined as an axial length <20.0 mm) or lens subluxation.
2. Clinical baseline and preoperative examination procedures
Routine biometric assessment
Upon admission, standardized comprehensive ocular examinations were performed. Best-corrected visual acuity (BCVA) was documented using standard charts, and baseline intraocular pressure (IOP) was measured via Goldmann applanation tonometry. Detailed slit-lamp biomicroscopy was performed to verify anterior chamber depth and iris configuration. Optical biometry was conducted using an automated optical biometer to measure pre-surgical axial length (AL) via partial coherence interferometry.
Preoperative gonioscopy mapping
Dynamic and static gonioscopy were performed in a darkened room using a four-mirror gonioprism under minimal corneal pressure. The static narrow-angle configuration was documented according to the Scheie classification (Grades I–IV). To quantify peripheral anterior synechiae (PAS), gentle posterior pressure (compression gonioscopy) was applied to force open the recess, and the strict clock-hour extent of irreversible organic synechial angle closure across 360° was recorded.
Posterior segment screening
Spectral-domain optical coherence tomography (SD-OCT) scanning of the macula and optic disc was performed as part of the routine clinical protocol to assess the structural integrity of the retinal nerve fiber layer and to rule out comorbid vitreoretinal or macular pathologies. OCT-derived variables were excluded from subsequent predictive models of anterior segment crowding to maintain focus on local structural risk markers. Standard preoperative topical antimicrobial and fast-acting pressure-lowering medications were administered as clinically indicated.
3. Standardized surgical orchestration (PEI-GSL)
Anesthesia and incision architecture
Topical anesthesia was administered using topical ophthalmic anesthetic eye drops (0.5% proparacaine hydrochloride) three times before the procedure. The surgical field was sterilized and draped according to sterile ophthalmic protocols. A 2.2 mm main clear corneal tunnel incision was created at the temporal limbus, and a 1.0 mm side-port incision was created approximately 90° away using calibrated ophthalmic surgical blades.
Viscoelastic manipulation and goniosynechialysis
The anterior chamber was filled with a cohesive ophthalmic viscoelastic agent to deepen the space and maintain structural stability. A goniosynechialysis spatula was inserted through the side port under direct visualization through a surgical goniolens. The peripheral iris tissue was gently displaced posteriorly away from the trabecular meshwork. Mechanical dissection was performed across all clock hours exhibiting peripheral anterior synechiae until the scleral spur and trabecular meshwork were fully exposed.
Cataract extraction and intraocular lens implantation
A continuous curvilinear capsulorhexis approximately 5.0–5.5 mm in diameter was created. When pupil dilation was insufficient because of chronic synechiae, temporary pupil expansion devices were used to improve visualization. Standard phacoemulsification of the crystalline lens nucleus was performed using low-energy ultrasound parameters, followed by automated bimanual irrigation and aspiration of residual cortical material. A cohesive ophthalmic viscoelastic agent was injected to expand the capsular bag, and a foldable hydrophobic acrylic intraocular lens was implanted into the capsular bag. Residual viscoelastic material was then thoroughly aspirated from the anterior chamber and the retro-lens space.
Wound closure and postoperative medication management
The corneal stromal edges of the incisions were hydrated with balanced isotonic ophthalmic irrigation solution to achieve self-sealing wound closure. Structural watertight integrity was verified using the Seidel leakage test. At the conclusion of surgery, a combined antibiotic–corticosteroid ophthalmic ointment was applied. A standardized one-month postoperative topical regimen was maintained, consisting of combined antibiotic–corticosteroid ophthalmic drops (four times daily, tapered weekly), nonsteroidal anti-inflammatory ophthalmic drops (twice daily), and miotic ophthalmic drops containing 0.5% pilocarpine (twice daily) to stabilize the iris–lens diaphragm configuration.
4. Ultrasound biomicroscopy image acquisition settings
Instrument calibration and settings
High-frequency digital ultrasound biomicroscopy imaging was performed using a 50 MHz ultrasound biomicroscopy transducer. The electronic gain was set to 60–75 dB, with a scanning field of view of 14.0 mm × 10 mm and a scanning depth resolution of ≤50 µm. Prior to imaging, system calibration was verified using the manufacturer's automated electronic standard.
Scan execution and quality control checkpoints
Patients were positioned comfortably in the supine position under standardized mesopic lighting conditions (<5 lux). Patients were instructed to maintain steady fixation on a ceiling-mounted target. A sterile ophthalmic immersion eye cup was inserted into the conjunctival sac and filled with sterile physiological saline or 1% methylcellulose as an acoustic coupling medium. The high-frequency ultrasound probe was then gently immersed without applying mechanical pressure to the cornea.
Horizontal panoramic scan workflow
The probe was aligned horizontally across the vertical visual axis to obtain a panoramic cross-sectional image passing through the geometric center of the pupil. Image quality was considered acceptable only when the scleral spurs, iris contour, and anterior lens capsule were simultaneously and symmetrically visible on both the nasal and temporal sides of the image.
Radial quadrant scan workflow
Radial line scans were acquired at the 12, 3, 6, and 9 o'clock positions of the corneal limbus, corresponding to the superior, nasal, inferior, and temporal quadrants. At each location, the probe angle was adjusted until optimal acoustic alignment was achieved, as indicated by a distinct hyper-reflective scleral spur and clear visualization of the ciliary process apices. Images that did not meet these quality criteria were discarded and re-acquired.
5. Software-specific image measurement workflow
Image standardization and blinded randomization
Raw, uncompressed digital ultrasound biomicroscopy images were exported from the imaging system. To minimize assessor bias, all exported files were processed using an automated script that removed patient identifiers, randomized the image display order, and assigned a unique computer-generated cryptographic hash to each image. The randomized and blinded image set was subsequently provided to a single experienced glaucoma specialist for quantitative analysis.
Scale calibration and workspace setup
Images were opened in ImageJ. Spatial calibration was performed using the manufacturer's embedded calibration scale bar. A line corresponding to the known scale-bar length was defined, and the known distance and measurement unit (mm) were entered into the calibration settings. The calibration was applied globally to all images. Image contrast and brightness were standardized using fixed display settings to optimize visualization of anatomical boundaries.
Structural metric extraction and landmark resolution
Manual measurements were performed following predefined anatomical criteria.
Anterior Chamber Depth (ACD)
Anterior chamber depth was measured as the perpendicular distance between the central corneal endothelium and the anterior lens surface.
Lens Vault (LV)
A line connecting the nasal and temporal scleral spurs was established as the reference baseline. Lens vault was measured as the perpendicular distance from the anterior pole of the crystalline lens to the spur-to-spur baseline.
Ciliary Process–Ciliary Process Distance (CCD)
Using panoramic scans, the distance between the innermost ciliary process apex on one side and the corresponding apex on the opposite side was measured.
Ciliary body thickness boundary architecture
Radial quadrant scans were evaluated to identify the scleral spur and ciliary body boundaries. In regions affected by acoustic shadowing, measurements were referenced to the interface between the hyporeflective ciliary muscle tissue and the hyperreflective inner scleral wall.
Ciliary body thickness parameters
CBT0 was defined as the perpendicular distance from the scleral spur to the inner uveal border. CBT1000 was measured at a location 1000 µm posterior to the scleral spur along the inner scleral wall, with thickness determined perpendicular to the scleral surface. CBTmax was defined as the maximum thickness of the ciliary body adjacent to the ciliary process apex, measured perpendicular to the outer scleral surface.
Anterior Placement of the Ciliary Body (APCB)
A reference line perpendicular to the inner scleral wall was established at the scleral spur. APCB was measured as the perpendicular distance from the most anterior ciliary process apex to this reference line.
Trabecular–Ciliary Process Angle (TCPA)
The scleral spur served as the vertex of the angle. One arm extended along the inner border of the trabecular meshwork, while the second arm extended along the anterior surface of the ciliary process. The resulting angle was recorded in degrees.
Simulated Cilio-Lenticular Distance (sCLD)
A virtual tangent line passing through the scleral spur and oriented parallel to the outer scleral surface was established. The shortest distance from the ciliary process apex to this tangent line and the shortest distance from the anterior lens capsule to the same tangent line were measured. The difference between these measurements was recorded, with negative values retained when the ciliary process extended anteriorly beyond the lens plane.
For parameters obtained from quadrant-based measurements, values from the superior, nasal, inferior, and temporal quadrants were averaged to generate a single anatomical index for each eye.
6. Reproducible statistical analysis workflow
Package deployment and environment initialization
All computational and statistical analyses were performed in the R environment (version 4.5.1). The analytical workflow incorporated the tidyverse suite, including the ggplot2 package for data visualization, the stats package for statistical modeling, and the factoextra package for principal component analysis visualization. A significance level of α = 0.05 was adopted for all statistical tests.
Univariate and covariate adjustment analysis
Data distributions were assessed using the Shapiro–Wilk test. Variables exhibiting normal distributions were compared using independent two-sample t-tests assuming equal variances, whereas non-normally distributed variables were analyzed using the Mann–Whitney U test.
Multiple testing correction
To account for multiple simultaneous ultrasound biomicroscopy parameter comparisons, p-values were adjusted using the Benjamini–Hochberg false discovery rate procedure. Adjusted q-values < 0.05 were considered statistically significant.
Standardized mean differences
Standardized mean differences were calculated to assess group balance.
Multivariable logistic regression
Multivariable logistic regression models were constructed to identify independent predictors while controlling for potential confounding variables. Axial length was included as a covariate, and Wald statistics were used to evaluate predictor significance.
Multivariate coordination and pattern clustering
Pearson correlation coefficients were calculated to assess relationships among key biometric parameters. Correlation coefficients were subsequently transformed using Fisher’s z-transformation to evaluate differences in inter-parameter coordination between study groups.
Principal component analysis
Quantitative variables were standardized using the Z-score transformation prior to analysis. Principal component analysis was performed to characterize multivariate structural patterns and evaluate group separation. Variable loadings and participant projections were extracted and visualized using principal component analysis visualization tools.
Composite scoring framework
An unweighted composite ciliary block score was calculated using standardized values of simulated cilio-lenticular distance, trabecular–ciliary process angle, and lens vault. The directionality of simulated cilio-lenticular distance and trabecular–ciliary process angle was reversed such that higher values consistently reflected increased anatomical risk. The composite score was obtained by summing the aligned standardized metrics for each participant.
Results
As shown in Table 1, there were no significant differences in demographic characteristics or biometric parameters between the MG and control groups. Crucially, the Standardized Mean Difference (SMD) for essential baseline covariates, such as axial length (AL) (SMD = 0.232) and age (SMD = 0.298), was well below the 0.3 threshold, establishing robust balance in these measured baseline variables between the cohorts. However, significant anatomical differences were observed in the UBM parameters (Figure 1). The MG group presented significantly decreased sCLD (unadjusted P < 0.001, SMD = 2.364), increased LV (unadjusted P < 0.001, SMD = 1.596), shallower ACD (unadjusted P = 0.0007, SMD = 1.050), and smaller TCPA (unadjusted P = 0.0037, SMD = 0.882). For multiple comparisons of UBM parameters, a False Discovery Rate (FDR) correction was applied, and the significance of sCLD, LV, ACD, and TCPA remained stable (all adjusted P < 0.05). The SMD values for all these parameters exceeded the threshold of 0.8, indicating large effect sizes and clinically meaningful differences between groups.
To rigorously account for parameter interdependence and isolate independent anatomical predictors, multivariable logistic regression modeling adjusting for baseline AL was performed (Table 2). The independent statistical significance of a shortened sCLD (P < 0.001), an increased LV (P < 0.001), and a narrowed TCPA (adjusted P = 0.0099) remained highly robust, demonstrating that these localized configurations are associated with MG development independently after statistical adjustment for axial length. Consequently, AL was included along with sCLD, LV, ACD, and TCPA in subsequent analyses to observe interrelationships.
To assess intergroup differences in ocular parameter coordination, correlation analyses were performed. Although none of these correlation differences reached statistical significance after FDR correction for multiple comparisons (all adjusted P > 0.05), a consistent trend of weakened correlations was observed in the MG group. Notable changes included: AL-ACD (control r = 0.718 vs. MG r = 0.334; r = -0.384); TCPA-LV (control r = -0.609 vs. MG r = -0.245; r = +0.364); TCPA-AL (control r = 0.531 vs. MG r = 0.289; r = -0.242); and sCLD-TCPA (control r = 0.224 vs. MG r = 0.017; r = -0.207). Scatter plots (Figure 2) visually confirmed this structural discoordination, showing greater data dispersion in the MG group, indicating a trend of preoperative weakening of physiological coupling among key ocular parameters in eyes that subsequently developed MG.
PCA was employed as an exploratory tool to identify multivariate anatomical patterns. The first two principal components (PCs) accounted for 79.0% of the total variance (PC1: 62.2%; PC2: 16.8%). PC1, which accounted for the largest proportion of variance (62.2%), was characterized by high negative loadings from LV and positive loadings from ACD and sCLD, suggesting a pattern interpretable as anterior segment crowding. PC2 was primarily defined by AL (loading = 0.741). The score plot (Figure 3A) demonstrated that the MG group clustered significantly toward the negative end of PC1 (t = 5.563, P < 0.001, Cohen’s d = 1.606) and exhibited higher scores on PC2 (t = -2.706, P = 0.010, Cohen’s d = 0.781) compared to controls. The loading plot (Figure 3B) visually illustrates the opposing contributions of LV, ACD, and sCLD to PC1. Overall, exploratory principal component analysis supported a dominant pattern of anterior segment crowding configuration in this malignant glaucoma cohort, characterized by a synergistic pattern of elevated LV with reduced ACD and sCLD.
Based on the hypothesized ciliary block mechanism and the anatomical patterns revealed by PCA, three exploratory composite risk scores were constructed. The ciliary block score integrates the risk values of sCLD, TCPA, and LV, reflecting the spatial relationship between the ciliary body and lens, representing a hypothesized anatomical risk substrate rather than a proven causal mechanism. The anterior segment crowding score combines the risk values of the sCLD, LV, and ACD, reflecting the configuration feature of anterior segment space crowding. The comprehensive risk score was the sum of the risk values of all five parameters (sCLD, TCPA, LV, ACD, and AL). Compared with the comprehensive risk score (Cohen’s d = 1.525) and the anterior segment crowding score (Cohen’s d = 1.856), the ciliary block score demonstrated the largest effect size (Cohen’s d = 1.995, P < 0.001) for group separation in this cohort. It is emphasized that these composite scores are sample-specific, unweighted exploratory constructs derived from z-scores and explicitly lack external clinical validation. These differential effect sizes were visually corroborated by the parallel coordinates plot (Figure 4), which visualized the multidimensional profiles of individual eyes across the five standardized parameters. The trajectories of the MG group (orange lines) consistently exhibited a pattern of elevated LV coupled with reduced ACD, TCPA, and sCLD, graphically illustrating the strong effects captured by both the ciliary block and anterior segment crowding scores. In contrast, the weaker discriminative power of the comprehensive risk score aligns with the less distinct separation in axial length observed between the groups in the plot.
In a highly exploratory, post-hoc analysis, five extreme high-risk cases with the highest ciliary block scores from the MG group were selected and compared with five control cases exhibiting the lowest scores. As detailed in Table 3, all high-risk MG cases demonstrated characteristic ciliary body-lens crowding, featuring shortened sCLD (-0.199 to -0.095 mm), narrowed TCPA (34.1–42.4°), and elevated LV (0.98–1.35 mm), contrasting sharply with normal parameters in low-risk controls. Analysis of these extreme cases revealed potential anatomical phenotypes (Table 3), predominantly categorized as a lens anterior displacement dominant pattern (n = 4), which was characterized by markedly elevated LV (1.33 mm ± 0.03 mm) serving as the main risk driver, alongside a single unique case (n = 1) exhibiting an extreme ciliary body proximity pattern. Across all five extreme high-risk cases, the revised overall composite score was 4.20 ± 0.79. Because this subgroup is too small to support broader phenotype claims, any conclusions drawn from this 5-case extreme subset remain highly provisional and strictly localized to this sample.
Using a computer-based randomization procedure, UBM images from 10 patients were randomly selected without replacement from the total study cohort via simple random sampling. To ensure randomization of the measured quadrants, this study independently assigned a random measurement quadrant for CBT0, CBT1000, CBTmax, APCB, TCA, and sCLD. Following a dual-stratified framework, global ocular metrics for general inter-group comparisons were derived by averaging measurements acquired across all four anatomical quadrants, whereas for the reliability analysis, a single quadrant was randomly allocated. An experienced glaucoma specialist, blinded to patient group assignment and initial measurement results, performed repeated measurements on the selected images. As shown in Table 4, the evaluated parameters included ACD, CCD, LV, CBT0 in the nasal quadrant (CBT0N), CBT1000 in the inferior quadrant (CBT1000I), CBTmax in the inferior quadrant (CBTmaxI), APCB in the inferior quadrant (APCBI), TCPA in the temporal quadrant (TCPAT), and sCLD in the temporal quadrant (sCLDT). The ICC values for all the parameters were above 0.90, demonstrating excellent interobserver reliability and reproducibility of the measurement protocol.
In summary, preoperative metrics indicate that eyes exhibiting an association with post-surgical malignant glaucoma possess distinct morphological profiles characterized by an independent cluster of narrow ciliary-lenticular space (sCLD), elevated lens protrusion (LV), and a compressed ciliary complex (TCPA), accompanied by an exploratory trend of structural discoordination among biometric variables.
DATA AVAILABILITY:
The fully de-identified raw datasets are provided in Supplementary File 1.
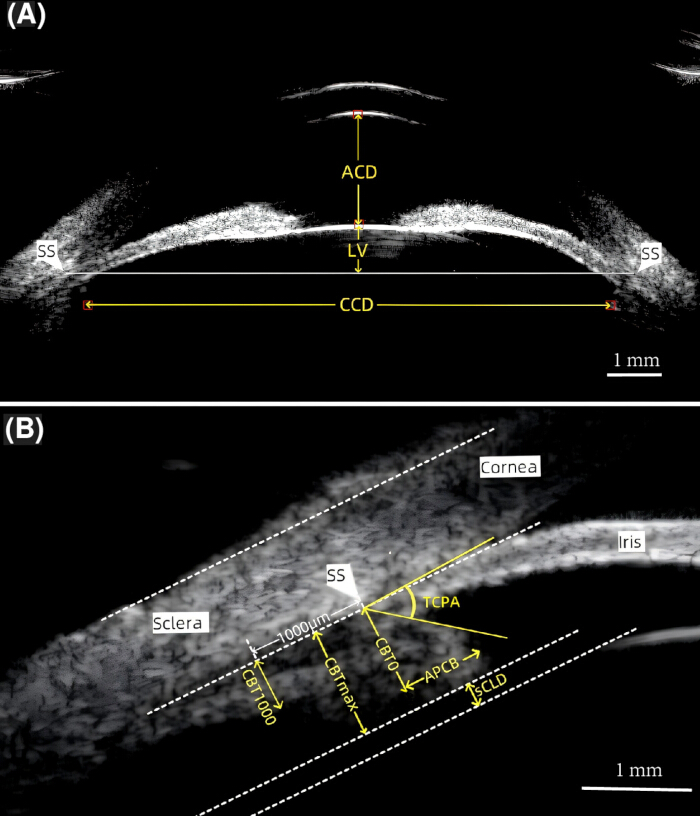
Figure 1: UBM measurement parameters of the anterior segment. (A) illustrates the measurements of anterior chamber depth (ACD), lens vault (LV), and ciliary process-ciliary process distance (CCD) on a representative horizontal panoramic scan matrix. (B) quantifies various localized ciliary body parameters, including ciliary body thickness at the scleral spur (CBT0), maximum ciliary body thickness (CBTmax), ciliary body thickness 1000 m posterior to the scleral spur (CBT1000), anterior placement of the ciliary body (APCB), trabecular-ciliary process angle (TCPA), and simulated cilio-lenticular distance (sCLD) on a representative radial quadrant scan recess. Scale bar = 1 mm. ACD, anterior chamber depth; LV, lens vault; CCD, ciliary process-ciliary process distance; CBT0, ciliary body thickness at the scleral spur; CBTmax, maximum ciliary body thickness; CBT1000, ciliary body thickness 1000 m posterior to the scleral spur; APCB, anterior placement of ciliary body; TCPA, trabecular-ciliary process angle; sCLD, simulated cilio-lenticular distance; SS, scleral spur. Scale bars: 1 mm. Please click here to view a larger version of this figure.
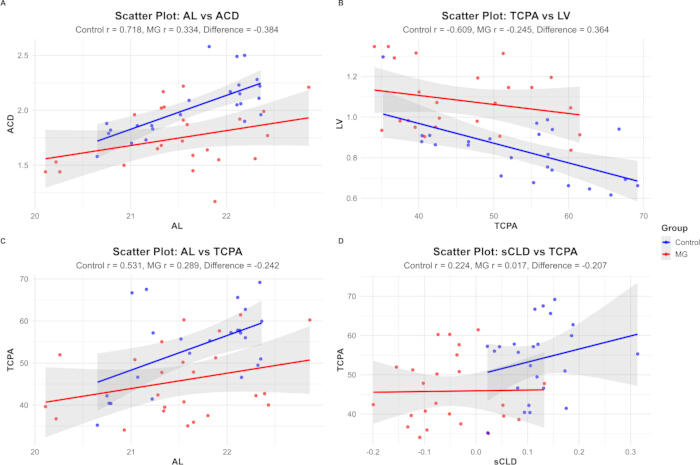
Figure 2: Comparison of correlation patterns between the MG and control groups for key ocular parameter pairs. Scatter plots illustrate the linear relationships between selected ocular parameters with fitted regression lines and 95% confidence intervals: (A) AL vs. ACD, (B) TCPA vs. LV, (C) AL vs. TCPA, and (D) sCLD vs. TCPA. Control group data (blue) demonstrated correlation coefficients of r = 0.718, –0.609, 0.531, and 0.224 for panels A–D, respectively, whereas the MG group (red) showed corresponding r values of 0.334, –0.245, 0.289, and 0.017. The between-group differences in correlation coefficients (Δr = –0.207 to –0.385) suggest altered inter-parameter associations in MG eyes. MG, malignant glaucoma; AL, axial length; ACD, anterior chamber depth; TCPA, trabecular-ciliary process angle; LV, lens vault; sCLD, simulated cilio-lenticular distance. Please click here to view a larger version of this figure.
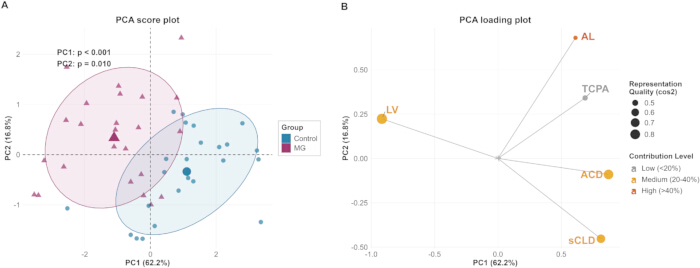
Figure 3: Principal component analysis of ocular parameters in PACG patients with postoperative malignant glaucoma. (A) PCA score plot showing the distribution of MG (purple) and control (blue) groups in the principal component space. The MG group was significantly distributed toward the negative region of PC1 (p < 0.001) and showed significantly higher scores on PC2 (p = 0.010) compared to controls. (B) PCA loading plot illustrating the contributions of key ocular parameters to the first two principal components. Point size indicates representation quality (cos2), and color denotes contribution level (gray: <20%; orange: 20-40%; dark orange: >40%). PC1 and PC2 collectively explain 79.0% of total variance (PC1: 62.2%; PC2: 16.8%), with PC1 reflecting anterior segment crowding and PC2 primarily associated with axial length variation. MG, malignant glaucoma; LV, lens vault; ACD, anterior chamber depth; sCLD, simulated cilio-lenticular distance; TCPA, trabecular-ciliary process angle; AL, axial length. Please click here to view a larger version of this figure.
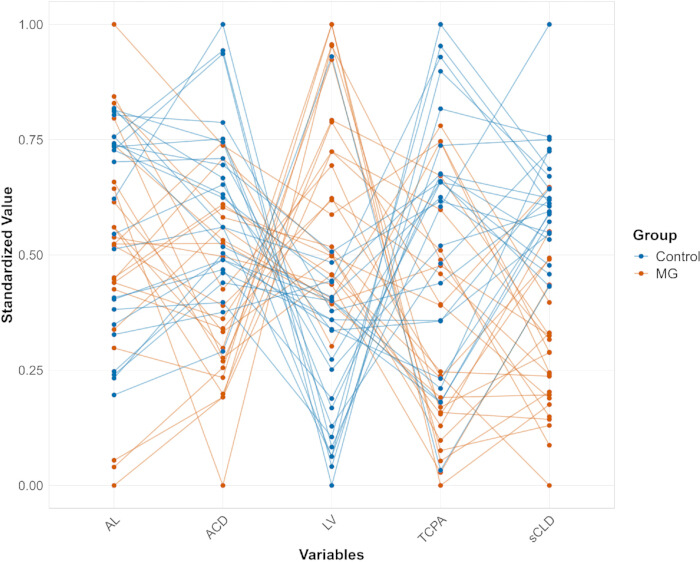
Figure 4: Parallel coordinates plot showcasing multidimensional ocular profiles. This chart visualizes the comprehensive geometric trajectories of individual eyes from the Control (blue lines, n=24) and Malignant Glaucoma (MG, orange lines, n = 24) cohorts across five biometric parameters (AL, ACD, LV, TCPA, and sCLD). Crucially, the "Standardized Value" on the Y-axis represents the sample-specific min-max scaled values [0, 1] derived directly from standardized z-scores to eliminate scale-dependent variance. The trajectories graphically demonstrate that the pre-surgical risk substrate of the MG group is fundamentally characterized by an independent cluster of elevated LV tightly coupled with compressed axial, angular, and cilio-lenticular spaces. Please click here to view a larger version of this figure.
| Characteristic | Control (n=24) | Malignant Glaucoma (n=24) | P-value | SMD |
| Age, years (Median [IQR]) | 65.00 [60.00, 69.00] | 61.00 [54.75, 66.00] | 0.0984 | 0.298 |
| Sex, female, n (%) | 19 (79.2%) | 22 (91.7%) | 0.4158 | 0.36 |
| Eye, OD, n (%) | 12 (50.0%) | 15 (62.5%) | 0.5612 | 0.254 |
| PAS, <180°, n (%) | 11 (45.8%) | 9 (37.5%) | 0.7702 | 0.17 |
| IOP, mmHg (Mean ± SD) | 24.14 ± 4.90 | 24.46 ± 4.87 | 0.8189 | 0.066 |
| AL, mm (Mean ± SD) | 21.67 ± 0.61 | 21.52 ± 0.69 | 0.4257 | 0.232 |
| ACD, mm (Mean ± SD) | 2.03 ± 0.26 | 1.75 ± 0.28 | <0.001 | 1.05 |
Table 1: Baseline characteristics of study participants. Data are presented as mean ± standard deviation, median (interquartile range), or number (percentage) as appropriate. P-values were calculated using Student’s t-test for normally distributed continuous variables, Mann-Whitney U test for non-normally distributed continuous variables, and Chi-square test or Fisher’s exact test for categorical variables. To account for multiple comparisons across the 15 baseline characteristics, Benjamini-Hochberg false discovery rate (FDR) correction was applied to the raw P-values; adjusted P-values are reported in the “P. adjust” column, with P < 0.05 considered statistically significant. SMD, standardized mean difference; OD, oculus dexter (right eye); PAS, peripheral anterior synechiae; AL, axial length; IOP, intraocular pressure; ACD, anterior chamber depth; CBT0, ciliary body thickness at the scleral spur; CBTmax, maximum ciliary body thickness; CBT1000, ciliary body thickness 1000 µm posterior to the scleral spur; APCB, anterior placement of ciliary body; TCPA, trabecular-ciliary process angle; sCLD, simulated cilio-lenticular distance; LV, lens vault; CCD, ciliary process-ciliary process distance. Significant differences (P. adjust < 0.05, SMD > 0.8) were observed in ACD, TCPA, sCLD, and LV between groups.
| Parameter | Control (n=24) | Malignant Glaucoma (n=24) | Unadjusted P-value | Adjusted P-value (vs AL) |
| LV, mm | 0.834 ± 0.151 | 1.081 ± 0.158 | <0.001 | <0.001 |
| CCD, mm | 9.474 ± 0.316 | 9.612 ± 0.310 | 0.1344 | 0.0877 |
| CBT0, mm | 0.851 ± 0.078 | 0.854 ± 0.089 | 0.9002 | 0.7691 |
| CBTmax, mm | 0.938 ± 0.089 | 0.926 ± 0.089 | 0.6516 | 0.7637 |
| CBT1000, mm | 0.464 ± 0.082 | 0.471 ± 0.067 | 0.7494 | 0.5807 |
| APCB, mm | 0.629 ± 0.195 | 0.631 ± 0.133 | 0.9636 | 0.8426 |
| TCPA, ° | 53.822 ± 9.442 | 45.824 ± 8.685 | 0.0037 | 0.0099 |
| sCLD, mm | 0.118 ± 0.063 | -0.052 ± 0.080 | <0.001 | <0.001 |
| LV/ACD | 0.422 ± 0.120 | 0.645 ± 0.192 | <0.001 | <0.001 |
| ACD/AL | 0.094 ± 0.010 | 0.081 ± 0.012 | <0.001 | 0.0039 |
Table 2: Two-Sample t-test and multivariable logistic regression analysis of preoperative Ultrasound Biomicroscopy (UBM) parameters. This table presents the unadjusted baseline comparisons alongside the independent statistical parameters derived after multivariable adjustment for axial length (AL). Data are presented as mean ± standard deviation. sCLD, simulated cilio-lenticular distance; LV, lens vault; ACD, anterior chamber depth; TCPA, trabecular-ciliary process angle; CCD, ciliary process-ciliary process distance; CBT0, ciliary body thickness at the scleral spur; CBTmax, maximum ciliary body thickness; CBT1000, ciliary body thickness 1000 m posterior to the scleral spur; APCB, anterior placement of the ciliary body.
| Case ID | Risk Pattern | sCLD (mm) [Risk Score] | TCPA (°) [Risk Score] | LV (mm) [Risk Score] | Exploratory Composite Score | Dominant Risk Factors |
| MG_HighRisk_1 | 1 | -0.109 [1.27] | 34.1 [1.60] | 1.35 [1.98] | 4.85 | LV risk (1.98) + TCPA risk (1.60) |
| MG_HighRisk_2 | 1 | -0.095 [1.15] | 35.9 [1.41] | 1.35 [1.98] | 4.54 | LV risk (1.98) + TCPA risk (1.41) |
| MG_HighRisk_3 | 1 | -0.132 [1.48] | 36.7 [1.33] | 1.29 [1.69] | 4.51 | LV risk (1.69) + sCLD risk (1.48) |
| MG_HighRisk_4 | 1 | -0.126 [1.42] | 39.6 [1.04] | 1.32 [1.82] | 4.27 | LV risk (1.82) + sCLD risk (1.42) |
| MG_HighRisk_5 | 2 | -0.142 [1.56] | 42.4 [0.78] | 0.98 [0.49] | 2.83 | sCLD risk (1.56) + TCPA risk (0.78) |
| Mean ± SD | — | -0.121 ± 0.019 | 37.7 ± 3.4 | 1.26 ± 0.16 | 4.20 ± 0.79 | (Overall Profile) |
Table 3: Comparative analysis of anatomical parameters and standardized risk scores in extreme high-risk and low-risk cases. This table presents a comprehensive comparison of anatomical parameters and standardized risk scores for extreme cases from the MG (high-risk) and control (low-risk) groups. Values in brackets represent standardized risk scores, calculated by Z-score transformation with direction adjustment so that positive values indicate higher MG risk. The Ciliary Block Score is the sum of sCLD, TCPA, and LV risk scores. Note the consistent pattern: high-risk cases show positive risk scores and abnormal anatomical parameters (negative sCLD, narrow TCPA, elevated LV), while low-risk controls show negative risk scores and normal anatomical parameters. MG, malignant glaucoma; sCLD, simulated cilio-lenticular distance; TCPA, trabecular-ciliary process angle; LV, lens vault.
| Parameter | ICC | Mean 1 | Mean 2 | Difference | 95% CI of Difference |
| ACD | 0.977 | 2.063 | 2.019 | 0.044 | (0.013, 0.075) |
| CCD | 0.908 | 9.845 | 9.763 | 0.082 | (-0.010, 0.175) |
| LV | 0.969 | 0.89 | 0.874 | 0.016 | (-0.020, 0.052) |
| CBT0N | 0.93 | 0.808 | 0.8 | 0.008 | (-0.006, 0.022) |
| CBT1000I | 0.96 | 0.515 | 0.523 | -0.008 | (-0.027, 0.011) |
| CBTmaxI | 0.946 | 0.933 | 0.954 | -0.021 | (-0.052, 0.010) |
| APCBI | 0.959 | 0.695 | 0.685 | 0.01 | (-0.043, 0.062) |
| TCPAT | 0.992 | 52.163 | 50.886 | 1.277 | (0.512, 2.042) |
| sCLDT | 0.974 | 0.098 | 0.094 | 0.004 | (-0.013, 0.021) |
Table 4: Interobserver reliability of parameters measured by UBM. ICC values > 0.90 are considered to represent excellent reliability. Mean 1 and Mean 2 represent the average values from the first and second observers, respectively. Difference represents the mean difference between observers (Mean 1 – Mean 2). ICC, intraclass correlation coefficient; CI, confidence interval; ACD, anterior chamber depth; CCD, ciliary process-ciliary process distance; LV, lens vault; CBT0N, ciliary body thickness at the scleral spur in the nasal quadrant; CBT1000I, ciliary body thickness at 1000 µm from the scleral spur in the inferior quadrant; CBTmaxI, maximum ciliary body thickness in the inferior quadrant; APCBI, anterior placement of the ciliary body in the inferior quadrant; TCPAT, trabecular-ciliary process angle in the temporal quadrant; sCLDT, simulated cilio-lenticular distance in the temporal quadrant; UBM, ultrasound biomicroscopy.
Supplementary File 1: The fully de-identified raw datasets. Please click here to download this file.
Discussion
Malignant glaucoma (MG) remains a highly challenging clinical problem in diagnosis and treatment, and improving its identification is crucial for preserving patients’ visual function. Although ciliary block is traditionally considered the key mechanism leading to aqueous misdirection, as documented across modern literature11,12,17, reliable preoperative predictive indicators have remained elusive. This study provides clinical insights for a clearer deconstruction of the pathological mechanisms driving MG. Crucially, the interobserver reliability assessment offers robust validation for the repeatability and stability of the ultrasound biomicroscopy (UBM) parameter metrics, which are heavily determined by strict procedural execution.
This study revealed that sCLD was the single parameter with the largest effect size distinguishing the MG group from the control group (SMD = 2.364), and the mean sCLD in the MG group was negative. This finding is consistent with the report by Liu et al.12. However, the CCD, which represents the original diameter of the ciliary ring, was not significantly different between the two groups, suggesting that the occurrence of MG might be attributed primarily to acquired, functional factors rather than congenital ciliary ring narrowing. A plausible pathophysiological sequence is that increased vitreous cavity pressure promotes anterior lens displacement (manifested as increased LV), leading to functional narrowing of the ciliary body-lens space (sCLD) and potentially causing anterior rotation of the compressed ciliary body (manifested as decreased TCPA). Heindl et al.6 also observed anterior rotation of the ciliary body in MG eyes via UBM. This study further supports this view through multidimensional analysis and identifies the sCLD, LV, and TCPA as key anatomical elements associated with ciliary block. Unlike generalized congenital crowding, including reduced CCD, which is found in nanophthalmos by Guo et al.8, this study suggests that in the general PACG population, the risk of postoperative MG may primarily stem from dynamic, functional ciliary block (as indicated by the ciliary block score) and anterior segment crowding (supported by exploratory principal component analysis results) characterized by anterior lens displacement and ciliary body–lens space narrowing rather than widespread congenital structural abnormalities. To contextualize these findings within real-world clinical data, this mechanism matches historical structural characteristics observed in regional Chinese patients presenting with aqueous misdirection syndrome18. Imaging studies of established MG eyes by Wang et al.10 also revealed extreme narrowing of the TCPA, which can be viewed as the end-stage manifestation of MG. These findings collectively reinforce the importance of the sCLD, LV, and TCPA in the multidimensional anatomical basis of MG. Therefore, preoperative assessment should extend beyond the observation of static anatomical parameters alone and focus on indicators such as sCLD that more directly reflect the relative spatial relationship between the ciliary body and lens, as it may more sensitively indicate the anatomical predisposition for postoperative ciliary block6,14.
On the basis of the above findings, three exploratory composite risk scores were constructed to evaluate the utility of integrating multiparameter information. The results showed that, although principal component analysis identified “anterior segment crowding” as the most prominent macro-anatomical pattern, the ciliary block score, constructed based on its mechanistic basis and integrating sCLD, TCPA, and LV risk parameters, exhibited the strongest intergroup discriminative ability (Cohen’s d = 1.995) in this cohort. This finding suggests that integrating these specific parameters may be a promising approach worthy of further investigation. This finding reveals a multi-level construct of anatomical risk in malignant glaucoma: while “anterior segment crowding” represents the macro level end phenotype of the disease, “ciliary block” acts as a hypothesized core pathological engine that drives this phenotype and demonstrates greater discriminative power statistically in this sample. This indicates that in PACG patients, focusing on the local anatomical relationship at the ciliary body–lens interface holds higher specificity and mechanistic relevance for identifying eyes at high risk of postoperative MG than parameters reflecting global eyeball structure. This conclusion aligns with the view of Gong et al.19, who emphasized the central value of UBM parameters in predicting surgical outcomes, and further quantitatively establishes the priority of ciliary body–related parameters in risk stratification in this exploratory analysis.
Based on the five extremely high-risk cases, an exploratory classification of potential anatomical subtypes of MG was proposed, suggesting that even among definite MG patients, the dominant mechanism of anterior segment crowding might differ: the majority of cases (4/5) exhibited a lens anterior displacement dominant pattern (characterized by significantly elevated LVs), whereas one unique case exhibited an extreme ciliary body proximity pattern (core feature with extremely low sCLD and relatively unremarkable LV). This proposed classification is hypothetical and derived from a very small subset, but it may provide a framework for future studies to investigate pathophysiological heterogeneity in MG. Wang et al.10 demonstrated that MG eyes generally have thinner and more anteriorly rotated ciliary bodies, correlating with the LV, supporting a mixed mechanism where lens and ciliary body abnormalities coexist, whereas Qin et al.20 reported that reduced CBTmax is an independent preexisting risk factor, providing a basis for the existence of a distinct subtype dominated by ciliary body weakness. The unique case identified in this study, with extremely low sCLD but not high LV, might precisely represent the spatial manifestation of this ciliary body weakness dominant subtype. Furthermore, clinically, some MG patients respond to laser iridotomy, while most require vitrectomy21, and even the same patient’s two eyes may respond differently to medication and surgery22. This heterogeneity in treatment response also indirectly suggests the possible existence of different anatomical subtypes underlying it. The literature reports support this view: approximately 50% of MG patients can be cured with medication alone23; for pseudophakic or aphakic patients, Nd: YAG laser capsulotomy and anterior hyaloid face disruption analyzed via early clinical imagery are often effective24,25; and for refractory cases, vitrectomy, particularly thorough removal of the anterior vitreous, can lead to resolution in 83%-98% of pseudophakic patients26,27. This spectrum of treatment responses from medication, laser, to surgery strongly suggests that MG exists on a disease spectrum with anatomical subtypes ranging from functional ciliary block to structural severe crowding.
This study, through correlation difference analysis, revealed important trend-level differences in the coordination of ocular parameters between the MG and control groups. Although these differences did not reach statistical significance, potentially limited by the sample size, the observed patterns hold significant clinical implications. The normally strong positive correlation between AL and ACD was markedly weakened in the MG group (r = 0.334 vs. 0.718), while the negative correlation between TCPA and LV was also significantly reduced. This loss of structural coordination suggests that the anterior segment configuration in eyes that developed MG may deviate from normal physiological patterns, where the localized abnormal anterior displacement of the lens-ciliary body complex might override the dominant influence of overall eyeball size on anterior chamber structure. This study confirmed a positive correlation between TCPA and AL in the control group (r = 0.531), consistent with previous research9. Integrating reported choroidal vascular indexes and biometric characteristics in MG patients28, the hypothesis is raised that structural abnormalities in the posterior segment may disrupt the hydrodynamic balance of the anterior segment by altering pressure–volume relationships, thereby exacerbating the loss of inter-parameter coordination. This finding provides a new perspective for understanding the preoperative anatomical risk factors of MG.
To bridge the experimental methodology directly to these phenotypic findings, the specific procedural steps that most influence successful data acquisition must be evaluated. Methodological optimization and troubleshooting rely on two critical parameters: the absolute preservation of supine patient fixation under mesopic baselines to eliminate accommodative fluctuations, and the absolute avoidance of corneal indentation during immersion eye-cup placement, which artificially introduces an under-calculated lens vault or false shallowing. Compared to alternative non-contact approaches such as anterior segment optical coherence tomography (AS-OCT), this UBM protocol provides the distinct advantage of directly visualizing retro-iridial architectures, including the ciliary body apices and the posterior chamber, which are fundamentally occluded by the pigment epithelium during AS-OCT infrared capture. Furthermore, as demonstrated in existing comparative controlled clinical literature between PEI-GSL and traditional filtering interventions2, while removing the cataractous lens mechanical structure mitigates macrolevel filtering issues like late bleb infection or hypotony, it fundamentally alters anterior segment volume dynamics, necessitating this exact targeted UBM assessment protocol.
Future applications of this digital multiparameter framework encompass its translation into automated, deep-learning-driven anatomical boundary detection models to achieve rapid, clinic-ready risk stratification before decompression maneuvers. The usability, implementation considerations, and exceptional measurement reliability reflected in the high intraclass correlation coefficients (ICCs > 0.90) establish this workflow as a highly stable, structurally rigorous blueprint for prospective multi-center validations.
This study has several important limitations. First, the relatively small sample size (n = 48) limits statistical power, increases the risk of overfitting in multivariate analyses such as PCA and composite score construction, and prevents meaningful subgroup investigations. Second, the retrospective design introduces the possibility of selection bias. Third, while UBM measurements demonstrated high reliability, they remain susceptible to inherent systematic errors24 and inter-observer variability. Finally, the analysis was confined to anterior segment parameters. Potential contributions from posterior segment structures, such as vitreous status, choroidal thickness, or scleral properties, or systemic factors like hypertension, which may also influence MG risk, were not evaluated. Future studies incorporating a broader range of anatomical and clinical variables are warranted.
In conclusion, this study identified that a shortened sCLD, increased LV, and narrowed TCPA constitute key preoperative factors associated with MG after PACG surgery, suggestive of functional ciliary block. PCA confirmed that “anterior segment crowding”, defined by the variation of LV, ACD, and sCLD, represents the macroscopic anatomical pattern distinguishing MG patients in this cohort. Although not statistically significant, a preoperative trend of “structural discoordination” was observed in MG eyes, potentially offering new insights into the disease’s pathogenesis. The validity and generalizability of these findings remain to be validated in future large-scale prospective studies.
Disclosures
The authors declare no competing interests.
Materials
| Name | Company | Catalog Number | Comments |
|---|---|---|---|
| Automated Optical Biometer | Carl Zeiss Meditec AG | IOLMaster 500 | Partial coherence interferometry ocular axial length biometry device |
| Bromfenac Sodium Drops | Bausch & Lomb Inc. | Prolensa 0.07% | Topical non-steroidal anti-inflammatory ophthalmic eye drops |
| Disposable Immersion Eye Cup | Tianjin Suowei Electronic Technology Co., Ltd. | SEC-140 | Sterile plastic shell coupling sleeve for contact high-frequency UBM scanning |
| effsize Package | CRAN Repository | Version 0.8.1 | R package for calculating Standardized Mean Differences and Cohen’s d |
| factoextra Package | CRAN Repository | Version 1.0.7 | Specialized R toolkit for principal component matrix visualization |
| ggplot2 Package | Posit, PBC (CRAN) | Version 3.5.0 | High-performance R data package for advanced scatter plotting |
| Goniosynechialysis Spatula | Katena Products, Inc. | K3-2520 | Specialized microsurgical spatula for posterior mechanical iris dissection |
| Hydrophobic Acrylic IOL | Alcon Laboratories, Inc. | AcrySof IQ SN60WF | Foldable single-piece hydrophobic acrylic intraocular lens |
| ImageJ Software | National Institutes of Health | Version 1.54h | Open-source Java-based image processing and multi-parameter calibration tool |
| Methylcellulose Gel | Novartis AG | OcuCoat 2% | 1% ophthalmic clear viscoelastic gel serving as acoustic coupling medium |
| Phacoemulsification Knife | BD Medical - Ophthalmic Systems | 372222 | 2.2 mm calibrated clear corneal tunnel slit incision blade |
| Phacoemulsification System | Alcon Laboratories, Inc. | Centurion Vision System | Microsurgical cataract extraction platform with low-energy ultrasound parameters |
| Pilocarpine Hydrochloride Drops | Novartis AG | Isopto Carpine 0.5% | 0.5% topical miotic parasympathomimetic iris diaphragm stabilizer |
| Proparacaine Hydrochloride | Alcon Laboratories, Inc. | NDC 0065-0251-15 | 0.5% topical ophthalmic anesthetic drops for surface desensitization |
| psych Package | CRAN Repository | Version 2.4.3 | R suite for executing Fisher's z-transformation correlation testing |
| R Statistical Environment | R Foundation for Statistical Computing | Version 4.5.1 | Computational language engine for multivariate modeling and data scaling |
| Side-Port Knife | BD Medical - Ophthalmic Systems | 371015 | 1.0 mm side-port paracentesis angled incision blade |
| Sodium Hyaluronate | Bausch & Lomb Inc. | Amvisc Plus 1.6% | Cohesive viscoelastic agent for anterior chamber deepening and stabilization |
| Spectral-Domain OCT | Heidelberg Engineering GmbH | Spectralis HRA+OCT | Optical coherence tomography scanner for retinal nerve fiber layer screening |
| tidyverse Package Suite | Posit, PBC (CRAN) | Version 2.0.0 | R package matrix for data manipulation and advanced functional piping |
| Tobramycin-Dexamethasone Drops | Alcon Laboratories, Inc. | TobraDex 5mL | Combined topical post-surgical anti-inflammatory steroid eye drops |
| Tobramycin-Dexamethasone Ointment | Alcon Laboratories, Inc. | TobraDex Sterile | Combined antibiotic-corticosteroid post-surgical ophthalmic ointment |
| Ultrasound Biomicroscopy System | Tianjin Suowei Electronic Technology Co., Ltd. | SW-3200L | High-frequency digital 50 MHz anterior segment acoustic imaging scanner |
References
- Tham YC, et al. Global prevalence of glaucoma and projections of glaucoma burden through 2040: a systematic review and meta-analysis. Ophthalmology. 2014;121(11):2081-2090.
- Qiao C, et al. Phacoemulsification with intraocular lens implantation and goniosynechialysis versus trabeculectomy for patients with primary angle-closure glaucoma: a randomized controlled trial. BMC Ophthalmol. 2020;20(1):432.
- Balekudaru S, et al. Clinical associations for the development of malignant glaucoma following intraocular surgery. Indian J Ophthalmol. 2025;73(Suppl 2):S240-243.
- Zhang Y, et al. Ocular characteristics of pseudophakic eyes with malignant glaucoma. Ophthalmic Res. 2023;66(1):1159-1168.
- Gunay M, et al. Malignant glaucoma following gonioscopy-assisted transluminal trabeculotomy. J Glaucoma. 2025;34(8):e56-59.
- Heindl LM, et al. Optical coherence tomography and ultrasound biomicroscopy in the management of pseudophakic malignant glaucoma. Graefes Arch Clin Exp Ophthalmol. 2013;251(10):2261-2263.
- Fernández-Vigo JI, et al. Diagnostic imaging of the ciliary body: technologies, outcomes, and future perspectives. Eur J Ophthalmol. 2022;32(1):75-88.
- Guo C, et al. Anterior segment features in nanophthalmos with secondary chronic angle-closure glaucoma: an ultrasound biomicroscopy study. Invest Ophthalmol Vis Sci. 2019;60(6):2248-2256.
- Xu Y, et al. The ocular biometry characteristics of young patients with primary angle-closure glaucoma. BMC Ophthalmol. 2022;22(1):150.
- Wang Z, et al. Quantitative measurements of the ciliary body in eyes with malignant glaucoma after trabeculectomy using ultrasound biomicroscopy. Ophthalmology. 2014;121(4):862-869.
- Dave P, et al. Treatment outcomes in malignant glaucoma. Ophthalmology. 2013;120(5):984-990.
- Liu X, et al. Novel predictors for malignant glaucoma in primary angle-closure glaucoma patients. Acta Ophthalmol. 2025;103(6):e401-410.
- Krix-Jachym K, et al. Risk factors for malignant glaucoma occurrence after glaucoma surgery. J Ophthalmol. 2017;2017:9616738.
- Jin SW, et al. Long-term treatment outcomes for malignant glaucoma. Ophthalmol Glaucoma. 2024;7(3):282-289.
- Quigley HA, et al. Possible mechanisms of primary angle-closure and malignant glaucoma. J Glaucoma. 2003;12(2):167-180.
- Warjri GB, et al. Imaging of the ciliary body: a major review. Semin Ophthalmol. 2022;37(6):711-723.
- Shahid H, et al. Malignant glaucoma: a review of the modern literature. J Ophthalmol. 2012;2012:852659.
- Zhou C, et al. Clinical analysis of 50 Chinese patients with aqueous misdirection syndrome: a retrospective hospital-based study. J Int Med Res. 2012;40(4):1568-1579.
- Gong H, et al. Ultrasound biomicroscopy might predict the outcome of phacoemulsification-viscodissection in medically controlled primary angle-closure glaucoma eyes with extensive peripheral anterior synechia. Front Med (Lausanne). 2021;8:705864.
- Qin YJ, et al. Thinning of maximum ciliary body thickness: a potential early indicator for pseudophakic malignant glaucoma in primary angle-closure glaucoma. BMC Ophthalmol. 2025;25(1):250.
- Lincke JB, et al. Treatment of pseudophakic aqueous misdirection syndrome. Sci Rep. 2025;15(1):1415.
- Hoshiwara I. Bilateral malignant glaucoma. Case report of simultaneous malignant glaucoma occurring three years after glaucoma surgery. Arch Ophthalmol. 1964;72(5):601-603.
- Sadeghi R, et al. Management of malignant glaucoma. J Curr Ophthalmol. 2023;34(4):389-397.
- Tello C, et al. Ultrasound biomicroscopy in pseudophakic malignant glaucoma. Ophthalmology. 1993;100(9):1330-1334.
- Little BC. Treatment of aphakic malignant glaucoma using Nd:YAG laser posterior capsulotomy. Br J Ophthalmol. 1994;78(6):499-501.
- Unterlauft JD, et al. Therapie des malignen Glaukoms [Therapy of malignant glaucoma]. Ophthalmologie. 2022;119(11):1155-1159.
- Sellam A, et al. Evaluation of the efficacy and safety of pars plana vitrectomy with irido-zonulo-hyaloidotomy for malignant glaucoma. J Fr Ophtalmol. 2024;47(1):103963.
- Zuo C, et al. Associations between the choroidal vascularity index and malignant glaucoma after trabeculectomy for primary angle-closure glaucoma. Front Med (Lausanne). 2021;8:747720.