This study utilized network pharmacology, molecular docking, and bio-layer interferometry-liquid chromatography-mass spectrometry (BLI-LC-MS) techniques to investigate the mechanism of licorice total flavonoids (LTF) in inhibiting liver fibrosis. In vitro experiments revealed that LTF can downregulate the expression of fibrosis markers, suggesting that it exerts antifibrotic effects through inhibiting TGF-β1 signaling.
Research Article
Licorice Total Flavonoids Alleviate Liver Fibrosis by Inhibiting the TGF-β1 Signaling Pathways
1Key Laboratory of Dryness Syndrome in Chinese Medicine, Ministry of Education, Ningxia Medical University, 2Ningxia Key Laboratory of Integrated Traditional Chinese and Western Medicine for Prevention and Treatment of Regional High-Incidence Diseases, Ningxia Medical University, 3Department of Hematology, General Hospital of Ningxia Medical University, 4School of Traditional Chinese Medicine, Ningxia Medical University
Opens in a new tab
In This Article
Summary
Loading...
$$\rightleftharpoonup{xx}$$
$$\longleftharp{xx}$$,
$$\longrightharp{xx}$$,
Abstract
Loading...
$$\rightleftharpoonup{xx}$$
$$\longleftharp{xx}$$,
$$\longrightharp{xx}$$,
Liver fibrosis is a reversible pathological condition caused by chronic liver injury and represents a necessary stage leading to cirrhosis and hepatocellular carcinoma. Currently, liver fibrosis lacks specifically licensed therapeutic drugs. Licorice (Glycyrrhiza uralensis Fisch.) is a multi-efficacious traditional Chinese medicine, with licorice total flavonoids (LTF) serving as its primary active components, whereas the anti-hepatic fibrosis potential of LTF remains poorly elucidated. This study analyzed the core components of LTF using network pharmacology to investigate its anti-fibrotic targets and signaling pathways. Molecular docking and liquid chromatography-mass spectrometry (LC-MS) analysis, following BLI fishing, were used to systematically examine the active components and molecular mechanisms of LTF in the treatment of liver fibrosis. Network pharmacology analysis showed that LTF exerted anti-fibrotic effects by regulating multiple targets and pathways, with the TGF-β signaling pathway acting as a key hub. In human hepatocyte-derived stellate cells (LX-2), 16, 32, and 64 µg/mL LTF inhibited transforming growth factor-β1 (TGF-β1) induced activation of LX-2 cells and reduced the mRNA and protein expression of α-smooth muscle actin (α-SMA), Collagen I, and TGF-β1. LC-MS results from high-throughput bio-layer interferometry (BLI) showed that, compared with the control group, 95 flavonoid active components in the total licorice flavonoids group could serve as candidate compounds for binding TGF-β1, a core target of liver fibrosis. These results indicated that LTF may exert anti-fibrotic effects by regulating TGF-β-related signaling pathways via inhibiting TGF-β1 expression. Moreover, BLI analysis provides a reliable and feasible strategy for elucidating the mechanisms of traditional Chinese medicine in the treatment of hepatic fibrosis.
Introduction
Loading...
$$\rightleftharpoonup{xx}$$
$$\longleftharp{xx}$$,
$$\longrightharp{xx}$$,
Hepatic fibrosis (HF) is a pathological condition caused by chronic liver injury induced by multiple factors and represents a significant global health burden. Chronic viral hepatitis, drug abuse, alcoholism, and autoimmune diseases can all trigger hepatic fibrosis1,2. Hepatic fibrosis primarily manifests as excessive proliferation and abnormal deposition of extracellular matrix (ECM) within liver tissue, leading to structural changes and impaired physiological function3. It represents a precursor stage and a critical step in the progression toward cirrhosis and hepatocellular carcinoma4. Studies have shown that early-stage liver fibrosis can be reversible5. Removal of the stimuli that cause chronic inflammation can reverse fibrosis induced by chronic hepatitis B virus (HBV) and hepatitis C virus (HCV) infections6. Therefore, early intervention can prevent the progression of fibrosis, promote its regression, and inhibit the ongoing progression of cirrhosis as well as hepatocellular carcinoma.
The development of liver fibrosis involves alterations and interactions among multiple cell types and cytokines. Transforming growth factor (TGF-β1) is the primary pro-fibrotic cytokine in the liver and promotes the activation of hepatic stellate cells (HSCs), leading to the expression of extracellular matrix components such as α-smooth muscle actin (α-SMA), collagen, and laminin7,8. These components accumulate in the intercellular space and eventually lead to liver fibrosis. HSCs are key regulatory cells in the development of liver fibrosis and have become the main target cells in current studies on the prevention and treatment of liver fibrosis4,9. Due to the complex pathophysiological mechanisms of liver fibrosis, effective therapeutic strategies remain limited, and no drugs have yet been officially approved that directly target liver fibrosis1. Due to the advantages of multitarget and multilayer pharmacological actions as well as mild side effects, extracts and compound prescriptions from traditional Chinese medicine (TCM) have attracted increasing attention in the development of anti-fibrotic agents over recent decades10,11.
Licorice is a commonly used herb in traditional Chinese medicine and has effects such as invigorating the spleen and supplementing qi, clearing heat and eliminating toxins, relieving phlegm and cough, relieving acute pain, and harmonizing the actions of other herbs. Flavonoids are the main active components in licorice and exhibit significant pharmacological activities, including anti-inflammatory, anti-tumor, antibacterial, sedative, and analgesic effects12. Currently, research on the protective effects of flavonoids against liver injury has received increasing attention. However, studies on the anti-fibrotic effects of LTF remain limited. In the present study, network pharmacology was used to analyze the core components of LTF and to predict its targets and signaling pathways involved in anti-liver fibrosis effects. Using molecular docking techniques, the study identified that formononetin, licochalcone A, isoliquiritigenin, and liquiritin can effectively bind to the core target TGF-β1, which was further verified by a BLI assay. In LX-2 cells, LTF could markedly downregulate the expression levels of α-SMA, Collagen I, and TGF-β1. These results indicated that LTF might exert anti-hepatic fibrosis activity mainly through regulating TGF-β-related signaling pathways.
Protocol
Loading...
$$\rightleftharpoonup{xx}$$
$$\longleftharp{xx}$$,
$$\longrightharp{xx}$$,
Experimental preparation
Required drugs and reagents are listed in the Table of Materials. Human hepatocyte-derived stellate cells (LX-2) were purchased from a commercial supplier. Commercially available mature cell lines do not require ethical review. The hazardous reagents used in experiments and the generated waste were properly handled, strictly following the university’s guidelines for hazardous chemical application and waste treatment.
Preparation of licorice total flavonoids
Licorice roots (The materials were authenticated by the authors, and a voucher specimen NO. GC-20250901 was deposited at the laboratory) were crushed, and 100 g of the powder was weighed and soaked in 75% ethanol for 4 h. The mixture was extracted at 80 °C using reflux heating, and the supernatant was collected by filtration. Ethanol was then removed using a vacuum rotary evaporator. Finally, the concentrated extract was vacuum-dried at -40 °C, 110 K, to obtain powdered LTF.
Cell grouping
LX-2 cells were maintained in high-glucose DMEM supplemented with 10% fetal bovine serum (FBS) and a combination of penicillin/streptomycin, under humidified conditions at 37 °C with 5% CO2. When the LX-2 cell density reaches 70–80%, replace the serum-free medium. After 24 h, six groups were set for the cells: control (blank), model (5 ng/mL TGF-β1), LTF low concentration group (16 µg/mL LTF + 5 ng/mL TGF-β1), LTF medium concentration group (32 µg/mL LTF + 5 ng/mL TGF-β1), LTF high concentration group (64 µg/mL LTF + 5 ng/mL TGF-β1), and positive control group (4 µg/mL colchicine + 5 ng/mL TGF-β1). After 24 h of drug treatment, the cells were harvested. The control group did not receive 5 ng/mL TGF-β1.
Network pharmacology analysis
Screening of flavonoid active components in licorice and prediction of corresponding targets
Using the Traditional Chinese Medicine System Pharmacology Database and Analysis Platform (TCMSP), active components of licorice were retrieved based on screening criteria of drug-like properties (DL) ≥ 0.18 and oral bioavailability (OB) ≥ 30%13,14. Flavonoid bioactive components were further selected from these compounds. The target genes of the flavonoid bioactive components in licorice were unified into standard gene nomenclature and deduplicated via the UniProt .
Screening of disease-related targets for liver fibrosis
Liver fibrosis disease targets using “hepatic fibrosis” and “liver fibrosis” as keywords in the GeneCards and OMIM databases. Targets with a relevance score > 10 were selected, and the filtered results were integrated to obtain liver fibrosis disease targets. Identify common targets between LTF and liver fibrosis using the Bioinformatics online platform.
Analysis of protein–protein interactions
STRING database was adopted to analyze the common targets of LTF and liver fibrosis. The .tsv file containing the target information was exported and imported into Cytoscape 3.9.1. Using the Centiscape 2.2 plugin, node degree, betweenness, and closeness centrality were calculated for core target screening13,14, established the PPI network, and completed related analyses.
Gene ontology (GO) functional analysis and Kyoto Encyclopedia of Genes and Genomes (KEGG) pathway analysis
To further clarify the biological functions of the intersecting targets and the main signaling pathways involved in the anti-liver fibrosis effects of LTF, GO and KEGG pathway enrichment analysis were performed using the Metascape database. The GO biological function diagram and KEGG metabolic pathway enrichment analysis diagram were visualized using the Bioinformatics online platform.
Molecular docking
Molecular docking was performed between the core target TGF-β and active components in licorice predicted to have multiple flavonoid-related targets. Small-molecule files of the active components were obtained from the PubChem database. The 2D structures of small molecules were imported into ChemOffice 20.0 for three-dimensional conformation optimization, and optimized conformers were stored as mol2 files. Core proteins requiring further analysis were screened from the RCSB PDB protein database. Target proteins were screened with Homo sapiens set as the species source and X-ray crystallography defined as the preferred analytical technique, followed by the download of corresponding PDB documents. PyMOL 2.6.0 was utilized to conduct dehydration and dephosphorylation modifications on target proteins. Energy minimization of the tested compounds was performed using the molecular operating environment (MOE) 2019, followed by target protein preparation and active pocket identification. Finally, molecular docking was performed via MOE 2019 with 50 simulation replicates. Binding activity was assessed based on binding energy, and results were visualized in PyMOL 2.6.0 and Discovery Studio 2019.
Molecular dynamics simulations
MD simulations of the optimal ligand-target protein complex were carried out with GROMACS 2020.3. The simulation box was dimensioned such that a minimum spacing of 1.0 nm was maintained between all protein atoms and the box boundaries, followed by system energy minimization to eliminate atomic overlaps and unfavorable steric contacts. System equilibration was accomplished sequentially via NVT and NPT ensemble simulations prior to a 100 ns production MD run. Temperature regulation was implemented using the V-rescale thermostat, while pressure was maintained with the Parrinello-Rahman barostat. Van der Waals interactions were described by the Lennard-Jones potential with a nonbonded cutoff of 1.4 nm, and all covalent bond lengths were restrained employing the LINCS constraint algorithm. Long-range electrostatic interactions were computed via the particle-mesh Ewald (PME) approach at a Fourier grid spacing of 0.16 nm.
Biolayer interferometry fishing
100 mg of prepared LTF powder was accurately weighed and solubilized in phosphate-buffered saline (PBS) to prepare a 100 mg/mL solution. TGF-β1 was used as the target protein and biotinylated using a biotinylation kit. The target protein was then immobilized on a sensor pre-wetted with PBST, as the TGF-β1 group, and a reference sensor that does not require albumin fixation was set up as a control group. A fishing assay was performed using the Sartorius Octet4R molecular interaction analyzer. Performed the baseline, binding, and elution steps for 60 s each, repeating the cycle 30 times. The eluate from multiple fishing rounds was collected for subsequent LC-MS analysis to identify the active components.
LC-MS analysis
Started with 150 µL of the fishing sample obtained from BLI analysis and placed it in a 1.5 mL EP tube for vacuum drying. Added 300 µL of a 40% aqueous methanol solution to resuspend the sample, vortexed for 30 s, and centrifuged for 15 min (16,000 x g, 4 °C). Collected the supernatant and analyzed the chemical composition using ultra-high performance liquid chromatography coupled with high-resolution mass spectrometry (UPLC-HRMS) analysis. Chemical identification was performed by matching the primary accurate mass (molecular mass error < 25 ppm) and secondary fragment mass spectrum information of the compounds in the sample with those in the reference standard database. LC-MS data were analyzed using a volcanic scatter plot (p < 0.05), and a fold change (FC) > 1 was used as a criterion for identifying differentially expressed compounds15. Chromatographic analysis of the extracts was carried out on Vanquish UHPLC. A HSS-T3 column (100 × 2.1 mm, 1.8 µm) was used, and the column oven temperature was controlled at 35 °C. Mobile phase A is H2O + 0.1% formic acid, and mobile phase B is acetonitrile + 0.1% formic acid. The separation was run at 0.3 mL/min with the elution gradient: initial 1 min isocratic at 5% B, a 16 min linear gradient to 98% B, 0.5 min re-equilibration to 5% B, and 2.5 min isocratic maintenance at 5% B.
The UHPLC instrument was connected to a mass spectrometer. Data-dependent acquisition (DDA) was employed to collect mass spectral signals in two distinct electrospray ionization (ESI) operational modes. The monitored mass-to-charge ratio ranged from 90 to 1300. Secondary spectra were collected from the top 10 strongest MS1 signals. Fragmentation utilized stepped normalized high-energy collision dissociation at 20, 40, and 60 energy units. Temperature parameters were configured as follows: capillary at 320 °C, probe heater at 350 °C.
Cell viability assay
LX-2 cells were dispensed into 96-well plates, with 5 × 10³ cells added to each well. After 24 h, the cells were treated with different concentrations of LTF (0, 4, 8, 16, 32, 50, and 64 µg/mL) and colchicine (0, 1, 2, 4, 8, 16, 32, and 64 µg/mL) for 24 h. The CCK-8 kit was employed to quantify cell viability through absorbance detection at 450 nm. LTF and colchicine stock solutions were prepared by dissolving 24 mg LTF and 20 mg colchicine individually in 500 µL DMSO, yielding stock solutions of 48 mg/mL LTF and 40 mg/mL colchicine. Appropriate dilutions were performed prior to experiments.
Western blotting detection
Cells from the six groups were collected, and the protein was extracted separately. Fractionation of protein samples was performed by SDS-PAGE, prior to membrane transfer. The polyvinylidene fluoride (PVDF) membrane was pre-activated with ethanol. The blotting step lasted 30 min under a constant current of 350 mA. After rinsing once in Tris-buffered saline containing Tween-20 (TBST), the membrane was placed on a decolorizing shaker and blocked with 5% skim milk for 30 min at ambient temperature. When blocking was accomplished, the membrane was exposed to primary antibodies and incubated overnight (12–16 h) at 4 °C. The primary antibody solution was aspirated, and the membrane was washed thrice with TBST, 5 min per wash. After 30 min of incubation with secondary antibodies at room temperature, the membrane was rinsed another three times using TBST for 5 min each. Chemiluminescence using a hypersensitive ECL chemiluminescence kit. In this study, the primary antibodies used included α-SMA (dilution: 1:1000), Collagen I (dilution: 1:1000), and TGF-β1 (dilution: 1:1000). Goat anti-rabbit IgG-HRP (dilution: 1:5000) as a secondary antibody, with GAPDH (dilution: 1:10000) used as a control for protein loading.
RT-qPCR detection
Cells from each group were harvested, and total RNA was isolated according to the instructions of the RNA Extraction Kit. RNA content was determined using a microplate spectrophotometer. Total cDNA templates were synthesized by reverse transcription using kits and a PCR amplifier. The cDNA was then amplified according to the SYBR Green protocol. Gene expression was normalized to GAPDH and quantified using the 2−ΔΔCt method. The sequences of experimental primers are summarized in Table 1.
Statistical analysis
Mean ± SD was used to present the data. Statistical analyses, including t-test and one-way ANOVA, as well as figure plotting, were accomplished using GraphPad Prism 8.0 software. p < 0.05 was considered statistically significant.
Results
Loading...
$$\rightleftharpoonup{xx}$$
$$\longleftharp{xx}$$,
$$\longrightharp{xx}$$,
Screening of flavonoid active components in licorice targeting hepatic fibrosis
Through the TCMSP, 92 active components of licorice were identified, including 68 flavonoid-related active components. Using the UniProt database, the target genes for these flavonoid-based active components in licorice were converted into gene names. After removing duplicates, 211 relevant target genes were obtained. In the GeneCards database, 1171 disease-related targets for liver fibrosis were identified, while the OMIM database provided 113 targets. After removing duplicates, 1252 disease targets were identified. By intersecting the targets of licorice flavonoid active components with liver fibrosis-related targets, 108 common interaction targets were identified (Figure 1A).
Construction of core target PPI networks
The 108 common targets between LTF and liver fibrosis were imported into the STRING database for PPI analysis, resulting in 108 nodes and 2617 edges. The data were analyzed using Cytoscape 3.9.1, and nodes were filtered based on degree > 48.4629629629629, betweenness > 60.8518518518518, and closeness > 0.00611353509051094, resulting in 32 nodes and 487 edges. The 32-core target nodes were visualized using Cytoscape software (Figure 1B). In the network, darker colors and larger nodes indicate stronger protein associations. Key targets closely associated with liver fibrosis include AKT1, IL6, IL1B, MMP9, EGFR, TGFB1, and STAT3.
GO functional analysis and KEGG pathway analysis
GO functional, and KEGG pathway enrichment analyses of the 108 intersecting targets identified 5969 molecular entries and 189 signaling pathways (p < 0.01). Visualization of the top 10 GO terms showed that MF mainly involved transcription factor binding, cytokine receptor binding, and kinase inhibitor activity among the key anti-fibrotic targets of LTF. Biological process (BP) is mainly involved in regulating the apoptosis signaling pathway, negative regulation of cell differentiation, and modulation of inflammatory responses. Cellular component (CC) mainly involved membrane rafts, transcription regulatory complexes, and the extracellular matrix (Figure 2A). KEGG pathway analysis indicated that the key anti-fibrotic pathways mediated by LTF mainly involved the TGF-β signaling pathway, JAK-STAT signaling pathway, PI3K-Akt signaling pathway, IL-17 signaling pathway, and AGE-RAGE signaling pathway (Figure 2B). Among these pathways, the TGF-β signaling pathway is a pivotal pathway in fibrosis16. Key molecules in this pathway include TGF-β, TGF-β receptors, Smad proteins (such as SMAD2, SMAD3, and SMAD4), and other non-Smad signaling molecules.
Molecular docking
Four active components from licorice with a high number of predicted targets were selected as ligands: formononetin, licochalcone A, isoliquiritigenin, and liquiritin. The core target TGF-β1 (PDB:4XCT)/TGF-βR1 (PDB:1VJY) as receptor was performed molecular docking analysis. Analysis using MOE 2019 and PyMOL 2.6.0 software, combined with affinity data shown in Figure 3A–D and Supplementary Figure 1A–D. All binding energy values were below -5 kCal/mol, and the lower the binding energy, the stronger the binding.
Molecular docking simulations
Considering the promising docking outcomes of liquiritin against TGF‑β1 and TGFBR1, molecular dynamics simulations were implemented to further analyze their binding interactions. As shown in Figure 4A, Supplementary Figure 2A, the simulations of Liquiritin with TGF-β1 and TGF-βR1 reached equilibrium at approximately 30 ns, with root-mean-square deviations (RMSD) of 1.74 and 1.54 Å, respectively. It is indicated that high structural stability was maintained by liquiritin-TGF-β1 and liquiritin-TGF-βR1 complexes throughout the simulation. The fluctuations of the residues bound to liquiritin in TGF-β1 and TGF-βR1 are shown in Figure 4B, Supplementary Figure 2B, respectively. The ranges of root-mean-square fluctuations (RMSF) for the residues in the proteins were 1.29-9.02 and 2.80-23.81 Å, with averages of 4.01 and 13.35 Å, respectively. This suggests that the compound's entry during the binding process may have caused subtle changes in the protein receptor's spatial conformation. As shown in Figure 4C, Supplementary Figure 2C, during the simulation, the range of fluctuations in the radius of gyration (Rg) values for the compound liquiritin in complexes with TGF-β1 and TGF-βR1 was 14.80–15.25 Å and 19.53–20.07 Å, respectively, with average Rg values of 15.02 Å and 19.77 Å. Figure 4D, Supplementary Figure 2D show the total number of hydrogen bonds present in the complexes during the 100 ns simulation, which fluctuated in the ranges of 1–6 and 1–9, respectively, with average hydrogen bond counts of 4.01 and 4.49. These results are also consistent with those from molecular docking. Multiple low-energy clusters were observed in Figure 4E–F, and Supplementary Figure 2E–F, which may also explain the high binding affinity and stability of liquiritin with the TGF-β1 and TGF-βR1 proteins.
BLI fishing and LC-MS analysis
The target protein TGF-β1 was immobilized on the surface of an SSA sensor pre-wetted with phosphate-buffered saline-Tween (PBST) and then allowed to bind with LTF. The binding and dissociation curves are shown in Figures 5A and 5B. The eluate obtained after precipitation was analyzed by LC-MS. Chemical compounds exhibiting significant differences were screened based on the criteria of p-value < 0.05 and FC > 1 . The results indicated that 95 flavonoids in LTF may serve as potential candidates for binding to TGF-β1. It contains typical flavonoids of Glycyrrhiza uralensis, including formononetin, licochalcone A, isoliquiritigenin, and liquiritin (Figure 5C).
LTF inhibits TGF-β1- induced fibrosis in LX-2 cells
Based on preliminary experimental validation (Supplementary Figure 3A–B) and previous studies17,18, this study employed 5 ng/mL TGF-β1 to induce LX-2 cell activation. LTF concentrations of 32 and 64 µg/mL significantly reduced LX-2 cell proliferation. Therefore, LTF concentrations of 16, 32, and 64 µg/mL were selected as the low-, medium-, and high-dose groups in vitro experiments. A positive control concentration of 4 µg/mL colchicine induced approximately 50% growth inhibition of LX-2 cells19(Figure 6A). 16, 32 and 64 µg/mL LTF were treated LX-2 cells for 24 h, then the cells were collected for qRT-PCR and Western blot analyses. The results revealed that the mRNA and protein expression levels of α-SMA, Collagen I, and TGF-β1 were significantly reduced in the treated groups compared to the model group, indicating that LTF exerts anti-fibrotic effects (Figure 6B, C).
DATA AVAILABILITY:
All raw data from this study have been uploaded to Figshare (DOI link: 10.6084/m9.figshare.32527209). One more raw data quantification file is submitted as Supplementary File 1.
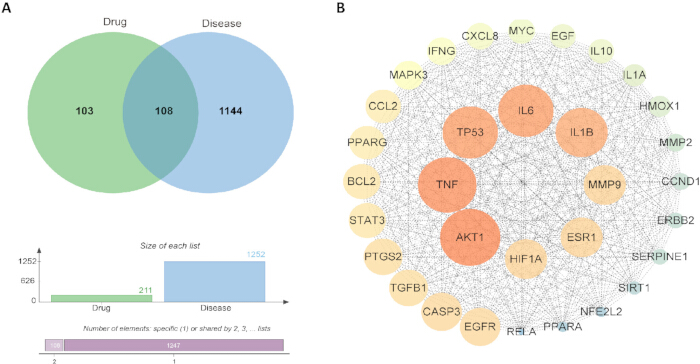
Figure 1: Potential targets of licorice total flavonoids for anti-liver fibrosis. (A) Venn diagram of overlapping targets. (B) Protein–protein interactions network diagram. Please click here to view a larger version of this figure.
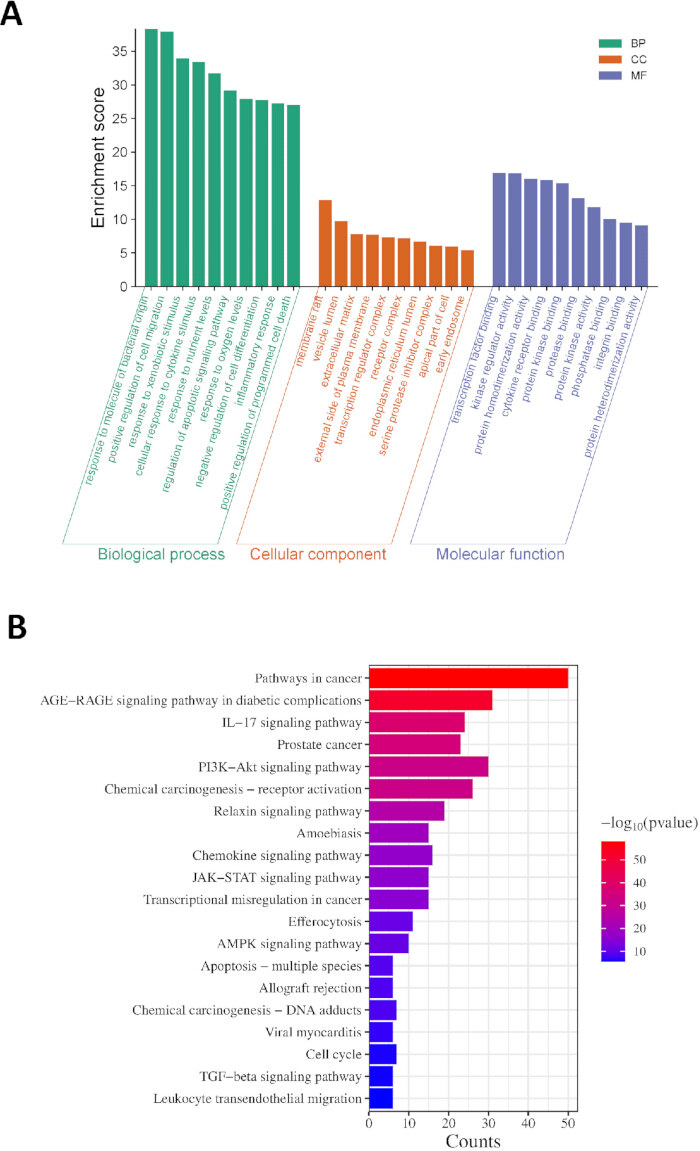
Figure 2: Key pathways of LTF in inhibiting liver fibrosis. (A) Gene ontology functional analysis, enrichment score was -log₁₀p. (B) Kyoto encyclopedia of genes and genomes pathway analysis, enrichment score was -log₁₀p. Please click here to view a larger version of this figure.
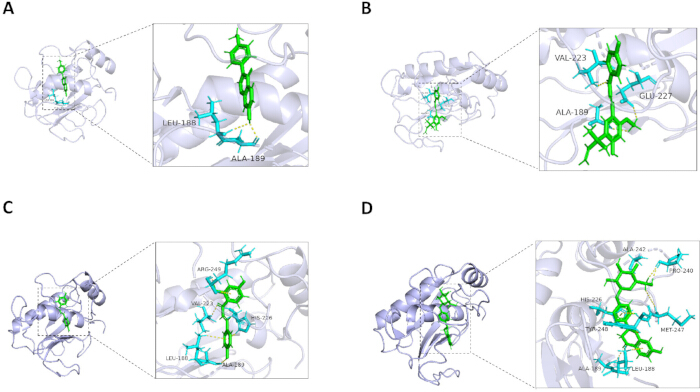
Figure 3: Molecular docking of key target transforming growth factor-β1 (TGF-β1) with active components of LTF. (A) Formononetin, BE = -6.941 kcal/mol. (B) Licochalcone A, BE = -6.976 kcal/mol. (C) isoliquiritigenin, BE = -6.839 kcal/mol. (D) liquiritin, BE = -8.274 kcal/mol. Abbreviation: BE = binding energy. Please click here to view a larger version of this figure.
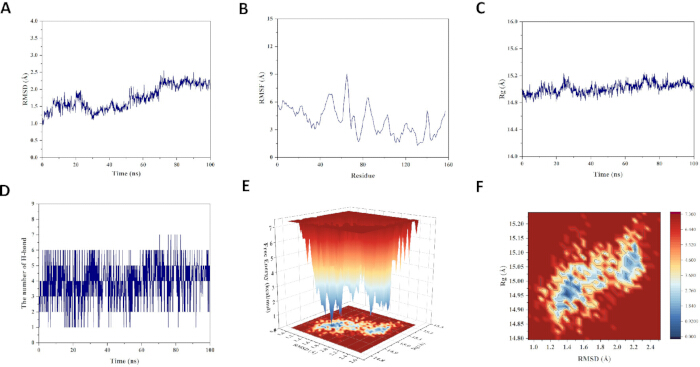
Figure 4: Molecular dynamics simulations of the liquiritin-TGF-β1 complex. (A) Root-mean-square deviations. (B) Root-mean-square fluctuations (RMSF). (C) Protein radius of gyration (Rg). (D) Hydrogen bond count curve. (E) Free-form 3D modeling. (F) Free-form 2D modeling. Please click here to view a larger version of this figure.
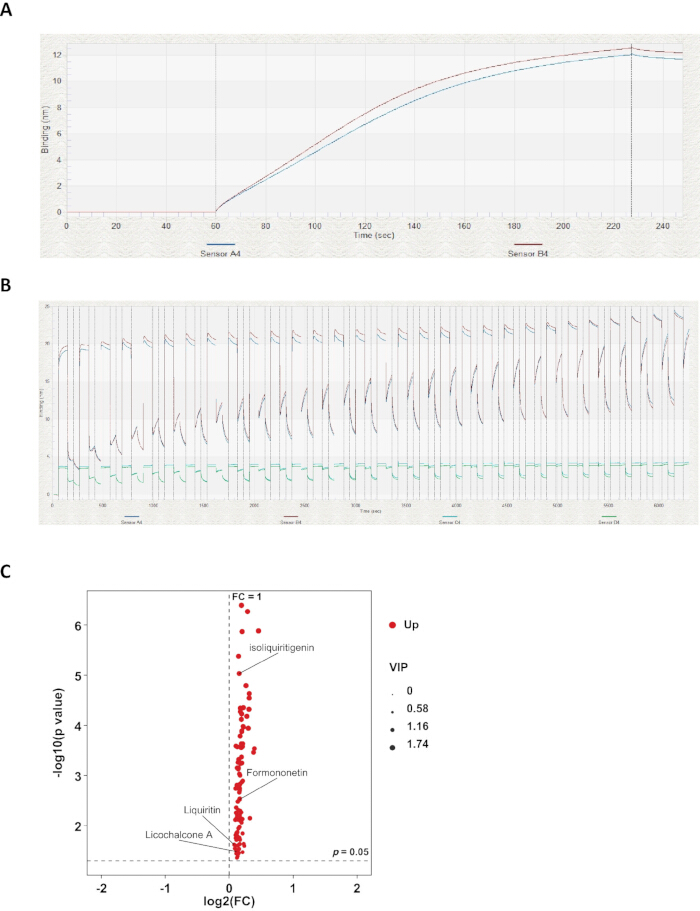
Figure 5: Bio-layer interferometry, fishing, and liquid chromatography-mass spectrometry data analysis. (A) TGF-β1 binding curve. (B) LTF and TGF-β1 bait-and-switch curve. (C) LC-MS data analysis. Please click here to view a larger version of this figure.
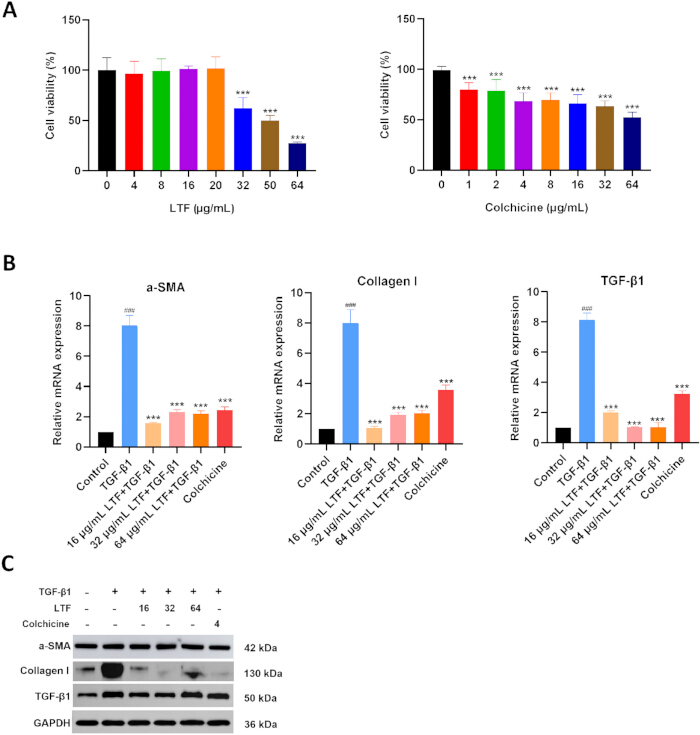
Figure 6: LTF inhibits TGF-β1-induced fibrosis in LX-2 cells. (A) Effects of different concentrations of LTF and colchicine on LX-2 cell viability. Data were expressed as the mean ± SD. Statistical analysis was performed using ordinary one-way ANOVA, **p < 0.01, ***p < 0.001 vs the control group. LTF, n = 4; Colchicine, n = 5. (B) Effects of LTF (16, 32, and 64 µg/mL) on mRNA expression of α-smooth muscle actin (α-SMA), Collagen I, and TGF-β1 in activated LX-2 cells. Data were expressed as the mean ± SD. Statistical analysis was performed using ordinary one-way ANOVA. ###p < 0.001 vs control group, **p < 0.01, ***p < 0.001 vs model group, n = 3. (C) Western blotting analysis of LTF (16, 32, and 64 µg/mL) effects on α-SMA, Collagen I, and TGF-β1 expression in LX-2 cells. Please click here to view a larger version of this figure.
Supplementary Figure 1: Molecular docking of TGF-βR1 with active components of LTF. (A) Formononetin, BE = -6.810 kcal/mol. (B) Licochalcone A, BE = -7.735 kcal/mol. (C) isoliquiritigenin, BE = -6.706 kcal/mol. (D) liquiritin, BE = -8.073 kcal/mol. Abbreviations: BE = binding energy.Please click here to download this file.
Supplementary Figure 2: Molecular dynamics (MD) simulations of the liquiritin-TGF-βR1 complex. (A) Root-mean-square deviations (RMSD). (B) Root-mean-square fluctuations (RMSF). (C) Protein radius of gyration (Rg). (D) Hydrogen bond count curve. (E) Free-form 3D modeling. (F) Free-form 2D modeling.Please click here to download this file.
Supplementary Figure 3: TGF-β1-induced fibrosis in LX-2 cells. (A) qRT-PCR analysis of TGF-β1-induced mRNA expression of α-SMA, collagen I, and TGF-β1 in LX-2 cells at different concentrations and time points. Data were expressed as the mean ± SD, statistical analysis was performed using ordinary one-way ANOVA, **p < 0.01, ***p < 0.001 vs control group, n = 3. (B) Western blotting analysis of TGF-β1-induced protein expression of α-SMA, Collagen I, and TGF-β1 in LX-2 cells.Please click here to download this file.
| Gene | Sequence(5'→3') |
| a-SMA | F: CTATGCCTCTGGACGCACAACT |
| R: CAGATCCAGACGCATGATGGCA | |
| CollagenI | F: GGCCTCGGAGGAAACTTTGC |
| R: AGGGGGACCTTGGAAGCCTT | |
| TGF-β1 | F: CCTGAACCCGTGTTGCTCTC |
| R: GTTGCTGAGGTATCGCCAGG | |
| GAPDH | F: CCTCGTCCCGTAGACAAAATG |
| R: TGAGGTCAATGAAGGGGTCGT |
Table 1: Primer sequences. The primer sequences used.
Supplementary File 1: Raw data. Quantification of raw data associated with the study.Please click here to download this file.
Discussion
Loading...
$$\rightleftharpoonup{xx}$$
$$\longleftharp{xx}$$,
$$\longrightharp{xx}$$,
The progressive development of liver fibrosis is a key factor in the onset of cirrhosis and hepatocellular carcinoma. Therefore, identifying effective therapeutic strategies for liver fibrosis is essential to reduce the progression of liver disease. Traditional Chinese medicine has become a strategy for the combined treatment of various diseases. Studies have shown that in the treatment of hepatitis B, the combined use of traditional Chinese medicine can improve the reversibility of liver fibrosis, reduce the incidence of hepatocellular carcinoma, and effectively alleviate complications associated with liver disease20. Licorice has heat-clearing and detoxifying properties. When combined with other herbs, it can enhance therapeutic effects or reduce toxicity. It is included in many Chinese herbal formulas used to treat liver diseases, and multiple components in licorice have demonstrated therapeutic value in the management of liver disorders21.
LTF refers to the total flavonoid compounds present in licorice and mainly includes flavonoids, flavanols, and chalcones. As valuable active components in licorice extracts, these natural multifunctional compounds have broad application potential in pharmaceutical, health, and cosmetic fields. Studies have shown that flavonoids from licorice leaves significantly inhibit hepatic stellate cell activity in vitro and may serve as a source for developing new lead compounds for anti-fibrotic drugs22. In mice, LTF alleviates CCl4-induced acute liver injury by activating the NRF2 pathway and regulating the gut microbiota23. Licorice flavonoids also exert anti-inflammatory effects through multiple signaling pathways24, and inflammation is a major driver of liver fibrosis. Therefore, LTF may improve the progression of liver fibrosis, although its molecular mechanism in liver fibrosis is unclear.
In the present study, 32 core targets of LTF associated with liver fibrosis were identified through network pharmacology analysis, including IL6, IL1B, MMP9, EGFR, and TGF-β1. GO functional analysis showed that these targets were mainly involved in transcription factor binding, cytokine receptor binding, regulation of inflammatory responses, transcription regulatory complexes, and extracellular matrix components. The enriched KEGG pathway analysis indicated that the major pathways included TGF-β signaling, JAK-STAT signaling, PI3K-Akt signaling, IL-17 signaling, and AGE-RAGE signaling. Active components of LTF with a high number of predicted targets, such as formononetin, licochalcone A, isoliquiritigenin, and liquiritin, were selected for molecular docking with TGF-β1/TGF-βR1. All compounds showed strong binding affinity, and molecular dynamics simulations further verified the stable binding of liquiritin to TGF-β1 and TGF‑βR1, suggesting that LTF may counteract liver fibrosis by inhibiting TGF-β1 expression and thereby affecting the TGF-β-related pathway. The TGF-β signaling pathway is a core driver of organ-specific fibrosis, propelling its onset and progression in organs such as the liver, lungs, and kidneys16. Therefore, it represents an important therapeutic target for the treatment of fibrosis. Research has confirmed that total flavonoids from white-backed leaves exert protective effects against CCl₄-induced liver fibrosis in rats by regulating the TGF-β1-related signaling pathways25. Periplaneta americana extract inhibits collagen synthesis and regulates the TGF-β1-related signaling pathway to alleviate liver fibrosis progression in both in vivo and in vitro models26.
Inducing LX-2 cells with either 5 ng/mL or 10 ng/mL TGF-β1 resulted in increased secretion of α-SMA, collagen I, and TGF-β1 by the cells. However, LTF treatment suppressed TGF-β1-induced expression of α-SMA, Collagen I, and TGF-β1 in LX-2 cells, thereby reducing extracellular matrix deposition. These results indicate that LTF has anti-fibrotic effects. Following BLI fishing, LC-MS analysis identified 95 flavonoids in LTF that may serve as potential candidates for binding to TGF-β1. The typical flavonoids of Glycyrrhiza uralensis, such as formononetin, licochalcone A, isoliquiritigenin and liquiritin among these. Studies have shown that formononetin promotes ferroptosis in activated HSCs and alleviates liver fibrosis27. In mouse experiments, isoliquiritigenin promotes autophagy via the PI3K/Akt/mTOR signaling pathway, thereby reducing metabolic dysfunction-associated steatohepatitis (MASH) and fibrosis in mice28. A novel compound formulation consisting of licochalcone A, luteolin, acacetin, and aloe-emodin showed inhibitory effects on α-SMA and Collagen I expression in both in vitro and in vivo experiments. Compared with individual compounds, this formulation showed synergistic effects in suppressing hepatocyte proliferation4.
The pathogenesis of liver fibrosis is relatively complex, and single-target inhibition has limited therapeutic efficacy. LTF contains multiple active components effective against liver fibrosis, and its chemical composition has been largely characterized, enabling simultaneous intervention at multiple key stages in its progression. This multi-pathway, multi-target synergistic action directly inhibits HSC activation and proliferation and effectively regulates the TGF-β signaling pathway, with relatively high safety. Compared with single-component Chinese herbal compounds, this approach aligns more closely with traditional Chinese medicine theory and provides both liver-protective and anti-fibrotic effects. In addition, as the primary active component of licorice, a widely available medicinal herb, LTF has abundant natural resources and mature extraction techniques. This study's results indicate that LTF has significant potential as a natural compound for anti-fibrotic therapy and provide a basis for further research.
This study combined BLI screening with LC‑MS to systematically identify bioactive flavonoid monomers from licorice total flavonoids possessing anti‑hepatic fibrosis activity and clarify their action mechanisms, which offers new clues for the development and clinical application of anti‑fibrotic herbal preparations. However, this study has certain limitations: binding and dissociation kinetics analyses of the screened active components of total licorice flavonoids with TGF-β1 have not yet been conducted, and there is a lack of direct measurements of Smad phosphorylation and in vivo animal studies to validate the associated effects. Furthermore, the
anti-fibrotic effects observed at 32 and 64 µg/mL cannot be fully separated from potential cytotoxic effects based on the current data, and future studies will be required to determine the concentration range at which anti-fibrotic activity can be demonstrated independently of reductions in cell viability.
Disclosures
Loading...
$$\rightleftharpoonup{xx}$$
$$\longleftharp{xx}$$,
$$\longrightharp{xx}$$,
The authors have nothing to disclose.
Acknowledgements
Loading...
$$\rightleftharpoonup{xx}$$
$$\longleftharp{xx}$$,
$$\longrightharp{xx}$$,
This study was supported by grants from Ningxia Natural Science Foundation Projects (NO.2026AAC031340); Open Research Projects of Ningxia Key Laboratory of Dryness Syndrome in Chinese Medicine, Ministry of Education, Ningxia Medical University.
Materials
| Name | Company | Catalog Number | Comments |
|---|---|---|---|
| 10× TBST | Wuhan Servicebio Biotechnology Co., Ltd | G0004-500ML | biochemical reagents |
| 75% ethanol | Shandong Lircon Medical Technology Co., Ltd. | —— | biochemical reagents |
| Anti-alpha smooth muscle Actin (a-SMA) | Wuhan Servicebio Biotechnology Co., Ltd | GB111364 | antibodies |
| BCA Protein Quantification Kit | Wuhan Servicebio Biotechnology Co., Ltd | G2026-200T | test kit |
| Biolayer Interferometry System | Sartorius, USA | Octet R4 | Equipment |
| Biotinylation kit | Beijing Sansilechuang Technology Co., Ltd. | Sansi-001 | test kit |
| CCK-8 Kit | Beyotime Biotechnology | C0038 | test kit |
| Chemiluminescence Imager | Wuhan Servicebio Biotechnology Co., Ltd | SCG-W3000 | Equipment |
| Colchicine | Shanghai Yuanye Biotechnology Co., Ltd | S18047-1g | Positive control |
| Collagen I | Wuhan Servicebio Biotechnology Co., Ltd | GB114197 | antibodies |
| DMSO | Wuhan Servicebio Biotechnology Co., Ltd | GC203005-10ml | biochemical reagents |
| Fetal bovine serum | Wuhan Servicebio Biotechnology Co., Ltd | G8002-100ML | serum |
| GAPDH | Wuhan Servicebio Biotechnology Co., Ltd | GB15004 | antibodies |
| Goat anti-rabbit IgG-HRP | Wuhan Servicebio Biotechnology Co., Ltd | GB23303 | antibodies |
| High-glucose DMEM | Wuhan Pusan Life Science Technology Co., Ltd. | WHB825G291 | cell culture medium |
| Human hepatocyte-derived stellate cells(LX-2) | Wuhan Pusan Life Science Technology Co., Ltd. | CL-0560 | cell |
| Human TGF-Beta 1 / TGFB1 Protein | ACRO BioScience | TG1-H4212 | biochemical reagents |
| Hypersensitive ECL chemiluminescence kit | Wuhan Servicebio Biotechnology Co., Ltd | G2020-25ML | test kit |
| Methanol (AR) | Tianjin Damao Chemical Reagent Factory, China | —— | biochemical reagents |
| Multimode Microplate Reader | PerkinElmer, USA | VICTOR Nivo | Equipment |
| Ningxia licorice | Ningxia Mingde Chinese Herbal Medicine Slices Co., Ltd | 2412477 | Chinese herbal medicine. Licorice roots were crushed, and 100 g of the powder was weighed and soaked in 75% ethanol for 4 h. The mixture was extracted using a reflux heating method, and the supernatant was collected by filtration. Ethanol was then removed using a vacuum rotary evaporator. Finally, the concentrated extract was vacuum-dried to obtain powdered LTF. |
| PBS, 1× (Phosphate Buffered Saline) | Wuhan Servicebio Biotechnology Co., Ltd | G4202-500ML | biochemical reagents |
| Penicillin/streptomycin (gibco) | Thermo Fisher Scientific | 15140-122 | applied to cell culture |
| Polyvinylidene fluoride (PVDF) 0.45 μm | Wuhan Servicebio Biotechnology Co., Ltd | WGPVDF45 | material |
| PrimeScript™ RT reagent Kit | TaKaRa | RR047A | test kit |
| Q-Exactive HFX mass spectrometer | Thermo Fisher Scientific, Bremen, Germany | Q-Exactive HFX | Equipment |
| Quantitative real-time PCR system | Applied Biosystems, USA | Steponeplus | Equipment |
| SDS-PAGE Gel Quick Preparation Kit | Wuhan Servicebio Biotechnology Co., Ltd | G2037-50T | test kit |
| SSA Biosensors | Octet | 2307018211 | The sensor surface is coated with ultra-high-density streptavidin for the binding of labeled antibodies, proteins, peptides, and nucleic acid samples. It is particularly suitable for small-molecule binding assays and fragment screening. |
| TaKaRa MiniBEST Universal RNA Extraction Kit | TaKaRa | 9767 | test kit |
| TGF-β1 | Wuhan Servicebio Biotechnology Co., Ltd | GB15179 | antibodies |
| Tween-20 | Wuhan Servicebio Biotechnology Co., Ltd | GC204002-100mL | biochemical reagents |
| Ultrapure & Pure Water Integrated System | Veolia, France | ULXXXGEM2 | Equipment |
| Vanquish UHPLC system | Thermo Scientific, Waltham, MA | Vanquish UHPLC | Equipment |
| Vertical Electrophoresis System | Wuhan Servicebio Biotechnology Co., Ltd | SVE-2 | Equipment |
| Name of Software/Databases | Version numbers/URLs | ||
| Bioinformatics online platform | https://www.bioinformatics.com.cn/ | ||
| Chem Office 20.0 | 20 | ||
| Cytoscape | 3.9.1 | ||
| Discovery Studio 2019 | 2019 | ||
| GeneCards (Usage time: May 23, 2024) | https://www.genecards.org/ | ||
| GraphPad Prism software | 8 | ||
| GROMACS 2020.3 | 2020.3 | ||
| Metascape database (Usage time: Jun 11,2025) | https://metascape.org/ | ||
| Molecular Operating Environment (MOE) 2019 | 2019 | ||
| OMIM (Usage time: May 23, 2024) | https://www.omim.org/ | ||
| PubChem database | http://pubchem.ncbi.nlm.nih.gov/ | ||
| PyMOL 2.6.0 | 2.6.0 | ||
| RCSB PDB protein database | https://www.rcsb.org/ | ||
| STRING database | https://string-db.org/ | ||
| Traditional Chinese Medicine System Pharmacology Database and Analysis Platform (TCMSP); (Usage time: October 23, 2023) | https://tcmsp-e.com/ | ||
| UniProt database | https://www.uniprot.org/ |
Reprints and Permissions
Request permission to reuse the text or figures of this JoVE article
Request Permission