A genetically anchored, multistage framework integrating Mendelian randomization, tumor transcriptomics, and single-cell analyses prioritized MAP1LC3A as a ferroptosis-related gene associated with glioblastoma susceptibility and a candidate for future experimental validation.
Research Article
Multistage Genetic, Transcriptomic, and Single-Cell Evidence Prioritizes MAP1LC3A among Ferroptosis-Related Genes in Glioblastoma
58 views
⸱
September 11th, 2026
* These authors contributed equally
In This Article
Summary
Abstract
Glioblastoma (GBM) remains a highly aggressive malignancy, and the contribution of ferroptosis-related genes to disease susceptibility remains incompletely understood. A genetically anchored, multistage framework was applied to prioritize ferroptosis-related genes associated with GBM. Among 483 genes curated from FerrDb V2, 315 had candidate cis-expression quantitative trait loci (cis-eQTLs) in eQTLGen, 250 retained at least three independent instruments after linkage disequilibrium clumping, and 226 yielded valid inverse-variance weighted (IVW) Mendelian randomization estimates using a GBM genome-wide association study comprising 6,183 cases and 18,169 controls. Thirty-four genes met the exploratory discovery criteria of P < 0.05 and a Benjamini–Hochberg false discovery rate (BH-FDR) < 0.20, with directionally concordant Bayesian weighted Mendelian randomization (BWMR) estimates. Replication-stage Mendelian randomization using GTEx V10 whole-blood cis-eQTLs supported four genes: ATG7, RPTOR, MAP1LC3A, and CHMP6. Evaluation across three independent tumor–control transcriptomic cohorts demonstrated that MAP1LC3A was consistently downregulated in tumor tissue and showed a significant random-effects pooled estimate (log₂ fold change, −1.273; 95% confidence interval, −1.625 to −0.920; false discovery rate = 0.016), whereas the other three genes lacked comparable cross-cohort statistical support. Single-cell virtual knockout analysis was subsequently performed in a patient-balanced subset of 2,400 malignant cells selected from 4,916 eligible cells across 20 adult IDH-wild-type GBM tumors. Across five independently seeded runs, 3, 15, 4, and 7 robust downstream genes were identified for ATG7, RPTOR, MAP1LC3A, and CHMP6, respectively. The resulting consensus sets comprised 17 unique genes, with RND3 shared across all four targets. Gene Ontology analysis indicated enrichment of cell-adhesion and cell-surface processes, whereas no KEGG or Reactome pathways remained significant after multiple-testing correction. Collectively, these findings prioritize MAP1LC3A for future experimental investigation while distinguishing genetic association, tumor-expression concordance, and computational perturbation from definitive evidence of causality or mechanism.
Introduction
Glioblastoma (GBM) remains a paradigmatic treatment-refractory malignancy. Despite increasingly refined molecular classification and multidisciplinary care, durable improvements in patient outcomes have been limited1. For medically fit patients, current management consists of maximal safe resection followed by radiotherapy with concomitant and adjuvant temozolomide, a regimen established in a landmark randomized trial and retained in contemporary clinical guidelines1,2. Nevertheless, diffuse infiltration and extensive cellular and molecular heterogeneity limit durable disease control, and most patients ultimately experience progression or recurrence, for which no universally effective standard treatment exists1,3. This persistent gap between advances in disease characterization and clinical outcomes underscores the need to identify biologically relevant molecular dependencies that may inform novel therapeutic strategies for GBM.
Ferroptosis is an iron-dependent form of regulated cell death characterized by uncontrolled phospholipid peroxidation and failure of cellular antioxidant defenses, distinguishing it mechanistically from apoptosis and other canonical cell death programs4,5. This process is particularly relevant to GBM, where genetic alterations and metabolic plasticity reshape iron homeostasis, redox balance, and lipid metabolism. Integrated genomic and lipidomic profiling has demonstrated that CDKN2A deletion redistributes oxidizable polyunsaturated fatty acids, thereby creating genotype-dependent ferroptosis susceptibility in GBM models6. Likewise, paired analyses of primary and recurrent tumors have identified relapse-associated alterations in GPX4, ACSL4, and other ferroptosis regulators7. Experimental modulation of ferroptosis-defense pathways has also been shown to influence temozolomide responsiveness in GBM cells and xenograft models8. Collectively, these findings identify ferroptosis as a biologically plausible therapeutic vulnerability in GBM. However, they primarily reflect tumor-state associations or context-dependent experimental observations and do not establish whether constitutive variation in ferroptosis-related gene expression contributes to inherited susceptibility to GBM.
Most human studies investigating ferroptosis in glioma have relied on differential expression, survival modeling, and molecular subtyping analyses using TCGA, CGGA, and GEO datasets9,10. Although these studies established the prognostic relevance of ferroptosis-related transcriptional programs, their observational design cannot determine whether altered gene expression contributes to GBM susceptibility or instead represents a consequence of tumor development. Transcriptome-wide Mendelian randomization has subsequently identified genetically regulated, tissue-dependent genes associated with glioma risk, whereas more recent expression quantitative trait locus (eQTL)- and protein quantitative trait locus (pQTL)-based studies have begun to prioritize potential therapeutic targets for GBM11,12. Nevertheless, previous investigations have generally adopted transcriptome-wide or drug-target-oriented approaches rather than evaluating a prespecified, comprehensive set of ferroptosis-related genes. Furthermore, few studies have integrated a large GBM genome-wide association study (GWAS) with replication-stage Mendelian randomization using an independent eQTL resource, followed by evaluation across multiple tumor–control transcriptomic cohorts. This distinction is important because the genetic regulation of gene expression varies substantially across tissues, and blood-derived eQTL associations cannot be assumed to reflect regulatory effects within brain tumors11,13. Therefore, an integrative framework that combines genetic association, replication-stage Mendelian randomization, cross-cohort tumor transcriptomics, and patient-derived single-cell functional prediction is needed to identify ferroptosis-related genes supported by convergent lines of evidence of their involvement in GBM.
This study investigated whether genetically regulated expression of ferroptosis-related genes is associated with susceptibility to GBM. Discovery-stage and replication-stage Mendelian randomization were combined with gene-expression analyses across three independent tumor–control transcriptomic cohorts. Genes supported by both Mendelian randomization stages were subsequently evaluated in patient-derived single-cell transcriptomic data using virtual perturbation to characterize predicted transcriptional responses in malignant cells. Rather than prioritizing genes solely based on tumor expression signatures, this multistage framework first leveraged inherited genetic variation and then assessed disease-relevant expression patterns alongside cell-resolved computational perturbation profiles. The resulting convergent evidence was used to prioritize ferroptosis-related genes for future experimental investigation in GBM.
Protocol
This study was granted an exemption from ethical review by the Medical Ethics Committee of The First People's Hospital of Zhaoqing (Reference No. B2026-08-03). The study used retrospectively collected, de-identified summary-level genetic and transcriptomic data, including Data Access Committee-approved controlled-access data from EGAD00010001657 and datasets obtained from GEO, eQTLGen, and GTEx in accordance with their applicable access and use conditions. No new participants were recruited, no biospecimens were collected, and no identifiable participant-level data were accessed. Ethical approval and informed consent for the original studies were obtained by the respective data generators, and the controlled-access data were used in accordance with the applicable Data Access Agreement.
Study design
This study employed a multistage framework to prioritize ferroptosis-related genes associated with glioblastoma (GBM) susceptibility and to evaluate their disease-relevant transcriptional effects (Figure 1). First, ferroptosis-related genes curated from FerrDb V2 were evaluated using two-sample Mendelian randomization (MR) with cis-expression quantitative trait locus (cis-eQTL) data and a large GBM genome-wide association study (GWAS). Inverse-variance weighted (IVW) MR served as the primary screening method, Bayesian weighted Mendelian randomization (BWMR) provided a complementary assessment of robustness, and an independent eQTL dataset was used for replication-stage MR. Second, genes supported by the genetic analyses were evaluated across three independent tumor–control transcriptomic cohorts, followed by cross-cohort meta-analysis. Third, patient-derived single-cell transcriptomic data were used to perform virtual gene perturbation in malignant cells and identify reproducible downstream transcriptional responses. These responses were subsequently characterized through functional enrichment and shared-network analyses. Overall, the genetic analyses were designed to identify genes associated with GBM susceptibility, whereas the transcriptomic and single-cell analyses assessed biological concordance and generated hypotheses for subsequent experimental validation.
Data sources
Ferroptosis-related genes were obtained from FerrDb V2, yielding 483 unique human protein-coding genes after gene-symbol harmonization and removal of duplicate entries14. Whole-blood cis-expression quantitative trait locus (cis-eQTL) summary statistics from the eQTLGen Consortium were used as the exposure dataset for discovery-stage Mendelian randomization (MR), whereas GTEx release V10 whole-blood cis-eQTL data served as an independent exposure dataset for replication-stage MR11,15. GBM outcome associations were obtained from controlled-access genome-wide association study (GWAS) summary statistics available through the European Genome-phenome Archive, comprising 6,183 cases and 18,169 controls of European ancestry16. Tissue-level expression of genetically prioritized genes was evaluated across three independent Gene Expression Omnibus (GEO) cohorts: GSE196533, comprising 61 grade 4 glioma samples annotated as GBM in the deposited metadata and nine non-neoplastic brain samples; GSE4290, comprising GBM and epilepsy-derived non-tumor brain samples; and GSE116520, containing paired tumor-core and peritumoral specimens together with non-neoplastic controls17,18,19. Patient-derived Smart-seq2 data from GSE131928 were used for malignant-cell virtual perturbation analysis20. Dataset characteristics and their respective analytical roles are summarized in Table 1. All analyses were performed using previously collected, de-identified datasets for which ethical approval and informed consent had been obtained in the original studies.
Genetic instrument selection and data harmonization
Candidate instruments were restricted to cis-expression quantitative trait loci (cis-eQTLs) associated with gene expression at genome-wide significance (P < 5 × 10⁻8). Variants were clumped using the European reference panel from the 1000 Genomes Project with a linkage disequilibrium (LD) threshold of r2 < 0.001 within a 10,000-kb window. Genes retaining fewer than three independent instruments after clumping were excluded from the primary Mendelian randomization (MR) analysis. Given the exploratory screening objective, a minimum of three instruments was prespecified to retain genes with sparse but strong cis-eQTL support while permitting multi-instrument IVW estimation. This threshold was accompanied by stringent LD clumping and F-statistic filtering; estimates based on only three or four instruments were interpreted cautiously, and sensitivity analyses were performed only when methodologically applicable. Instrument strength was assessed for each variant using the F statistic (F = β2/SE2), where β and SE represent the cis-eQTL effect estimate and its standard error, respectively. Variants with F < 10 were excluded to minimize weak-instrument bias21,22. Exposure and outcome datasets were harmonized by aligning effect alleles and effect directions. Duplicate variants, variants unavailable in the GBM GWAS dataset, and variants with incompatible allele coding were excluded. Because effect-allele frequencies were unavailable for the GBM GWAS, palindromic variants with ambiguous strand orientation were removed rather than inferred. For the same reason, a formal Steiger directionality test was not performed.
Mendelian randomization analyses
The association between genetically predicted gene expression and GBM susceptibility was evaluated using two-sample Mendelian randomization (MR). In the discovery stage, only genes with at least three independent cis-expression quantitative trait locus (cis-eQTL) instruments were included, and the inverse-variance weighted (IVW) method served as the primary analytical approach. Effect estimates were reported as odds ratios (ORs) with 95% confidence intervals (CIs) per unit increase in genetically predicted gene expression. To account for multiple testing across the genes evaluated, IVW P values were adjusted using the Benjamini–Hochberg procedure23. Genes with P < 0.05 and a Benjamini–Hochberg false discovery rate (BH-FDR) < 0.20 were retained as exploratory candidates. This relatively permissive FDR threshold was selected to reduce premature exclusion of potentially relevant genes during the discovery stage; therefore, candidate status was interpreted in conjunction with subsequent analyses rather than as confirmatory evidence. Bayesian-weighted Mendelian randomization (BWMR) was subsequently applied to the discovery-stage candidates using the same harmonized instruments24. Concordance between the IVW and BWMR results was assessed based on both statistical significance and the direction of the effect. Where permitted by the number of available instruments, Cochran's Q test, the MR-Egger intercept test, MR-PRESSO, and leave-one-out analyses were performed to evaluate heterogeneity, horizontal pleiotropy, influential outlying variants, and the influence of individual single-nucleotide polymorphisms (SNPs)22.
Replication-stage MR was performed using GTEx V10 whole-blood cis-eQTL data. The Wald ratio method was applied when only a single instrument was available, whereas the IVW method was used for genes with two or more instruments. Replication was defined by P < 0.05, BH-FDR < 0.20, and an effect direction consistent with the corresponding discovery-stage estimate. Because several GTEx replication estimates were based on only one or two instruments, they were interpreted as supportive evidence for replication rather than as independent evidence of causality.
Cross-cohort transcriptomic evaluation
The four genes prioritized by the discovery- and replication-stage Mendelian randomization (MR) analyses were evaluated across three independent transcriptomic cohorts. For GSE196533, raw RNA-sequencing count data were analyzed using DESeq225. Genes with counts below 10 in all but two samples were excluded, whereas the four target genes were retained regardless of expression filtering. Differential expression was assessed between 61 grade 4 glioma samples annotated as GBM in the deposited metadata and nine non-neoplastic brain samples.
For GSE4290, four samples lacking an explicit histopathological diagnosis were excluded, leaving 77 GBM and 23 non-tumor brain samples. Processed microarray intensities were log2-transformed, quantile-normalized, and analyzed using robust empirical Bayes linear models implemented in limma26. When multiple probes mapped to the same gene, the probe with the highest mean expression across all included samples was selected independently of differential expression significance.
GSE116520 comprised paired tumor-core and peritumoral specimens from 17 patients together with eight non-neoplastic controls. The deposited log-transformed, quantile-normalized expression data were analyzed using limma. Within-patient correlations between tumor-core and peritumoral samples were accounted for using patient-level blocking and the duplicateCorrelation function. Tumor-core versus control was the prespecified comparison for the cross-cohort meta-analysis, whereas peritumoral comparisons and the ordered control–peritumoral–tumor-core trend were evaluated separately.
Study-specific log2 fold changes and standard errors were pooled using a restricted maximum-likelihood random-effects model with Hartung–Knapp inference, as implemented in metafor. Between-study heterogeneity was assessed using Cochran's Q statistic and I2. Pooled P values for the four target genes were adjusted using the Benjamini–Hochberg procedure. Strong transcriptomic support was defined by a meta-analysis false discovery rate (FDR) < 0.05, cohort-level FDR significance in at least two datasets, and concordant effect directions across all three cohorts.
Single-cell virtual knockout analysis
Patient-derived Smart-seq2 data from GSE131928 were used to evaluate the four MR-replicated genes in malignant cells. Adult malignant cells were identified according to the annotations provided in the original study, and equal numbers of cells were randomly sampled from each eligible patient to minimize imbalance in patient representation. Virtual knockout was performed using scTenifoldKnk and repeated across five independent runs. Genes with a Benjamini–Hochberg-adjusted P < 0.05 in an individual run were considered significant. Downstream genes reproduced in at least three of the five runs were defined as the primary consensus set, whereas a more stringent four-of-five criterion was used for sensitivity analysis. These results were interpreted as computational predictions of transcriptional perturbation rather than evidence of direct molecular regulation.
Functional enrichment and shared-network analysis
Functional enrichment analysis was performed using target-specific downstream genes reproducibly identified in at least three of five virtual knockout runs. Gene Ontology (GO), Kyoto Encyclopedia of Genes and Genomes (KEGG), and Reactome pathway enrichment were assessed using one-sided hypergeometric tests, with the 1,004 genes included in the network inference serving as the background gene set. P values were adjusted separately for each annotation database using the Benjamini–Hochberg procedure, and an adjusted P < 0.05 was considered statistically significant.
A bipartite network was constructed to represent the relationships between the four knockout targets and their consensus downstream genes. Genes associated with multiple targets were identified based on their shared degree, and overlap among target-specific gene sets was quantified using intersection counts and Jaccard indices. Network edges represent associations between reproducible computational perturbations and should not be interpreted as evidence of direct molecular interactions.
Statistical analysis and reproducibility
Unless otherwise specified, statistical tests were two-sided, and multiple comparisons were controlled using the Benjamini–Hochberg procedure. Analysis-specific significance criteria are described in the corresponding subsections. All analyses were performed using R or Python. Randomized procedures used prespecified seeds, and the analytical code, software versions, and detailed parameter settings were archived to support reproducibility. All datasets were previously collected and de-identified; ethical approval and informed consent were obtained in the original studies.
Results
Selection of ferroptosis-related genes and genetic instruments
A total of 483 ferroptosis-related genes were obtained from FerrDb V2 (Figure 1). Among these, 315 genes were matched to the eQTLGen dataset and had at least one candidate cis-expression quantitative trait locus (cis-eQTL). After linkage disequilibrium clumping, 250 genes retained at least three independent candidate instruments. Following outcome-variant lookup, allele harmonization, and quality control, 226 genes yielded valid inverse-variance weighted (IVW) estimates and were included in the discovery-stage Mendelian randomization (MR) analysis (Supplementary File 1). All 3,578 instruments retained in the discovery-stage analysis had F statistics >10 (minimum, 29.72; median, 70.76), indicating no evidence of weak-instrument bias. Among the 34 discovery-stage candidate genes, the median F-statistic was 67.22, with a minimum of 29.72.
Discovery-stage MR identifies ferroptosis-related genes associated with GBM susceptibility
Among the 226 genes yielding valid IVW estimates, 34 met the prespecified discovery-stage criteria of IVW P < 0.05 and Benjamini–Hochberg false discovery rate (BH-FDR) < 0.20, comprising 19 inverse and 15 positive associations with GBM susceptibility (Figure 2A). The strongest statistical evidence was observed for RPTOR (OR = 0.809, 95% CI 0.737–0.887; P = 7.02 × 10⁻6; BH-FDR = 0.0012) and PLA2G6 (OR = 1.568, 95% CI 1.281–1.920; P = 1.08 × 10⁻5; BH-FDR = 0.0012). Bayesian weighted Mendelian randomization (BWMR) estimates were nominally significant and directionally concordant with the IVW estimates for all 34 candidate genes (Figure 2A). MR-Egger intercept tests provided no evidence of directional horizontal pleiotropy. Cochran's Q test detected heterogeneity only for MAP1LC3A (P = 0.043), whereas MR-PRESSO global tests identified no significant outlier distortion among the 33 evaluable genes. MR-PRESSO could not be performed for SLC7A11 because only three instruments were available (Supplementary File 1). Gene-specific leave-one-out analyses, method-comparison plots, and funnel plots for the four subsequently replicated genes are presented in Supplementary Figure 1. The 34 discovery-stage candidates were subsequently evaluated using an independent eQTL dataset. Of these, 26 had sufficient instruments for replication-stage MR, and four met the prespecified replication criteria.
Independent MR replication supports four discovery-stage candidates
Of the 34 discovery-stage candidates, 26 had at least one eligible cis-eQTL instrument in GTEx V10 whole blood and were included in the replication-stage MR analysis. Thirteen genes were represented by a single instrument and were analyzed using the Wald ratio, whereas the remaining 13 genes had two or more instruments and were analyzed using IVW. Four genes met the prespecified replication criteria of P < 0.05, BH-FDR < 0.20, and an effect direction concordant with the discovery-stage estimate (Figure 2B; Supplementary File 1).
Higher genetically predicted expression of ATG7 (OR = 0.523, 95% CI 0.330–0.831; P = 0.0061; BH-FDR = 0.0976), RPTOR (OR = 0.718, 95% CI 0.563–0.915; P = 0.0075; BH-FDR = 0.0976), and MAP1LC3A (OR = 0.830, 95% CI 0.717–0.959; P = 0.0117; BH-FDR = 0.1012) was associated with reduced GBM susceptibility. In contrast, higher genetically predicted CHMP6 expression was associated with increased susceptibility (OR = 1.378, 95% CI 1.032–1.838; P = 0.0295; BH-FDR = 0.1916). The directions of effect for all four genes were consistent with those observed in the discovery-stage analysis. No significant heterogeneity was detected among the genes for which Cochran's Q could be calculated (Supplementary File 1). Because most replication estimates were based on only one or two instruments, formal tests of horizontal pleiotropy and outlier distortion were applicable to only a limited subset of genes (Supplementary File 1). Corresponding diagnostic plots for MAP1LC3A, RPTOR, and CHMP6 are provided in Supplementary Figure 2. ATG7 was not eligible for multi-instrument diagnostic analyses because its replication estimate was derived from a single-instrument Wald ratio.
Cross-cohort transcriptomic evaluation prioritizes MAP1LC3A
The four genes supported by both the discovery- and replication-stage MR analyses were evaluated across three independent transcriptomic cohorts representing different expression platforms (Figure 3; Table 2; Supplementary Figure 3; Supplementary File 1). MAP1LC3A expression was consistently reduced in tumor tissue across all three cohorts: GSE196533 (log₂FC = −1.553, transcriptome-wide FDR = 3.21 × 10⁻8), GSE4290 (log₂FC = −1.243, FDR = 3.55 × 10⁻12), and GSE116520 tumor core versus non-neoplastic control (log₂FC = −1.204, FDR = 9.78 × 10⁻8). In GSE116520, MAP1LC3A expression was also lower in peritumoral tissue than in non-neoplastic controls (log₂FC = −1.056, FDR = 2.85 × 10⁻6), with a significant decreasing trend from control through peritumoral tissue to tumor core (trend coefficient = −0.531, FDR = 8.59 × 10⁻6).
Random-effects meta-analysis confirmed significantly lower MAP1LC3A expression in tumor tissue (pooled log₂FC = −1.273, 95% CI −1.625 to −0.920; Hartung–Knapp P = 0.0041; BH-FDR = 0.016), with no evidence of between-study heterogeneity (I2 = 0%; Supplementary File 1). RPTOR expression was consistently lower across all three cohorts and reached transcriptome-wide significance in GSE4290, although its pooled estimate was not statistically significant (log₂FC = −0.258, 95% CI −0.655 to 0.139; BH-FDR = 0.196; I2 = 42.3%). CHMP6 expression was consistently higher in tumor tissue and reached significance in GSE4290, whereas the pooled estimate remained non-significant (log₂FC = 0.150, 95% CI −0.130 to 0.431; BH-FDR = 0.196; I2 = 52.0%). ATG7 showed small, directionally inconsistent differences across cohorts and no significant pooled association (log₂FC = 0.036, 95% CI −0.073 to 0.146; BH-FDR = 0.291; I2 = 0%). Thus, among the four MR-replicated genes, MAP1LC3A showed the strongest and most consistent evidence of tumor-associated differential expression.
Single-cell virtual knockout reveals reproducible target-specific transcriptional perturbations
The four MR-replicated genes were evaluated in 4,916 eligible malignant cells from 20 adult IDH-wild-type GBM tumors in GSE131928. ATG7, RPTOR, MAP1LC3A, and CHMP6 were detected in 42.78%, 45.89%, 46.89%, and 31.90% of eligible malignant cells, respectively, supporting their inclusion in the virtual knockout analysis (Supplementary Figure 4; Supplementary File 1). To minimize imbalance in patient representation, 120 cells were randomly sampled from each tumor, yielding a patient-balanced dataset of 2,400 malignant cells. Each target gene was evaluated across five independently seeded runs, resulting in 20 virtual knockout analyses.
Using the prespecified criterion of BH-FDR < 0.05 in at least three of five runs, virtual knockout identified three robust downstream genes for ATG7, 15 for RPTOR, four for MAP1LC3A, and seven for CHMP6 (Figure 4A; Supplementary Figure 5). The RPTOR consensus set comprised RND3, NKAIN4, CHI3L1, CDKN1A, BCAN, PDGFRA, OLIG1, LHFPL3, ENO2, HILPDA, LGALS3, ANXA1, CNTN1, NAMPT, and SCRG1. The MAP1LC3A consensus set included RND3, CD24, BCAN, and S100B, whereas the ATG7 and CHMP6 consensus sets contained three and seven genes, respectively. Applying the more stringent significance criterion in at least four of five runs reduced the consensus sets to two ATG7-associated genes, nine RPTOR-associated genes, one MAP1LC3A-associated gene, and four CHMP6-associated genes. Collectively, these analyses identified reproducible, target-specific transcriptional perturbations within the inferred malignant-cell regulatory network.
Functional enrichment and shared-network analyses identify convergent adhesion-related responses
The four target-specific consensus sets comprised 17 unique downstream genes. Network analysis identified RND3 as the only gene shared by all four virtual knockouts, whereas BCAN, CD24, and NKAIN4 were each shared by three of the four virtual knockouts. CHI3L1, LHFPL3, and PDGFRA were shared by two targets, whereas the remaining ten genes were target-specific (Figure 4B,C). The largest absolute pairwise overlap occurred between RPTOR and CHMP6, which shared six downstream genes. Based on Jaccard similarity, the greatest proportional overlap was observed between ATG7 and CHMP6 (Jaccard index = 0.429), followed by RPTOR–CHMP6 and MAP1LC3A–CHMP6 (both 0.375).
Gene Ontology analysis of the pooled 17-gene consensus set identified ten significantly enriched terms after Benjamini–Hochberg correction (Figure 4D; Supplementary Figure 6). Enriched biological process terms included cell adhesion (BH-FDR = 0.0028), positive regulation of cell population proliferation (BH-FDR = 0.0028), inflammatory response (BH-FDR = 0.0139), positive regulation of the ERK1/ERK2 cascade (BH-FDR = 0.0165), and cell–cell adhesion (BH-FDR = 0.0196). Significant cellular component terms included cell surface, extracellular region, plasma membrane, and extracellular matrix, whereas carbohydrate binding was the only significantly enriched molecular function term. Cell adhesion remained significantly enriched when the analysis was restricted to genes shared by at least two targets and when the more stringent four-of-five-run consensus criterion was applied. No KEGG or Reactome pathway remained significant after BH correction.
Target-specific enrichment was most extensive for RPTOR, whose 15-gene consensus set was enriched for four biological process terms and four cellular component terms (Supplementary Figure 7). The MAP1LC3A consensus set was enriched for cell adhesion (BH-FDR = 8.74 × 10⁻4) and central nervous system development (BH-FDR = 0.0364), whereas the CHMP6 consensus set was enriched for cell adhesion (BH-FDR = 0.0075). No Gene Ontology term reached BH-FDR < 0.05 for the three-gene ATG7 consensus set.
DATA AVAILABILITY:
Public transcriptomic datasets are available from GEO under accession numbers GSE196533, GSE4290, GSE116520, and GSE131928. The GBM outcome summary statistics are deposited under controlled access in the European Genome-phenome Archive (EGA), dataset EGAD00010001657 (https://ega-archive.org/datasets/EGAD00010001657). Access is administered by the responsible Data Access Committee and requires an approved application and Data Access Agreement. Under the applicable agreement, the authors are not authorized to redistribute the files or deposit them in a public repository. eQTL summary data are available from the eQTLGen Consortium and GTEx according to their respective access and use conditions. The analysis scripts supporting this study are provided as Supplementary Coding File 1 and Supplementary Coding File 2.
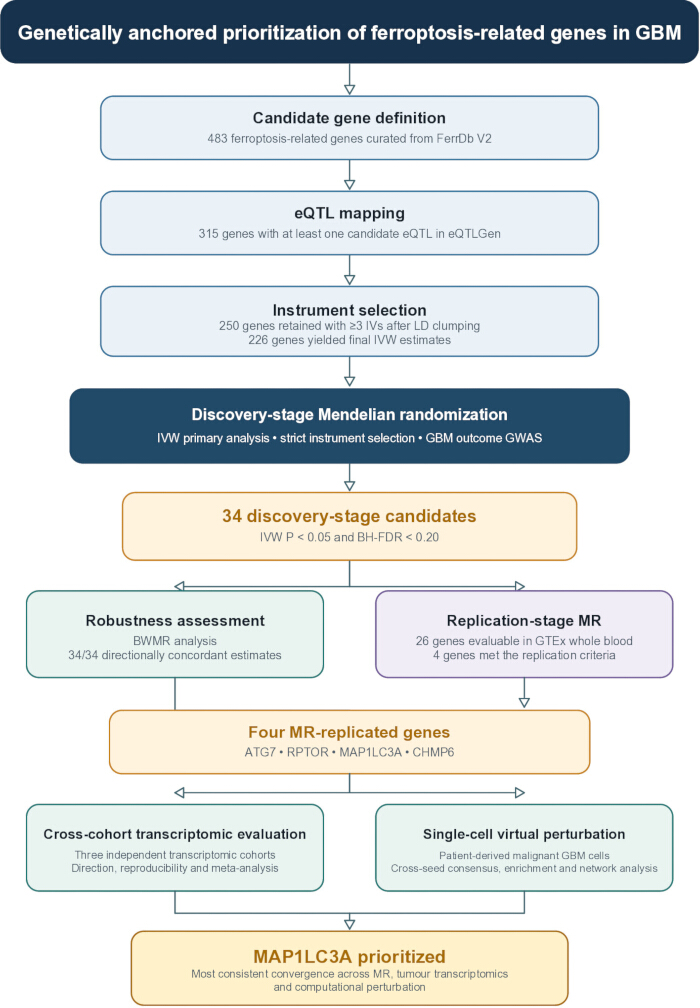
Figure 1: Study design and evidence-integration framework for the genetically anchored prioritization of ferroptosis-related genes in glioblastoma. Ferroptosis-related genes curated from FerrDb V2 were mapped to eQTLGen, screened for independent cis-expression quantitative trait locus (cis-eQTL) instruments, and evaluated by discovery-stage Mendelian randomization (MR). Of the 483 curated genes, 315 had at least one candidate cis-eQTL, 250 retained at least three independent instruments after linkage disequilibrium (LD) clumping, and 226 yielded valid inverse-variance weighted (IVW) estimates following outcome-variant lookup and allele harmonization. Thirty-four genes met the discovery-stage criteria, after which Bayesian weighted Mendelian randomization (BWMR) was used to assess robustness. Twenty-six genes were subsequently evaluable in replication-stage MR using GTEx V10 whole-blood cis-eQTLs. Four genes (ATG7, RPTOR, MAP1LC3A, and CHMP6) met the replication criteria and were further evaluated across three independent transcriptomic cohorts and by virtual perturbation in patient-derived malignant cells. Integration of these complementary analyses prioritized MAP1LC3A for further investigation. BWMR = Bayesian weighted Mendelian randomization; eQTL = expression quantitative trait locus; IVW = inverse-variance weighted; LD = linkage disequilibrium; MR = Mendelian randomization. Please click here to view a larger version of this figure.
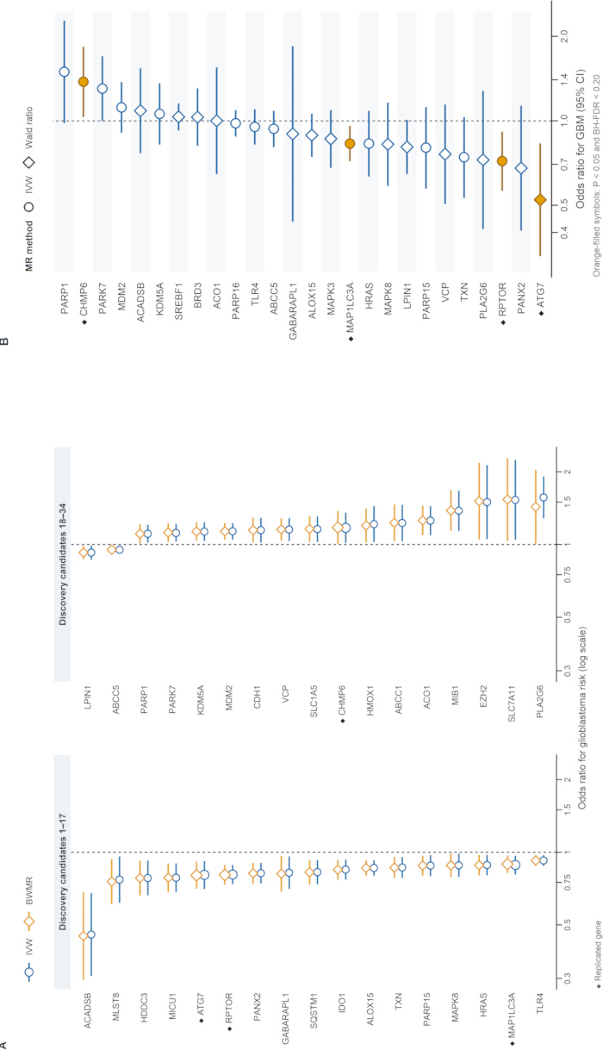
Figure 2: Discovery-stage robustness and independent replication of genetically predicted ferroptosis-related gene effects on glioblastoma risk. (A) Paired forest plots comparing inverse-variance weighted (IVW) and Bayesian weighted Mendelian randomization (BWMR) estimates for the 34 genes meeting the discovery-stage criteria of IVW P < 0.05 and Benjamini–Hochberg false discovery rate (BH-FDR) < 0.20. Squares preceding gene names denote genes subsequently supported in the independent replication analysis. The triangle identifies LPIN1, for which the IVW and BWMR estimates showed discordant effect directions. (B) Forest plot of the 26 genes evaluated in the replication-stage dataset. IVW estimates are shown for genes with at least two instruments, whereas Wald-ratio estimates are shown for genes with a single instrument. Orange-filled symbols identify ATG7, RPTOR, MAP1LC3A, and CHMP6, which met the replication criteria (P < 0.05 and BH-FDR < 0.20). Points and horizontal lines represent odds ratios (ORs) and 95% confidence intervals (CIs), respectively; the vertical dashed line indicates OR = 1. ORs are displayed on a logarithmic scale. GBM = glioblastoma. Please click here to view a larger version of this figure.
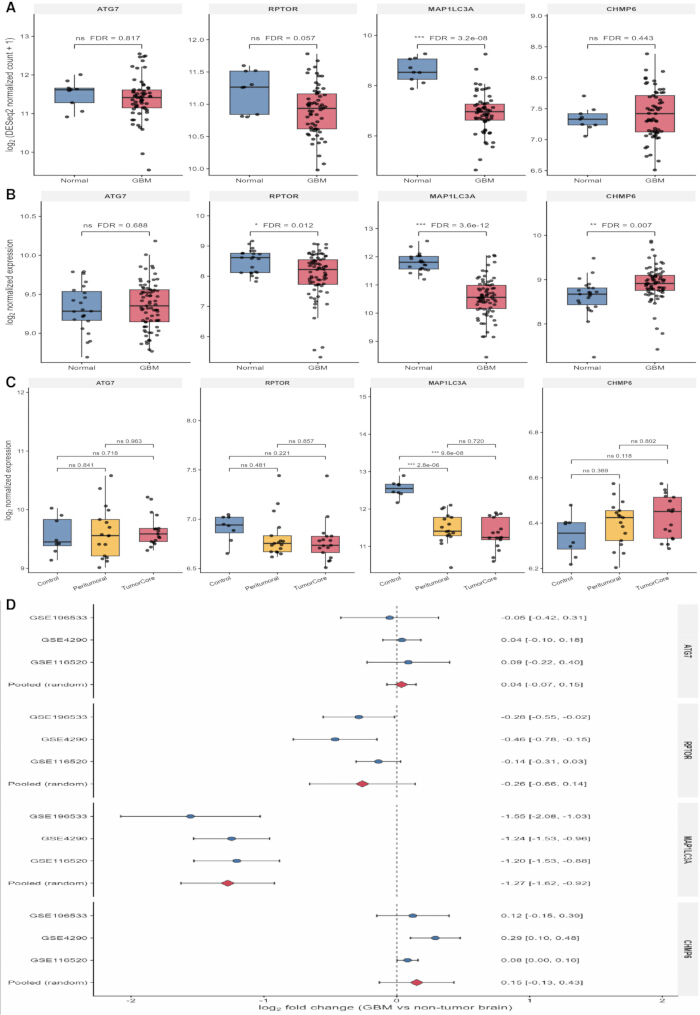
Figure 3: Cross-cohort transcriptomic evaluation of the four MR-replicated genes. Expression of ATG7, RPTOR, MAP1LC3A, and CHMP6 in GSE196533 (61 grade 4 glioma specimens annotated as GBM in the deposited metadata and nine non-neoplastic brain specimens); (A) GSE4290 (77 GBM and 23 non-tumor brain specimens); (B) and GSE116520 (17 tumor-core, 17 patient-matched peritumoral, and eight non-neoplastic control specimens); (C) Boxes indicate the median and interquartile range (IQR), whiskers extend to 1.5 × IQR, and points represent individual samples. (D) Study-specific log₂ fold changes and random-effects meta-analysis comparing tumor or tumor-core tissue with non-neoplastic brain tissue. Points and horizontal lines indicate study-specific estimates and 95% confidence intervals, whereas diamonds represent restricted maximum-likelihood pooled estimates with Hartung–Knapp inference. Positive values indicate higher expression in tumor tissue. FDR = false discovery rate; GBM = glioblastoma; MR = Mendelian randomization. Please click here to view a larger version of this figure.
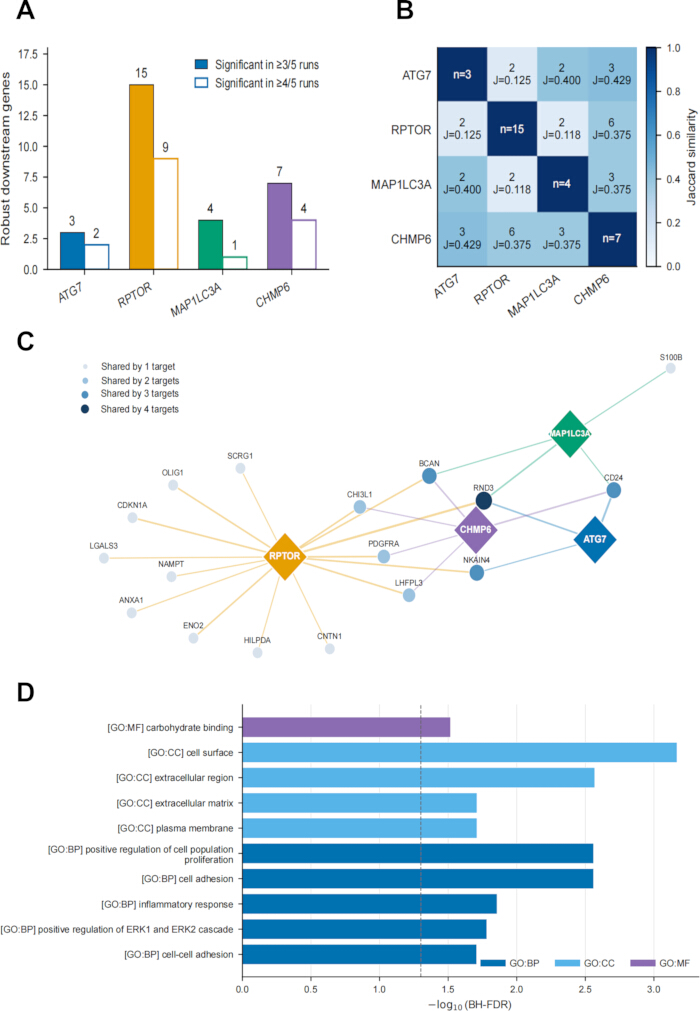
Figure 4: Cross-seed consensus and functional convergence of single-cell virtual knockouts in malignant glioblastoma cells. (A) Numbers of robust downstream genes identified for each target using the prespecified criterion of significance in at least three of five runs and the more stringent four-of-five-runs sensitivity criterion. (B) Pairwise overlap of robust downstream genes; cells report overlap counts and Jaccard similarity coefficients. (C) Bipartite network linking the four virtual-knockout targets (diamonds) to robust downstream genes (circles). Edge colors denote the perturbed target, whereas circle size and color intensity indicate the number of targets sharing each downstream response. Edges represent associations between reproducible computational perturbations rather than direct molecular interactions. (D) Significant Gene Ontology enrichment of the pooled 17-gene consensus set. Bar length represents −log10(BH-FDR), the dashed line indicates the significance threshold (BH-FDR = 0.05), and colors denote biological process (BP), cellular component (CC), and molecular function (MF). Functional enrichment analysis used the 1,004-gene patient-balanced regulatory-network background. No KEGG or Reactome pathway remained significant after Benjamini–Hochberg correction. Abbreviations: BH-FDR = Benjamini–Hochberg false discovery rate; BP = biological process; CC = cellular component; GO = Gene Ontology; KEGG = Kyoto Encyclopedia of Genes and Genomes; MF = molecular function. Please click here to view a larger version of this figure.
Table 1: Overview of data sources and their analytical roles in the study. Sample counts represent the observations included in the present analyses. BH-FDR = Benjamini–Hochberg false discovery rate; cis-eQTL = cis-expression quantitative trait locus; EGA = European Genome-phenome Archive; GBM = glioblastoma; GTEx = Genotype-Tissue Expression; GWAS = genome-wide association study; IV = instrumental variable; MR = Mendelian randomization; RNA-seq = RNA sequencing. Please click here to download this Table.
Table 2: Cross-cohort transcriptomic evidence for the four MR-replicated genes. Values represent log₂ fold changes for GBM or tumor-core tissue relative to non-neoplastic brain tissue. Pooled estimates were obtained using restricted maximum-likelihood random-effects models with Hartung–Knapp inference. CI = confidence interval; FDR = false discovery rate. Please click here to download this Table.
Supplementary Figure 1: Discovery-stage Mendelian randomization sensitivity analyses for the four replicated genes. MAP1LC3A, ATG7, RPTOR, and CHMP6 are each presented as follows: (A) leave-one-out analysis; (B) method-comparison scatter plot; and (C) funnel plot.Please click here to download this file.
Supplementary Figure 2: Replication-stage Mendelian randomization diagnostic plots for the three replicated genes with multiple instruments. MAP1LC3A, RPTOR, and CHMP6 are each presented as follows: (A) method-comparison scatter plot; and (B) funnel plot. ATG7 was estimated using a single-instrument Wald ratio and was therefore not eligible for multi-instrument diagnostic plots.Please click here to download this file.
Supplementary Figure 3: Principal component analysis of the three independent transcriptomic cohorts. (A) GSE196533 RNA-sequencing cohort. (B) GSE4290 Affymetrix GPL570 cohort. (C) GSE116520 Illumina GPL10558 cohort. Principal component analysis was performed using the 500 genes or probes with the greatest within-cohort variance. Each point represents a biological sample; colors indicate tissue groups; and axis labels report the variance explained by each principal component.Please click here to download this file.
Supplementary Figure 4: Detectability of the four MR-replicated genes in adult malignant GBM cells. (A) Overall detection rates of ATG7, RPTOR, MAP1LC3A, and CHMP6 among 4,916 malignant cells from 20 adult IDH-wild-type GBM tumors in GSE131928/SCP393. (B) Patient-level detection rates for the same genes. Color indicates the percentage of malignant cells with TPM > 0.Please click here to download this file.
Supplementary Figure 5: Cross-seed reproducibility of virtual-knockout downstream signals. (A) The number of BH-FDR-significant downstream genes identified across five independent runs for each target. Points represent random seeds, and horizontal bars indicate medians. (B) Downstream genes significant in at least three of five runs. The x-axis shows the number of significant runs, colors identify the perturbed target, and point size represents the median scTenifoldKnk Z statistic. The target gene itself was excluded.Please click here to download this file.
Supplementary Figure 6: Pooled, shared, and strict-threshold enrichment sensitivity analyses. Functional enrichment of (A) the pooled consensus defined by significance in at least three of five runs; (B) genes shared by at least two targets under the three-of-five criterion; (C) the pooled strict consensus defined by significance in at least four of five runs; and (D) genes shared by at least two targets under the four-of-five criterion. The x-axis shows −log₁₀(nominal P), point size reflects the overlap count, and colors denote the annotation database. Filled points reached BH-FDR < 0.05, whereas open points denote exploratory terms with nominal P < 0.05. The 1,004-gene regulatory-network background was used throughout.Please click here to download this file.
Supplementary Figure 7: Target-specific functional enrichment of robust virtual-knockout responses. Enrichment of robust downstream genes following virtual knockout of (A) ATG7; (B) RPTOR; (C) MAP1LC3A; and (D) CHMP6. The x-axis shows −log₁₀(nominal P), point size reflects the overlap count, and colors denote GO: BP, GO: CC, GO: MF, KEGG, or Reactome. Filled points reached BH-FDR < 0.05, whereas open points denote exploratory terms with nominal P < 0.05. The 1,004 genes comprising the patient-balanced regulatory network served as the enrichment background.Please click here to download this file.
Supplementary File 1: Supplementary tables supporting the multistage prioritization of ferroptosis-related genes associated with glioblastoma susceptibility. This supplementary file contains all supplementary tables supporting the genetic, transcriptomic, and single-cell analyses. It includes the screening and selection of ferroptosis-related genes and genetic instruments; complete discovery- and replication-stage Mendelian randomization results together with sensitivity analyses, including heterogeneity, horizontal pleiotropy, and MR-PRESSO assessments; cohort characteristics, differential-expression analyses, and cross-cohort meta-analysis of genetically prioritized genes; and the single-cell virtual knockout analyses, reproducibility assessments, functional enrichment analyses, and shared-network results.Please click here to download this file.
Supplementary Coding File 1: R and Python scripts used for the Mendelian randomization, transcriptomic, single-cell virtual knockout, functional enrichment, and network analyses described in this study.Please click here to download this file.
Supplementary Coding File 2: Supporting analysis scripts, plotting routines, and workflow utilities used to generate the study results, figures, and supplementary outputs.Please click here to download this file.
Discussion
This study integrated genetic association, replication-stage Mendelian randomization (MR), tumor transcriptomics, and patient-derived single-cell modeling to prioritize ferroptosis-related genes associated with glioblastoma (GBM) susceptibility. Screening 483 curated genes against a GBM genome-wide association study (GWAS) comprising 6,183 cases and 18,169 controls identified 34 discovery-stage candidates, four of which—ATG7, RPTOR, MAP1LC3A, and CHMP6—were supported in the replication analysis using an independent expression quantitative trait locus (eQTL) resource. The evidence became progressively more selective beyond the genetic analyses. MAP1LC3A was consistently downregulated across three independent tumor cohorts and remained significant in the cross-cohort meta-analysis. This tumor-expression pattern complemented the protective association observed in the MR analyses, although the two approaches address distinct aspects of disease biology. RPTOR and CHMP6 showed directionally consistent but less conclusive transcriptomic evidence, whereas ATG7 lacked reproducible tissue-level support. Virtual knockout further revealed target-specific, but partially overlapping, transcriptional responses in malignant cells. Collectively, these sequential analytical layers refined the initial MR findings by distinguishing candidates with varying degrees of disease-relevant support, with MAP1LC3A emerging as the strongest overall candidate.
Much of the existing human evidence linking ferroptosis to glioma has been derived from tumor-expression studies. Analyses of TCGA, CGGA, and other public cohorts have repeatedly identified ferroptosis-related signatures associated with survival, tumor grade, molecular characteristics, and immune features9,27. Although these studies established the clinical relevance of ferroptosis-related transcriptional programs, expression profiles obtained from established tumors cannot distinguish susceptibility-associated genes from transcriptional changes that arise during tumor progression or reflect differences in cellular composition. Genetic analyses provide a complementary perspective. Robinson and colleagues integrated glioma GWAS data with brain and whole-blood eQTL datasets using MR and colocalization, prioritizing putative susceptibility genes with tissue-dependent effects and demonstrating limited concordance between blood- and brain-derived estimates11. More recently, an integrative eQTL- and pQTL-based MR study combined genetic evidence with differential-expression and colocalization analyses to prioritize GPX7 and CXCL10 for further evaluation in GBM12. In contrast, the present study began with a predefined ferroptosis-related gene set and evaluated genetically prioritized candidates through replication-stage MR, tumor transcriptomics, and cell-resolved computational perturbation. The progressive refinement from 34 discovery-stage associations to four replicated genes, and ultimately to MAP1LC3A as the only gene showing statistically significant cross-cohort differential expression, illustrates the discriminatory value of integrating multiple complementary analytical approaches. Importantly, the transcriptomic analyses were not intended to validate the blood-derived genetic instruments but rather to determine whether genetically prioritized genes also exhibited reproducible disease-relevant expression patterns.
MAP1LC3A is of particular interest because the present findings extend its previous characterization as a tumor-associated and prognostic marker. A previous multi-cohort bioinformatic study incorporated MAP1LC3A into a six-gene signature associated with GBM survival and recurrence and also reported altered MAP1LC3A methylation, although its contribution to disease susceptibility remained unresolved28. Here, higher genetically predicted MAP1LC3A expression was consistently associated with lower GBM susceptibility in both MR stages. Furthermore, MAP1LC3A was reproducibly downregulated across three independent tumor cohorts despite differences in expression platforms, sample compositions, and analytical methodologies, and the pooled meta-analysis estimate showed no detectable between-study heterogeneity. Although these findings do not establish that reduced MAP1LC3A expression initiates GBM, they provide stronger evidence linking the gene to disease susceptibility than tumor differential-expression analyses alone. MAP1LC3A encodes LC3A isoforms within the mammalian ATG8 protein family. Bai and colleagues demonstrated that LC3A variant 1 undergoes phosphatidylethanolamine conjugation to generate LC3A-II and localizes to autophagosomes during induced autophagy29. Autophagic ferritin turnover has also been shown to influence ferroptosis sensitivity in GBM cells, including under cystine deprivation and in ALDH1A3-dependent models30,31. However, these studies primarily examined total LC3-II or LC3B rather than MAP1LC3A specifically. In the present single-cell analyses, virtual perturbation of MAP1LC3A produced reproducible downstream responses enriched for cell-adhesion-related processes. Together, these observations identify MAP1LC3A as a focused candidate for investigating how autophagy-associated regulation, ferroptosis susceptibility, and malignant-cell behavior intersect in GBM.
The remaining MR-replicated genes received varying levels of support from subsequent analyses. Higher genetically predicted RPTOR expression was associated with lower GBM susceptibility in both MR stages, and its expression was consistently lower across all three tumor cohorts, although the pooled estimate did not reach statistical significance. Virtual knockout of RPTOR produced the largest set of reproducible downstream transcriptional changes, with enrichment involving ERK signaling, inflammatory responses, cell proliferation, and cell adhesion. Although these findings are consistent with the established role of RPTOR as an mTORC1 scaffold, the magnitude of the transcriptional response should not be interpreted as evidence of a stronger causal effect32. CHMP6 likewise demonstrated concordant MR associations across both stages, with higher genetically predicted expression associated with increased GBM susceptibility. Although CHMP6 expression was consistently elevated across all three tumor cohorts, the pooled confidence interval included the null, and between-study heterogeneity was moderate. Experimental evidence demonstrating that CHMP6-dependent ESCRT-III membrane repair suppresses ferroptotic cell death provides a plausible mechanistic context, although these findings were obtained outside GBM models33. In contrast, ATG7 showed a replicated protective genetic association but no reproducible tumor-expression pattern. Virtual knockout identified only three robust downstream genes, and no functional category remained significant after multiple-testing correction. Previous experimental studies have implicated ATG7-dependent autophagy in GBM adaptation and treatment response34,35, but these observations do not resolve the comparatively weak cross-platform support observed here. Accordingly, RPTOR, CHMP6, and ATG7 remain plausible secondary candidates, whereas MAP1LC3A demonstrated the strongest convergence across the genetic, transcriptomic, and computational perturbation analyses.
The virtual perturbation analyses did not identify a single downstream pathway shared by all four prioritized genes. Instead, reproducible transcriptional responses showed only partial overlap, with RND3 as the only downstream gene shared by all four target-specific networks. The clearest functional convergence involved cell-adhesion and extracellular or cell-surface processes, and enrichment for cell adhesion remained significant under the more stringent cross-seed criterion. No KEGG or Reactome pathway remained significant after multiple-testing correction. This observation is notable because, although the candidate genes were drawn from a curated set of ferroptosis-related genes, their predicted downstream effects in malignant GBM cells were not dominated by canonical ferroptosis pathways. Rather, their contribution to GBM susceptibility may involve broader cellular processes within which ferroptosis-related machinery operates. The present analyses do not establish a shared molecular mechanism or identify RND3 as a causal mediator. Instead, they highlight a limited set of malignant-cell programs, particularly those related to cell adhesion, that warrant future experimental investigation.
This study should be interpreted as a staged prioritization framework rather than a definitive assignment of causal genes. No individual analytical layer was considered conclusive; instead, discovery-stage associations were successively evaluated using BWMR, an independent eQTL resource, three transcriptomic cohorts, and patient-derived malignant-cell regulatory modeling. Several limitations should be acknowledged. First, the BH-FDR discovery threshold of < 0.20 was intended for candidate screening rather than confirmatory inference, and only 26 of the 34 discovery-stage candidates were evaluable in replication. Second, several genes were represented by relatively few genetic instruments, and formal gene-level power analyses were not performed; consequently, weak or null associations should be interpreted cautiously. The three-instrument eligibility threshold increased gene coverage but limited the range and stability of sensitivity analyses for genes represented by only three or four variants. Although all retained discovery-stage instruments exceeded the conventional F > 10 threshold and candidates were further evaluated using BWMR and independent replication, these safeguards do not fully compensate for sparse instruments; such estimates should therefore remain exploratory. Third, both eQTL resources were derived from whole blood and may not accurately capture brain- or tumor-specific regulatory effects. Fourth, the available GBM GWAS summary statistics lacked the information required for Steiger directionality testing and formal colocalization analyses. Consequently, it remains uncertain whether the eQTL and GBM association signals at each locus arise from the same causal variant or from distinct variants in linkage disequilibrium. Although BWMR is designed to accommodate widespread horizontal pleiotropy and outlying instruments, concordance between IVW and BWMR cannot exclude residual pleiotropy or substitute for formal colocalization analyses. In addition, the transcriptomic cohorts evaluated established tumors rather than disease susceptibility, and one cohort consisted of grade 4 glioma specimens rather than exclusively IDH-wild-type GBM. Finally, the single-cell analyses were restricted to malignant cells from a single dataset and modeled regulatory perturbation computationally rather than experimentally; they did not evaluate non-malignant cells within the tumor microenvironment or directly reproduce gene perturbation in vitro or in vivo. Accordingly, the underlying causal variants, cell-type-specific mechanisms, and biological consequences remain to be established.
Among the four replicated genes, MAP1LC3A showed the most consistent support across the genetic, transcriptomic, and single-cell analyses. RPTOR, CHMP6, and ATG7 retained evidence from the two-stage MR analyses but demonstrated less consistent support in the subsequent transcriptomic and perturbation analyses. Accordingly, MAP1LC3A should be regarded as a prioritized candidate for further investigation rather than an established causal gene or therapeutic target. Future studies should first determine whether the eQTL and GBM association signals colocalize using complete locus-level datasets together with brain- or tumor-specific regulatory resources. Subsequent bidirectional perturbation studies in patient-derived GBM models could then examine ferroptosis sensitivity, lipid peroxidation, cell survival, and the adhesion-related transcriptional programs identified by the computational analyses. Such experiments will be necessary to distinguish effects on inherited disease susceptibility from those influencing the behavior of established tumor cells and to directly test the convergent associations identified in this study.
Disclosures
The authors declare no competing interests.
Acknowledgements
The authors acknowledge the Cancer Genomics team at The Institute of Cancer Research for providing access to the glioma GWAS summary statistics through the European Genome-phenome Archive (dataset EGAD00010001657). The original generation of these data was supported by Cancer Research UK, including the Bobby Moore Fund, the Wellcome Trust, and the DJ Fielding Medical Research Trust (C1298/A8362).
Materials
| Name | Company | Catalog Number | Comments |
|---|---|---|---|
| BWMR | R package | BWMR | Bayesian weighted Mendelian randomization |
| DESeq2 | Bioconductor | Version 1.46.0 | RNA-sequencing differential-expression analysis |
| FerrDb V2 | FerrDb | Version 2 | Source of 483 curated ferroptosis-related genes |
| Glioblastoma bulk microarray | NCBI Gene Expression Omnibus | GSE4290 | Transcriptomic evaluation cohort |
| Glioblastoma GWAS summary statistics | European Genome-phenome Archive | EGAD00010001657 | Controlled-access outcome data; 6,183 cases and 18,169 controls |
| Glioblastoma Smart-seq2 single-cell RNA sequencing | NCBI Gene Expression Omnibus | GSE131928 | Malignant-cell virtual-knockout analysis |
| Grade 4 glioma bulk RNA sequencing | NCBI Gene Expression Omnibus | GSE196533 | Transcriptomic evaluation cohort |
| GTEx whole-blood cis-eQTL summary statistics | Genotype-Tissue Expression project | GTEx V10 | Replication-stage exposure data |
| limma | Bioconductor | Version 3.62.2 | Microarray differential-expression analysis |
| metafor | R package | Version 4.8-0 | Random-effects meta-analysis |
| R | R Foundation for Statistical Computing | Version 4.4.2 | Statistical computing environment |
| scTenifoldKnk | R package | Version 1.0.3 | Single-cell virtual-knockout analysis |
| Tumour-core and peritumoural bulk microarray | NCBI Gene Expression Omnibus | GSE116520 | Transcriptomic evaluation cohort |
| TwoSampleMR | R package | Version 0.6.29 | Two-sample Mendelian randomization |
| Whole-blood cis-eQTL summary statistics | eQTLGen Consortium | eQTLGen | Discovery-stage exposure data |
References
- Weller M, et al. EANO guidelines on the diagnosis and treatment of diffuse gliomas of adulthood. Nat Rev Clin Oncol. 2021;18:170-186.
- Stupp R, et al. Radiotherapy plus concomitant and adjuvant temozolomide for glioblastoma. N Engl J Med. 2005;352:987-996.
- McBain C, et al. Treatment options for progression or recurrence of glioblastoma: a network meta-analysis. Cochrane Database Syst Rev. 2021;5:CD013579.
- Dixon SJ, et al. Ferroptosis: an iron-dependent form of nonapoptotic cell death. Cell. 2012;149:1060-1072.
- Stockwell BR, et al. Ferroptosis: A regulated cell death nexus linking metabolism, redox biology, and disease. Cell. 2017;171:273-285.
- Minami JK, et al. CDKN2A deletion remodels lipid metabolism, priming glioblastoma for ferroptosis. Cancer Cell. 2023;41:1048-1060.e1049.
- Kram H, et al. Glioblastoma relapses show increased markers of vulnerability to ferroptosis. Front Oncol. 2022;12:841418.
- Miao Z, et al. A targetable PRR11-DHODH axis drives ferroptosis- and temozolomide-resistance in glioblastoma. Redox Biol. 2024;73:103220.
- Liu HJ, et al. Ferroptosis-related gene signature predicts glioma cell death and glioma patient progression. Front Cell Dev Biol. 2020;8:538.
- Dong J, et al. Ferroptosis-related gene contributes to immunity, stemness, and predicts prognosis in glioblastoma multiforme. Front Neurol. 2022;13:829926.
- Robinson JW, et al. Transcriptome-wide Mendelian randomization study prioritizing novel tissue-dependent genes for glioma susceptibility. Sci Rep. 2021;11:2329.
- Zhang H, Wang Z, Qiao X, Wu J, Cheng C. Investigating potential drug targets for the treatment of glioblastoma: a Mendelian randomization study. BMC Cancer. 2025;25:654.
- GTEx Consortium. The GTEx Consortium atlas of genetic regulatory effects across human tissues. Science. 2020;369:1318-1330.
- Zhou N, et al. FerrDb V2: update of the manually curated database of ferroptosis regulators and ferroptosis-disease associations. Nucleic Acids Res. 2023;51:D571-D582.
- Võsa U, et al. Large-scale cis- and trans-eQTL analyses identify thousands of genetic loci and polygenic scores that regulate blood gene expression. Nat Genet. 2021;53:1300-1310.
- Melin BS, et al. Genome-wide association study of glioma subtypes identifies specific differences in genetic susceptibility to glioblastoma and non-glioblastoma tumors. Nat Genet. 2017;49:789-794.
- Zeng C, et al. Dissection of transcriptomic and epigenetic heterogeneity of grade 4 gliomas: implications for prognosis. Acta Neuropathol Commun. 2023;11:133.
- Sun L, et al. Neuronal and glioma-derived stem cell factor induces angiogenesis within the brain. Cancer Cell. 2006;9:287-300.
- Kruthika BS, et al. Transcriptome profiling reveals PDZ binding kinase as a novel biomarker in peritumoral brain zone of glioblastoma. J Neurooncol. 2019;141:315-325.
- Neftel C, et al. An integrative model of cellular states, plasticity, and genetics for glioblastoma. Cell. 2019;178:835-849.e821.
- Burgess S, Thompson SG. Avoiding bias from weak instruments in Mendelian randomization studies. Int J Epidemiol. 2011;40:755-764.
- Papadimitriou N, et al. Physical activity and risks of breast and colorectal cancer: a Mendelian randomisation analysis. Nat Commun. 2020;11:597.
- Song W, et al. Causal relationship between gut microbiota and lung squamous cell carcinoma: a bidirectional two-sample Mendelian randomization study. Postgrad Med J. 2025;101:526-534.
- Zhao J, et al. Bayesian weighted Mendelian randomization for causal inference based on summary statistics. Bioinformatics. 2020;36:1501-1508.
- Love MI, Huber W, Anders S. Moderated estimation of fold change and dispersion for RNA-seq data with DESeq2. Genome Biol. 2014;15:550.
- Ritchie ME, et al. limma powers differential expression analyses for RNA-sequencing and microarray studies. Nucleic Acids Res. 2015;43:e47.
- Yun D, et al. A novel prognostic signature based on glioma essential ferroptosis-related genes predicts clinical outcomes and indicates treatment in glioma. Front Oncol. 2022;12:897702.
- Li R, et al. Identification of candidate genes associated with prognosis in glioblastoma. Front Mol Neurosci. 2022;15:913328.
- Bai H, Inoue J, Kawano T, Inazawa J. A transcriptional variant of the LC3A gene is involved in autophagy and frequently inactivated in human cancers. Oncogene. 2012;31:4397-4408.
- Hayashima K, Kimura I, Katoh H. Role of ferritinophagy in cystine deprivation-induced cell death in glioblastoma cells. Biochem Biophys Res Commun. 2021;539:56-63.
- Wu Y, et al. ALDH1-mediated autophagy sensitizes glioblastoma cells to ferroptosis. Cells. 2022;11:4015.
- Carriere A, et al. ERK1/2 phosphorylate Raptor to promote Ras-dependent activation of mTOR complex 1 (mTORC1). J Biol Chem. 2011;286:567-577.
- Dai E, Meng L, Kang R, Wang X, Tang D. ESCRT-III-dependent membrane repair blocks ferroptosis. Biochem Biophys Res Commun. 2020;522:415-421.
- Comincini S, et al. microRNA-17 regulates the expression of ATG7 and modulates the autophagy process, improving the sensitivity to temozolomide and low-dose ionizing radiation treatments in human glioblastoma cells. Cancer Biol Ther. 2013;14:574-586.
- Wang L, et al. Autophagy mediates glucose starvation-induced glioblastoma cell quiescence and chemoresistance through coordinating cell metabolism, cell cycle, and survival. Cell Death Dis. 2018;9:213.