This study found that the absence of specific programs and positions dedicated to nursing quality management in the vast majority of trauma centers suggests an urgent need to establish relevant programs and standards for trauma centers at all levels, establish relevant databases, and develop sensitive quality indicators.
Research Article
Nursing Quality Management in Trauma Centers: A Descriptive Cross-Sectional Study
In This Article
Summary
Abstract
This descriptive study examined the current status of nursing quality management in trauma centers across 30 provinces, autonomous regions, and municipalities in China, identified existing challenges, and offered evidence-based recommendations for improvement. A self-designed questionnaire was used to collect basic information about the hospitals’ trauma centers and their nursing quality management practices. A total of 98.9% of respondents indicated that there was no nursing quality management program specifically for trauma centers; 72.2% reported the absence of a trauma quality control specialist; and 67.2% noted a lack of specialty-specific nursing quality indicators for trauma care. The most widely used quality management tools were data analysis and reporting tools (60.4%) and electronic health record systems (59.7%). Additionally, 40.1% of centers did not have a designated person responsible for trauma patient data reporting, and most trauma centers did not systematically collect patient data. It is crucial to establish nursing quality management programs and standards for trauma centers at all levels, create relevant databases, and develop sensitive quality indicators.
Introduction
Trauma represents a major global health challenge. In China, it has become the third leading cause of death, following stroke and coronary heart disease1. This alarming statistic highlights the urgent need for robust trauma care systems. Trauma centers–specialized facilities dedicated to treating severe injuries resulting from incidents such as falls, motor vehicle collisions, or gunshot wounds–are vital components of such systems. Establishing effective trauma care systems, professional treatment centers, and unified quality control standards can considerably improve patient outcomes, potentially reducing trauma-related mortality by up to 15%2. Therefore, the quality and capabilities of trauma centers are crucial to ensure patient survival and recovery.
Trauma centers in China began development in 2018, a relatively recent initiative. Their systems are not as fully developed as those in Europe or the United States3. According to data released by the National Trauma Medical Center of China in 2020, 360 regional trauma treatment systems have been established across 28 provinces, and 1,015 general hospitals have set up trauma centers4. Although this rapid expansion reflects a strong commitment to improving trauma care, the system remains in its early stages and lacks the maturity of established programs in Western countries.
Quality management, particularly in nursing care, is a cornerstone of effective trauma treatment. The quality of nursing care directly affects patient safety and recovery outcomes. However, despite national initiatives aimed at improving trauma care – such as the 2018 National Health Commission guidelines introducing 16 quality control indicators – these indicators focus primarily on medical and surgical processes, with only one item (‘the time from blood transfusion order to nurse execution’) touching upon nursing practice, and they do not constitute a systematic nursing-sensitive quality indicator set5. Although these indicators provide valuable guidance, they present an incomplete picture of the comprehensive quality management required across trauma centers. Critically, trauma nursing management extends far beyond routine ward care; it inherently involves multidisciplinary team coordination, time-critical resuscitation workflows, and seamless transitions across pre-hospital, in-hospital, and rehabilitative phases. These unique characteristics demand specialized quality management frameworks that are distinct from general hospital nursing standards. Yet, despite growing attention to trauma system development, there has been no systematic investigation into the actual state of nursing quality management structures, processes, and tools specifically within Chinese trauma centers. This evidence gap severely limits the ability of policymakers and administrators to formulate targeted, tier-specific improvement strategies.
To address this critical gap, the present study conducts a multi-regional cross-sectional survey of trauma centers across 30 provinces, autonomous regions, and municipalities, encompassing 546 institutions. Unlike prior single-center or regionally restricted studies that predominantly focused on medical quality or isolated nursing tasks, our survey systematically captures the core dimensions of nursing quality management – including personnel allocation, institutional mechanisms, tool utilization, data management, and sensitive indicator development – within a unified analytical framework. This approach allows us to not only delineate the current landscape but also quantify implementation variations across hospitals of different grades, trauma center levels, and years of establishment. The findings provide robust empirical evidence to support the development of stratified, resource-appropriate nursing quality management programs, thereby translating broad policy aspirations into actionable, locally adaptable standards. Currently, there is a substantial gap in dedicated nursing quality management programs for trauma centers in China. To address this, the present study aims to conduct a broad-scale survey of trauma centers. It seeks to understand the current landscape of quality management programs, identify variations in their implementation, and highlight areas requiring improvement. The findings offer crucial insights for healthcare providers, policymakers, and administrators, helping to guide efforts to standardize and enhance the quality of trauma care across the country.
Protocol
Study design and ethical approval
This study is a cross-sectional questionnaire survey. This study does not involve patients. It is based solely on voluntary responses from trauma center administrators. This anonymous questionnaire survey contained no items related to personal privacy. This study was granted exemption from ethical review by the Ethics Committee of Chongqing University Central Hospital (Chongqing Emergency Medical Center).
Study Population
The study employed a stratified convenience sampling strategy to recruit trauma centers from 30 provinces, autonomous regions, and municipalities across China (Chongqing, Hunan, Guizhou, Sichuan, Guangdong, Zhejiang, Jiangsu, Shandong, Henan, Hubei, Yunnan, Shaanxi, Gansu, Liaoning, Fujian, et al). The sampling frame was derived from three sources: the member hospital directory of the China Trauma Rescue and Treatment Alliance, provincial health commission-published trauma center construction lists, and the project team’s established academic collaboration network. Provinces were first stratified into three geographic regions (eastern, central, and western), and target centers were then proportionally selected from each region based on hospital grade (Grade II vs Grade III) and trauma center level (national, provincial/municipal, or district/county). In China, hospitals are classified into three grades based on their function, task, facility conditions, technical capacity, and service quality, as defined by the Ministry of Health’s Hospital Grading Management Standards. Grade III hospitals are the highest level, typically located in major cities with 500 or more beds; they provide advanced specialty care for complex and critical conditions, conduct higher education and research, and serve multiple regions. Grade II hospitals are regional facilities with 100–500 beds that deliver comprehensive medical services to multiple communities and undertake certain teaching and research tasks. Each grade is further subdivided into sub-levels (A, B, and C) based on evaluation results, with Grade III A representing the highest qualification. The research team contacted the head of each target center – typically the trauma center director or nursing department director–by phone and email to detail the study purpose, survey content, timeline, and confidentiality measures. Each participating center designated one managerial staff member or key nursing personnel directly involved in trauma care quality management as the questionnaire respondent. Sample size was estimated using Kendall’s method6, requiring 5–10 times the number of questionnaire items plus an additional 10% to account for sample loss, yielding a minimum of approximately 100 respondents; the final sample of 546 far exceeded this threshold. The inclusion criteria were as follows: hospitals had to be officially accredited trauma centers, operationally functional with dedicated staff and resources, members of the Trauma Consortium, and Grade II or above general hospitals; participants had to be personnel directly involved in the quality management of the hospital’s trauma center or trauma center quality control personnel, and willing to participate voluntarily. The exclusion criteria were as follows: hospitals in the planning or early establishment phase of a trauma center; hospitals where the trauma center exists only administratively without operational capacity. The screening process comprised two stages: a preliminary eligibility review against the National Trauma Medical Center’s establishment standards and the China Trauma Rescue and Treatment Alliance’s certification requirements, followed by formal inclusion confirmation via phone and email to verify staffing, bed capacity, and annual trauma patient volume, ensuring full compliance with all criteria.
Study instrument
A self-designed questionnaire was developed due to the lack of existing validated instruments specific to Chinese trauma centers’ nursing quality management, which are characterized by a short development history and prominent multidisciplinary collaboration features. The preliminary framework was constructed based on a literature review and core elements of trauma nursing quality management (personnel allocation, system construction, tool usage, data management, and quality indicators). Seven experts in trauma medicine and nursing management – including two chief physicians, three associate chief nurses, and two nursing department directors – were invited to conduct two rounds of Delphi consultations to evaluate the relevance, completeness, and feasibility of the questionnaire content. The expert response rate was 100% in both Delphi rounds, indicating a high level of expert engagement. The expert authority coefficients were 0.87 and 0.89, reflecting the strong representativeness and credibility of the expert opinions. Kendall’s W coefficients for the two rounds were 0.52 and 0.61 (both p < 0.001), suggesting good expert consensus after the second round. A content validity index (CVI) of 0.92 was achieved. Specifically, the item-level CVI ranged from 0.86 to 1.00, and the scale-level CVI based on the average method was 0.92, both exceeding the recommended threshold of 0.80. Finally, a small-scale pilot survey (n = 30) was conducted across 10 trauma centers of different levels to test the questionnaire’s reliability. The Cronbach’s α coefficient was 0.87, indicating good reliability and validity. The split-half reliability coefficient was 0.84, further confirming the internal consistency of the questionnaire.
The questionnaire covered basic information related to the hospital’s trauma center and its nursing quality management. The questionnaire comprised five core dimensions: personnel allocation and positions (6 items); system and mechanism construction (8 items); quality management tool usage (5 items); data management and reporting (7 items); and quality indicator development and evaluation (6 items), totaling 32 items. Most items were closed-ended with predefined response options; a small number of items utilized a 5-point Likert scale (1 = strongly disagree to 5 = strongly agree) to capture gradations in respondents’ attitudes or practices. For categorical variable items (e.g., ‘Yes/No’ options), binary scoring was applied (Yes = 1, No = 0). For ordinal variable items (e.g., ranging from ‘Strongly Reflects’ to ‘Does Not Reflect at All’), a 5-point Likert scale was used, with scores from 1 to 5 representing the lowest to the highest level, respectively. Dimension scores and the total questionnaire score were calculated by summing the scores of all items within the same construct.
The composite scores were calculated as follows: comprehensive Frequency of Quality Management Tool Usage (X1) – this score was determined by counting the number of five types of quality management tools utilized by each center (data analysis and reporting tools, electronic health record [EHR] systems, clinical audits and case studies, quality management systems, and quality improvement teams). The score ranged from 0 to 5, with higher scores indicating more comprehensive tool usage; composite Score for Nursing Quality Assessment Effectiveness (Y1) – this was based on the adoption of four effectiveness assessment methods (clinical review and improvement, clinical feedback surveys, external accreditation and data analysis monitoring), and a 5-point Likert scale was applied (1 = ‘Ineffective’ to 5 = ‘Highly Effective’). The scores for each method were summed, yielding a total score ranging from 4 to 20; data Collection Completeness Score (X5) this was based on four indicators – ‘availability of a dedicated database’, ‘presence of dedicated personnel for maintenance’, ‘presence of dedicated personnel for reporting’ and ‘reporting frequency’ – and a 5-point Likert scale was used (1 = ‘Extremely Incomplete’ to 5 = ‘Highly Complete’), with a total score ranging from 4 to 20; scientific Validity Score of Trauma Nursing Quality Indicators (Y2) – this was based on three indicators: ‘whether indicators cover the entire process’, ‘measurability’ and ‘whether they reflect true nursing quality’, and a 5-point Likert scale was applied (1 = ‘Extremely Unscientific’ to 5 = ‘Highly Scientific’), with a total score ranging from 3 to 15. All composite scores were calculated by summing the individual item scores.
Data collection process
Questionnaires were distributed via the Wenjuanxing professional platform. Before distribution, consent and cooperation were obtained from each participating institution’s head, who assisted in organizing eligible respondents. Upon first accessing the questionnaire, respondents viewed a detailed survey description (including research purpose, content, potential risks, confidentiality measures, voluntary participation principles, and right to withdraw) and were required to sign an electronic informed consent form online before proceeding. A total of 546 questionnaires were distributed, and all were effectively retrieved, yielding a 100% effective response rate. To prevent duplicate submissions from the same trauma center, the following measures were implemented: each institution designated only one eligible respondent (the trauma center manager or the person directly responsible for nursing quality management) to complete the questionnaire; the questionnaire link was distributed exclusively through institutional coordinators rather than being publicly accessible; the Wenjuanxing platform’s ‘same device restriction’ function was enabled to prevent repeated submissions from the same device. The Internet Protocol (IP) address restriction was not employed, as respondents from the same hospital may share a common external IP address, and this measure could inadvertently block legitimate responses from different institutions. After collection, quality control personnel checked the completeness of each questionnaire one by one and confirmed that all were fully completed.
To ensure data validity and a high response rate, investigators received professional training and standardized the survey process. Each investigator contacted the relevant center, obtained consent, distributed questionnaires, and explained the content and purpose in detail. After obtaining informed consent, investigators guided respondents through questionnaire completion. Throughout the process, the use of misleading statements was strictly prohibited to ensure objectivity and authenticity of responses.
Statistical analysis
Data analysis was conducted using SPSS statistical software, with a significance level of α = 0.05. Descriptive statistics for count data are presented as frequency (percentage) to clarify the distribution characteristics of each core indicator. Inter-group comparative analysis was performed using the chi-square (χ2) test. Differences among hospitals of different levels (secondary/tertiary), trauma center levels (national/provincial/municipal/district/county) and years of establishment (≤3 years/>3 years) were compared across key dimensions, including the establishment of nursing quality management plans, allocation of trauma quality control experts, setting of sensitive indicators for specialized nursing quality, database construction and use of quality management tools. Correlation analysis was conducted using Spearman’s rank correlation to explore the strength of association between the frequency of quality management tool use and the effectiveness of nursing quality assessment (composite scores from dimensions such as clinical review improvement and feedback surveys), as well as between data collection completeness and the scientific nature of quality indicators. For multivariate analysis, ‘whether a specialized trauma care quality management program was established’ was used as the binary dependent variable (Yes = 1, No = 0). For events with extremely low prevalence, Firth’s penalized maximum likelihood logistic regression was performed using the logistf package in R to identify independent factors associated with the establishment of nursing quality management programs. Variables with p < 0.1 in univariate analysis (hospital level, trauma center level, years of establishment, presence of a dedicated database, and configuration of quality control experts) were included in a multivariate logistic regression model to identify independent factors affecting the establishment of a nursing quality management plan.
Results
Sample characteristics
This research comprises four core phases (Figure 1), and 546 trauma centers from 30 provinces, autonomous regions, and municipalities participated in the survey. To eliminate potential training effects and response bias, the 30 pilot samples from the study were excluded from the final formal survey sample. These included 82 (15.0%) Grade II A hospitals, 40 (7.3%) Grade II B hospitals, 208 (38.1%) Grade III A hospitals, and 216 (39.6%) Grade III B hospitals. There were 156 (28.6%) national-level trauma centers, 171 (31.3%) provincial/municipal-level centers, and 219 (40.1%) district/county-level centers. Regarding establishment duration, 102 (18.7%) trauma centers had been established for ≤1 year, 98 (17.9%) for 2 years, 126 (23.1%) for 3 years, 117 (21.4%) for 4 years, and 103 (18.9%) for ≥5 years. Details are shown in Table 1.
Current status of nursing quality management: personnel, mechanisms, tools, and data
A total of 98.9% of respondents indicated that there was no nursing quality management program specific to trauma centers; 83.3% reported that no one was specifically responsible for nursing quality management; 72.2% stated that they did not have a trauma quality control specialist position; 67.2% noted a lack of sensitive indicators for the quality of specialist trauma care; 14.8% indicated that their existing nursing quality indicators could not truly reflect the quality of trauma nursing; 16.1% reported that no nursing quality control meetings were held; and 11.4% stated that the quality of care was not formally evaluated. Details are shown in Table 2.
As shown in Table 3, data analysis and reporting tools (60.4%) and EHR systems (59.7%) were the most widely used tools in daily quality of care management in trauma centers, followed by clinical audits and case studies (51.8%). The utilization rate of quality management systems was relatively high (57.9%), whereas the utilization rate of quality improvement groups and meetings was the lowest (30.9%).
‘Development and implementation of clinical pathways and standardized care procedures’ was the most common quality control measure in trauma centers (57.7%), followed by ‘regular quality review and evaluation’ (52.2%) and ‘continuous training and capacity improvement’ (47.6%). ‘Medical quality control indicators monitoring of nursing’ (38.8%), ‘establishment of patient feedback and complaint handling mechanisms’ (32.2%), and ‘registration and management of trauma databases’ (24.2%) were selected by a lower percentage of respondents.
The main methods for trauma centers to evaluate the effectiveness of current nursing quality control indicators included clinical review and quality improvement (64.3%), clinical feedback and surveys (60.4%), external reviews (44.3%), and data analysis and trend monitoring (41.8%).
The data collection status of nursing quality management in trauma centers is shown in Table 4. A total of 61.7% of trauma centers have a dedicated database for patients with trauma, and 69.4% have dedicated personnel responsible for maintaining this database. Among centers with dedicated databases, 79.9% (n = 303) had such personnel. However, 40.1% of centers did not have dedicated personnel responsible for reporting trauma patient data. Among centers without dedicated reporting personnel, 32.9% (n = 72) nevertheless had a dedicated database. The frequency of data reporting varied across centers: the proportions reporting irregularly, quarterly, annually, monthly, weekly, and never were 11.4%, 13.9%, 12.3%, 37.4%, 20.1%, and 4.9%, respectively. Regarding data collection methods, manual recording and reporting were the main approaches (24.9%), whereas the use of EHR systems (22.0%) and clinical data collection systems (19.0%) was relatively less common. Most trauma centers (53.3%) did not collect relevant data systematically.
Inter-group comparisons of core quality management dimensions
The intergroup comparison results are shown in Table 5. Except for the establishment of a specialized nursing quality management program, which did not differ significantly by hospital level, trauma center level, or years of establishment (Fisher’s exact P = 1.000, 0.410, and 0.226, respectively), the other core quality management dimensions—allocation of trauma quality control specialists, establishment of specialty-specific nursing-sensitive indicators, and dedicated database construction—showed significant differences across these groups (all P < 0.05). Notably, only 6 (1.1%) institutions had established specialized nursing quality management programs. Given the low event count and the resulting insufficient power of Fisher's exact test, no significant between-group differences were detected.
Correlation analysis
The results of the correlation analysis are shown in Table 6. The composite frequency of quality management tool use was positively correlated with the composite score of nursing quality assessment effectiveness (r = 0.386, p < 0.001). Among the tools, the use of data analysis and reporting tools and EHR systems showed the most significant correlations with validity scores (r = 0.324 and r = 0.317, respectively, both p < 0.001). The completeness of data collection (having a dedicated person responsible for data reporting and the score for reporting frequency) was positively correlated with the scientific nature of quality indicators (presence of sensitive indicators and whether indicators truly reflect nursing quality) (r = 0.412, p < 0.001).
Factors associated with the establishment of a nursing quality management program
The results of Firth’s penalized likelihood logistic regression are shown in Table 7. The analysis confirmed that being a tertiary hospital (odds ratio [OR] = 3.872, 95% confidence interval [CI]: 1.056–14.253, p = 0.041), being equipped with quality control experts (OR = 4.215, 95% CI: 1.183–15.052, p = 0.026) and having a dedicated database (OR = 3.568, 95% CI: 1.012–12.579, p = 0.048) remained independent factors positively associated with establishment for a trauma center establishing a specialized nursing quality management program, even after correcting for the rare-event bias.
In summary, this multi-regional survey of 546 trauma centers across 30 provinces identifies three critical deficits in nursing quality management in the sampled regions: the near-universal absence of dedicated management programs (98.9%), a severe shortage of full-time quality control personnel (72.2%), and a lack of specialty-specific sensitive indicators (67.2%). Furthermore, systematic data collection remains inadequate (53.3%), and quality improvement tools are underutilized, with only 30.9% of centers employing quality improvement teams. Multivariate analyses consistently demonstrate that tertiary hospital status (OR = 3.872), the presence of quality control experts (OR = 4.215), and access to a dedicated database (OR = 3.568) were identified as independent factors positively associated with establishment for implementing specialized nursing quality management programs. Collectively, these findings confirm that nursing quality management in Chinese trauma centers is still nascent, pinpoint key resource-constrained vulnerabilities, and provide an empirical foundation for targeted, tiered quality improvement strategies.
DATA AVAILABILITY:
All data generated or analyzed during this study are included in the manuscript and Supplementary File 1.
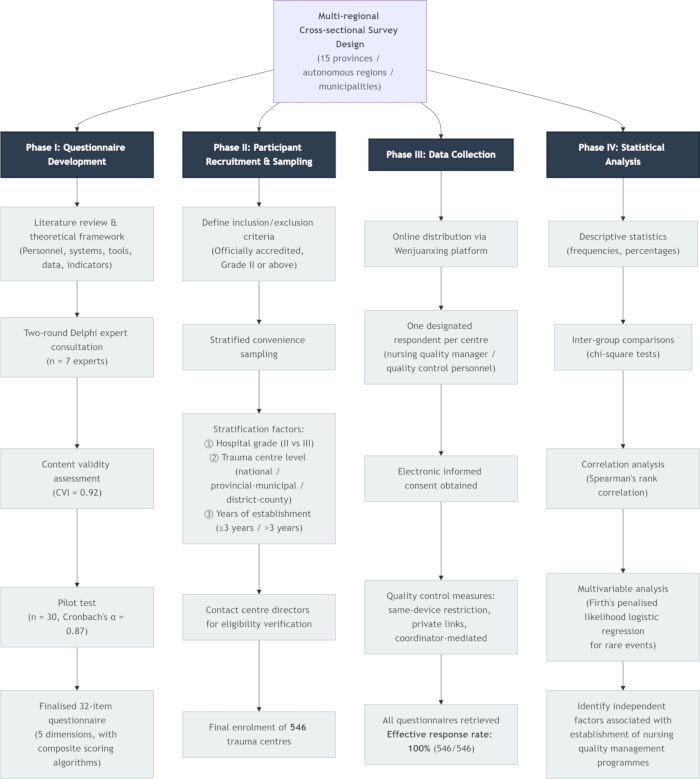
Figure 1. Schematic diagram of the overall study design and workflow. This diagram depicts the four sequential phases of the multi-regional cross-sectional survey. Phase I: Questionnaire development involved literature review, two Delphi rounds (n = 7), content validity (CVI = 0.92), and pilot test (n = 30, α = 0.87), yielding a 32-item instrument with five dimensions. Phase II: Stratified convenience sampling across 30 provinces, stratified by hospital grade, trauma center level, and years of establishment, enrolled 546 eligible centers. Phase III: Online distribution with quality controls and electronic consent yielded 546 valid responses (100% response rate). Phase IV: Analyses included descriptive statistics, chi-square, Spearman's correlation, and Firth's penalized logistic regression to identify factors associated with nursing quality management programs. Please click here to view a larger version of this figure.
Table 1: General situation of trauma centers (n = 546). This table presents the baseline characteristics of the 546 participating trauma centers, including hospital grade (Grade II A, II B, III A, III B), trauma center level (national, provincial/municipal, district/county), and years since establishment (1 to ≥5 years). Data are reported as frequencies and percentages. Please click here to download this table.
Table 2: Statistics of personnel, positions, and management mechanisms in nursing management of trauma centers (n = 546). All percentages are calculated based on the total number of samples (n = 546). Please click here to download this table.
Table 3: Usage of evaluation methods for the effectiveness of nursing quality management tools, measures, and indicators in trauma centers (n = 546). All percentages are calculated based on the total number of samples (n = 546). Please click here to download this table.
Table 4: Data collection and processing statistics of nursing quality management in trauma centers (n = 546). Both frequencies and percentages are reported. Please click here to download this table.
Table 5: Comparison between groups of core dimensions of nursing quality management in trauma centers with different characteristics (n = 546). Hospital level was categorized as Grade II [Grade II A (n = 82) + Grade II B (n = 40)] and Grade III [Grade III A (n = 208) + Grade III B (n = 216)]. Hospital trauma center level was categorized as National/Provincial/Municipal [National (n = 156) + Provincial/Municipal (n = 171)] and District/County (n =219). Years of establishment of the hospital trauma center were categorized as ≤3 years [≤1 year (n = 102) + 2 years (n = 98) + 3 years (n = 126)] and >3 years [4 years (n = 117) + ≥5 years (n = 103)]. The Pearson chi-square test was used for statistical analysis. A p-value of <0.05 was considered statistically significant. * indicates that Fisher’s exact test was used. Please click here to download this table.
Table 6: Spearman rank correlation analysis of factors related to nursing quality management (n = 546). Correlation coefficients (r) and p-values are provided. Comprehensive Usage Frequency of Quality Management Tools (X1) was calculated as the count of five types of tools used (score range 0–5). Composite Score for the Effectiveness of Nursing Quality Assessment (Y1) was calculated as the sum of scores for four assessment methods on a 5-point Likert scale (score range 4–20). Data Collection Completeness Score (X5) was calculated as the sum of scores for four indicators on a 5-point Likert scale (score range 4–20). Trauma Care Quality Index Scientificity Score (Y2) was calculated as the sum of scores for three indicators on a 5-point Likert scale (score range 3–15). Spearman's rank correlation analysis was used for statistical analysis. Please click here to download this table.
Table 7: Firth’s penalized likelihood logistic regression analysis of factors affecting the establishment of a nursing quality management program in trauma centers. Odds ratios, 95% confidence intervals, and p-values are reported for each independent factor. Please click here to download this table.
Supplementary File 1: Raw data for the study. Please click here to download this file.
Discussion
This multicenter survey reveals multidimensional and systematic shortcomings in nursing quality management in Chinese trauma centers, with marked variation by institutional characteristics. Specifically, 98.9% of respondents reported no specific quality management plan for trauma nursing, 83.3% no designated person responsible for specialized nursing quality management, 16.1% had not held nursing quality control meetings, and 11.4% had not conducted nursing quality assessments—a triple absence of “no plan, no dedicated person, and no mechanism” that undermines systematic supervision and continuous improvement. Multivariate logistic regression showed that being a tertiary hospital, having quality control experts, and possessing a dedicated database were independent positive factors for establishing a specialized nursing quality management plan. Regarding the establishment of specialized nursing quality management programs, tertiary hospitals had a slightly higher proportion than secondary hospitals (1.2% vs. 0.8%), but the difference was not statistically significant (Fisher’s exact test, P = 1.000). Similarly, centers established for >3 years had a slightly higher proportion than those established for ≤3 years (1.8% vs. 0.6%), also without statistical significance (Fisher’s exact test, P = 0.226). Overall, neither hospital level nor years of operation showed significant differences in the establishment of these programs. This lack of significance is more likely attributable to the extremely low incidence of this outcome (only 6/546) and the resulting insufficient statistical power, rather than indicating a true absence of differences among subgroups. Given that well-resourced, higher-level, and mature centers are more likely to develop such plans, secondary hospitals and newly established centers should be prioritized for support. Neither China nor international settings currently offer mature, trauma-center-specific nursing quality management plans; international nursing requirements are usually integrated into broader guidelines such as the European Guidelines for the Management of Post-Traumatic Hemorrhage, and although some Chinese provinces have issued construction guidelines7,8, these focus mainly on medical aspects, and specialized nursing standards remain incomplete9. Tertiary hospitals and centers established >3 years could therefore serve as benchmarks to refine replicable program frameworks, while policy preferences and technical support—including prioritized allocation of quality control experts and dedicated databases—should be directed to secondary hospitals and newly established centers to lower the threshold for program establishment.
The professionalization of quality control personnel is seriously insufficient: 72.2% of respondents indicated that no trauma quality control expert position had been established. Allocation was higher in tertiary hospitals (30.7%) than secondary hospitals (18.0%; χ2 = 7.52, P = 0.006), in national/provincial/municipal centers (32.7%) than district/county centers (20.5%; χ2 = 9.676, P = 0.002), and in centers established >3 years (33.6%) than those established ≤3 years (23.9%; χ2 = 6.165, P = 0.013), revealing a pattern in which high-level, high-tier, and longer-established centers are better resourced while grassroots and newly established centers have particularly weak professional support. International experience indicates that professional trauma teams can reduce severe trauma mortality by 15%–50%10,11,12. Similarly, Kunshan First People’s Hospital achieved improved outcomes after establishing a trauma management team with a quality control group, with patient satisfaction rising from 3.21 to 4.23 and overall team scores increasing by 1–2 points13. Accordingly, the allocation of trauma quality control experts should be incorporated into evaluation criteria for trauma centers at all levels; specialized training should be provided for secondary and county-level centers; and a “national–provincial/municipal–county” expert assistance mechanism should be established to rapidly strengthen grassroots quality control capacity.
Regarding quality management tools and data infrastructure, data analysis and reporting tools (60.4%) and electronic health record systems (59.7%) were most commonly used, whereas quality improvement teams and meetings were least used (30.9%). Among quality control measures, registration and management of trauma databases accounted for only 24.2%, compared with clinical pathway formulation (57.7%) and regular quality review (52.2%), indicating that a closed-loop continuous quality improvement mechanism has not yet been formed. Composite frequency of tool use correlated positively with composite nursing quality assessment effectiveness (r = 0.386, p < 0.001), with data analysis/reporting tools (r = 0.324, p < 0.001) and EHR systems (r = 0.317, p < 0.001) showing the most significant correlations. Nevertheless, the data collection process is fragmented: although 61.7% of centers have dedicated databases and 69.4% have dedicated maintenance personnel, 40.1% lack a dedicated person responsible for data reporting (32.9% of these despite having dedicated databases), 53.3% do not collect relevant data systematically, manual recording and reporting remain the primary method in 24.9%, and EHR utilization for this purpose is only 22%. These documentation and reporting gaps can be interpreted not merely as technical or resource deficits but as workload-induced clinical omissions within the scope of missed nursing care (MNC), a modifiable patient safety risk factor. MNC has been shown to be significantly negatively correlated with overall teamwork and its sub-dimensions, including team structure, situation monitoring, and communication14, and excessive documentation demands contribute to nurses’ cognitive burden15, further widening the gap between expected and actual documentation. Developed countries have achieved automated data collection, analysis, and reporting through national trauma registries (e.g., the United States and Germany)16,17,18,19,20, whereas China’s big data platform under the National Trauma Treatment Alliance faces poor system compatibility and redundant data entry3. Integrating 5G and Internet of Things technologies21,22, optimizing trauma database compatibility with hospital information systems, embedding data collection/reporting into dedicated personnel responsibilities, and promoting quality improvement team mechanisms could support combined tool use and closed-loop data management.
Only 32.8% of hospitals had established sensitive indicators for specialized trauma nursing quality, and 14.8% reported that existing indicators could not truly reflect trauma nursing quality, undermining scientific assessment. Trauma center quality control indicators should be measurable, meaningful, evidence-based, interpretable, and generalizable, and are important for evaluating trauma center capability and improving trauma care23. Indicator establishment was more common in tertiary hospitals (35.1%) than secondary hospitals (24.6%; χ2 = 4.79, P = 0.029), in national/provincial/municipal centers (36.4%) than district/county centers (27.4%; χ2 = 4.815, P = 0.028), and in centers established >3 years (38.6%) than those established ≤3 years (28.8%; χ2 = 5.727, P = 0.017), indicating lagging construction in grassroots and newly established centers. Completeness of data collection was positively correlated with the scientific nature of quality indicators (r = 0.412, p < 0.001), especially having dedicated personnel for data reporting (r = 0.368, p < 0.001) and regular reporting frequency (r = 0.345, p < 0.001), confirming that a solid data foundation is a prerequisite for scientific indicators. Current Chinese trauma care quality indicators are often limited to single disease types with incomplete coverage, concentrated in the in-hospital stage, and lacking pre-hospital and post-hospital indicators24,25. In contrast, developed countries primarily use the “structure–process–outcome” model, introduced by the American Nurses Association in 1998 to improve nursing quality26, and Coccolini et al. classified trauma quality indicators into six dimensions: prevention, structure, process, outcome, post-trauma management, and social impact11. It is therefore recommended to develop a sensitive indicator system covering the entire pre-hospital emergency, in-hospital treatment, and discharge rehabilitation continuum based on this model, while providing implementation training to secondary and county-level centers to ensure indicator operability and data completeness.
Beyond structural and procedural quality, nursing management must also address psychological outcomes and patient safety in vulnerable populations. Trauma-informed care (TIC) improves clinical outcomes, but structured TIC practices remain limited among nurses27, and pediatric medical traumatic stress (PMTS) arises from child-, family-, medical-, and socio-environmental factors with symptom frequencies ranging from 8.6% to 60%, making early screening and trauma-informed, family-centered care essential28. This gap is compounded by the low adoption of specialized nursing-sensitive indicators described above and the lack of adult–pediatric metric distinction, as well as significant TIC knowledge gaps among Chinese trauma nurses29; pediatric trauma patients require distinct quality indicators30, pediatric-specific indicators have recently been developed via modified Delphi methods31, and pediatric readiness is a prerequisite for trauma center verification32. Future programs should incorporate TIC training into continuing nursing education29 and develop holistic pediatric-specific indicators across structure, process, and outcome domains. Notably, several Chinese teams have already developed trauma nursing-sensitive indicator systems using Delphi methods and the structure–process–outcome model: Chen Huijuan et al. established 54 indicators for severe trauma resuscitation33, Xie et al. constructed 3 first-level, 11 second-level, and 49 third-level indicators for severe trauma emergency care34, Zhang Yu developed 3 first-level, 12 second-level, and 29 third-level indicators based on the Donabedian model35, and the National Trauma Medical Center issued an expert consensus updating trauma center quality control indicators to 19 items in 202436. These mature systems offer practical pathways for shifting from purely structural assessments to meaningful process and outcome evaluations, and adopting or adapting them could be an efficient entry point for centers without dedicated programs. However, this study reveals a stark implementation gap: most centers still lack specialized nursing-sensitive indicators and dedicated nursing quality management protocols, suggesting the core bottleneck is no longer “how to construct indicators” but “how to disseminate existing indicator systems into clinical practice across all trauma center levels.” Given the observed resource disparities, stratified and actionable implementation guidelines should be formulated based on existing Delphi findings, and policy guidance and training mechanisms should be leveraged to facilitate clinical translation. Future research should validate these indicator systems across different levels of trauma centers, especially secondary hospitals and county-level institutions, and examine their correlation with patient clinical outcomes.
In summary, most sampled trauma centers lack programs and standards specifically for trauma nursing quality management, lack designated trauma quality control specialist positions, and lack sensitive indicators for specialized nursing quality; although data analysis/reporting tools and EHR systems are most commonly used, most centers do not systematically collect patient data. Therefore, trauma care quality management programs and standards should be established and improved, professional trauma care quality control teams built, personnel training strengthened, trauma information systems enhanced, and a sensitive indicator system for trauma care quality control established and refined. Several limitations should be considered: the cross-sectional design precludes causal inference; stratified convenience sampling may introduce selection bias and limit generalisability beyond the alliance directories and the 30 included provinces; self-reported questionnaire data are subject to social desirability and recall biases, and reliance on a single respondent per center may not capture frontline variation; patient-level clinical outcomes were not collected, so links between structural deficits and prognosis remain unknown; and the cross-sectional design captures only one time point in a dynamic development process. Future research should conduct multicenter prospective interventional studies to evaluate the causal impact of nursing quality systems on hard clinical endpoints such as trauma mortality and nosocomial infections; apply implementation science frameworks (e.g., CFIR) to analyse barriers and facilitators to translating high-quality protocols and sensitive indicators into secondary and primary settings; incorporate patient-reported outcomes and post-traumatic psychological stress assessments into sensitive indicator frameworks; and explore machine learning and multi-source clinical data fusion to develop dynamic, real-time early warning models for nursing quality risks, shifting quality control from retrospective review to proactive early warning. Future longitudinal and multi-informant studies are also needed to validate and extend these findings.
Disclosures
The authors have no competing financial interests or other conflicts of interest pursuant to this work.
Acknowledgements
The Chongqing Science and Health Joint Medical Research Project funded the Research on the Construction of an Implementable Nursing Quality Control Plan for Trauma Centers Based on the Three-Dimensional Quality Structure Model (2024MSXM060).
Materials
| Name | Company | Catalog Number | Comments |
|---|---|---|---|
| IBM SPSS Statistics | IBM Corp., Armonk, NY, USA | Version 23 | Used for statistical analysis |
| Wenjuanxing (Survey Star) Platform | Changsha Ranxing Information Technology Co., Ltd., Changsha, China | web based platform | Used for questionnaire distribution, electronic informed consent collection, and data management |
References
- Wang ZG. The thinking of development of trauma medicine. Chin J Neurotraum Surg (Electron Ed). 2015;1(01):2–3.
- Peng L, et al. Construction of Quality Evaluation Index System of Emergency Nursing for Severe Trauma. J Nurs. 2021;28(23):20–24.
- Chen HJ, Liu Y, Sun LB. Research status quo and enlightenment on the nursing quality control indicators of trauma care. Chin J Emerg Crit Care Nurs. 2021;2(4):335–338.
- Jones TL, Hamilton P, Murry N. Quality and Safety in Nursing: A Competency Approach to Improving Outcomes. Johns Hopkins University Press; Baltimore, MD; 2021.
- Meng Y, et al. Vertebral artery injury following combination Jefferson fracture of C1 and Type II odontoid fracture: A case report. Clin Case Rep. 2024;12(7):e9173.
- Memon MA, et al. Sample size for survey research: review and recommendations. J Appl Struct Equat Model. 2020;4(2):i–xx.
- Zeng YL, et al. Analysis on key points for construction of trauma emergency center of Jiangxi Province. Chin J Trauma. 2019;35(12):1126–1129.
- Wang X, Fan L, Liu SG, Li L. Construction of trauma treatment and nursing management system in Gansu province. Chin J Emerg Crit Care Nurs. 2022;3(2):107–115.
- Du GL, et al. Blueprint for construction of trauma treatment system and trauma center in Shaanxi Province. Chin J Trauma. 2019;35(8):677–681.
- Li J, Ye JJ, Yang L. Bibliometric review and prospects of traditional Chinese medicine in trauma treatment. Chin J Chin Mater Med. 2024;49(2):559–564.
- Coccolini F, et al. Trauma quality indicators: internationally approved core factors for trauma management quality evaluation. World J Emerg Surg. 2021;16(1):6.
- American College of Surgeons. Resources for Optimal Care of the Injured Patient. 7th ed. ACS TQIP Guidelines; 2022.
- Zhou SZ, et al. Practice and effect of establishing emergency trauma team in county-level hospitals. Chin Nurs Manag. 2019;19(3):400–403.
- Safdari A, Ramezani F, Ayubi E, Sadeghian E. The relationship between teamwork and the workload of nurses with missed nursing care in intensive care units in Iran: a cross-sectional study. BMC Health Serv Res. 2025;25:440.
- Esmaeili S, Parviniannasab AM, Bijani M. Workload, missed nursing care, ethical climate, and work interruptions among emergency department registered nurses: A descriptive-analytical study. Int J Nurs Stud Adv. 2026;11:100562.
- Waydhas C, Lefering R, Hoefer C. Wissenschaftlicher Impact des TraumaRegister DGU. Unfallchirurg. 2018;121(10):781–787.
- Blätzinger M. Teleradiologie im TraumaNetzwerk DGU. Unfallchirurg. 2019;122(9):676–682.
- Chance T, Haines I, Graham R. Trauma radiology in the UK: an overview. Br J Hosp Med (Lond). 2018;79(10):567–570.
- Cheng L, et al. Establishment for regional pelvic trauma database in Hunan Province. J Cent South Univ (Med Sci). 2017;42(4):445–450.
- Hall K. VetCOT: The Veterinary Trauma Registry. Top Companion Anim Med. 2019;37:100365.
- Ni YJ, et al. Construction of a trauma center under the guidance of new trauma emergency concept. Chin J Neurotraum Surg (Electron Ed). 2021;7(4):222–225.
- Zhou Q, et al. Use of intelligent nursing platform in activation of integrated trauma care team. J Nurs Sci. 2022;37(6):62–65.
- Schang L, Blotenberg I, Boywitt D. What makes a good quality indicator set? A systematic review of criteria. Int J Qual Health Care. 2021;33(3):mzab107.
- Wang H, et al. Establishment of standard values for indicators of nursing quality appraisal of traumatic spinal surgical care. J Nurs Sci. 2010;25(14):77–78.
- Zhang CC, et al. Creating a nursing quality evaluation index system for children with acute severe trauma based on "structure-process-outcome" nursing quality evaluation indicators. Chin J Emerg Resuscit Disaster Med. 2024;19(3):387–390, 420.
- Deng Q, et al. Comparison of the Ability to Predict Mortality between the Injury Severity Score and the New Injury Severity Score: A Meta-Analysis. Int J Environ Res Public Health. 2016;13(8):825.
- Çınar Özbay S, Gelin D, Durmuş Sarıkahya S, Boztepe H. Trauma-Informed Care in Pediatric Oncology Nursing. Psycho-Oncology. 2025;34(12):e70360.
- Çınar Özbay S, Semerci Şahin R, Akdeniz Kudubeş A, Durmuş Sarıkahya S, Boztepe H. Which factor impacts medical traumatic stress for pediatric patients: Scoping review. J Pediatr Nurs. 2025;85:412–423.
- He L, Luo Y, Chen J, Gong R, Liao D. The Knowledge, Attitude, and Practice of Nurses Regarding Trauma-Informed Care for Traumatic Injured Patients: A Multicenter Cross-Sectional Study. J Nurs Manag. 2025;2025:2449177.
- Moore L, et al. Quality Indicators in Pediatric Trauma Care Expert Consensus Group. Evidence-Informed Quality Indicators for Pediatric Trauma Care. JAMA Pediatr. 2025;179(6):666–674.
- Roberts BK, et al. A Modified Delphi Study to Build Consensus on Pediatric-Specific Trauma Quality Indicators. J Pediatr Surg. 2025;60(8):162363.
- Tucker A, et al. Emergency Department Pediatric Readiness: A Trauma Center Quality Improvement Initiative. J Trauma Nurs. 2024;31(1):23–29.
- Chen Huijuan, et al. Construction and applicability analysis of nursing quality evaluation index system of severe trauma care. Chin J Emerg Crit Care Nurs. 2025;6(4):428–433.
- Xie L, et al. Construction of an emergency nursing-sensitive quality indicator system for patients with severe trauma: a modified Delphi study in the Chinese context. BMJ Open. 2026;16(2):e110217.
- Yu Zhang. Construction of a Trauma Care Quality-Sensitive Indicator System Based on the Donabedian Model. Nurs. 2025;14(10):1812–1818.
- Wei Huang, Tingmin Xu, Tianbing Wang, Baoguo Jiang. Expert consensus on key indicators for quality control in trauma medicine center. J Peking Univ Health Sci. 2024;56(3):551–555.