This protocol describes a standardized multi-voxel proton magnetic resonance spectroscopy approach used in a retrospective cohort study to evaluate intracranial gliomas and tumefactive demyelinating lesions by quantifying the N-acetylaspartate-to-choline ratio. The method supports metabolic assessment and their differential diagnosis.
A subscription to JoVE is required to view this content. Sign in or start your free trial.
Research Article
The N-Acetylaspartate to Choline Ratio Differentiates Intracranial Gliomas from Tumefactive Demyelinating Lesions in a Retrospective Cohort Study
* These authors contributed equally
In This Article
Summary
Abstract
Intracranial gliomas and tumefactive demyelinating lesions (TDLs) often exhibit overlapping features on conventional structural magnetic resonance imaging (MRI), making their differential diagnosis challenging. This retrospective cohort study evaluated the diagnostic performance of quantitative multi-voxel proton magnetic resonance spectroscopy (1H-MRS) for differentiating these lesions. A total of 63 patients with indeterminate intracranial masses, including gliomas, TDLs, and primary central nervous system lymphomas, underwent 1H-MRS. Absolute and relative metabolite ratios were measured within lesional solid cores and contralateral normal-appearing brain tissue. Regions of interest were independently delineated by two blinded neuroradiologists. Although both gliomas and TDLs demonstrated significantly increased choline-to-creatine (Cho/Cr) ratios relative to normal tissue, the Cho/Cr ratio showed limited diagnostic specificity. In contrast, the N-acetylaspartate-to-choline (NAA/Cho) ratio differed significantly between the two groups. The median NAA/Cho ratio was 1.22 (interquartile range [IQR], 0.75–1.60) in TDLs and 0.32 (IQR, 0.20–0.69) in high-grade gliomas. Receiver operating characteristic analysis demonstrated that an NAA/Cho threshold of ≤0.649 yielded a sensitivity of 72.7% (95% confidence interval [CI], 55.8%–84.9%), a specificity of 93.3% (95% CI, 70.2%–98.8%), and an area under the curve (AUC) of 0.848 (95% CI, 0.74–0.96). Inter-reader reproducibility was high, with intraclass correlation coefficients (ICCs) greater than 0.99. These findings suggest that quantitative 1H-MRS, particularly the NAA/Cho ratio, may provide a useful noninvasive metabolic biomarker to support the differentiation of intracranial gliomas from TDLs, although further validation in larger, multicenter cohorts is warranted.
Introduction
Primary brain and other central nervous system (CNS) tumors represent a major challenge in neuro-oncology because of their substantial morbidity and mortality. According to the Central Brain Tumor Registry of the United States (CBTRUS), the average annual incidence rate of primary brain tumors is 24.83 per 100,000 population1. Gliomas constitute approximately 26.3% of these tumors, with glioblastoma being the most common malignant primary brain tumor and accounting for more than half of all malignant cases1. The management of gliomas typically involves a multimodal approach comprising maximal safe surgical resection, followed by concurrent chemoradiotherapy and adjuvant chemotherapy. Accurate and timely diagnosis is therefore essential for surgical planning and prognostic assessment.
Conversely, tumefactive demyelinating lesions (TDLs) are relatively rare, atypical manifestations of inflammatory demyelinating diseases that can closely mimic primary brain tumors both clinically and radiologically2. TDLs are generally defined as solitary or multiple demyelinating lesions measuring more than 2.0 cm in diameter and are frequently accompanied by mass effect, perilesional edema, and contrast enhancement3. Unlike gliomas, TDLs are managed medically. Acute-phase treatment primarily relies on high-dose intravenous corticosteroids or plasma exchange, followed by appropriate disease-modifying therapies for underlying conditions such as multiple sclerosis (MS) or neuromyelitis optica spectrum disorders4,5. Because these conditions require fundamentally different therapeutic approaches, misdiagnosing a TDL as a high-grade glioma (HGG) may subject patients to unnecessary stereotactic biopsy or craniotomy, with the associated risks of permanent neurological deficits and other procedure-related complications6.
Differentiating these two entities using conventional magnetic resonance imaging (MRI) remains a persistent clinical challenge. Both HGGs and TDLs typically present as large supratentorial space-occupying lesions7. Although certain conventional MRI findings, such as the “open-ring” enhancement pattern, in which the non-enhancing portion of the ring faces the gray matter, are highly suggestive of atypical demyelination8, this feature is absent in a substantial proportion of cases. Furthermore, atypical TDLs may exhibit irregular, closed-ring, or garland-like peripheral enhancement with central hypointensity that is difficult to distinguish from the central necrosis commonly observed in glioblastomas9. Consequently, conventional structural MRI alone is often insufficient for confident differential diagnosis.
Advanced physiological imaging techniques, particularly proton magnetic resonance spectroscopy (1H-MRS), have emerged as valuable tools for noninvasively evaluating the biochemical microenvironment of brain lesions10. Magnetic resonance spectroscopy (MRS) provides a quantitative assessment of cerebral metabolites, including N-acetylaspartate (NAA), a marker of neuronal and axonal integrity; choline-containing compounds (Cho), which reflect cell membrane turnover and proliferation; and creatine (Cr), which serves as a reference for cellular energy metabolism11. In neuro-oncology, HGGs are typically characterized by increased Cho resulting from rapid tumor cell proliferation together with marked depletion or loss of NAA, reflecting destruction of normal neural tissue by infiltrating neoplastic cells12.
However, interpretation of MRS findings in TDLs remains challenging. During the acute inflammatory phase of demyelination, myelin breakdown and infiltration of lipid-laden macrophages increase the release of mobile membrane phospholipids, resulting in elevated Cho peaks13. Consequently, reliance on the absolute Cho peak or the Cho/Cr ratio alone may lead to considerable metabolic overlap between TDLs and gliomas, thereby contributing to diagnostic uncertainty14,15. Although previous studies have reported the utility of short echo-time MRS and magnetization transfer ratios in demyelinating diseases16,17, robust quantitative metabolic thresholds specifically designed to differentiate indeterminate gliomas from TDLs in routine clinical practice remain limited.
From a clinical perspective, multi-voxel 1H-MRS provides spatially resolved metabolic information across heterogeneous intracranial lesions. This metabolic characterization may support clinical decision-making and assist in identifying metabolically active targets for stereotactic biopsy, potentially reducing sampling error. However, several practical limitations may affect its routine implementation in neuroradiological practice. These include susceptibility to magnetic field inhomogeneity near the skull base or paranasal sinuses, voxel volume-averaging at the lesion-tissue interface, and degradation of metabolite quantification caused by baseline distortion. Therefore, the primary objective of this retrospective cohort study was to evaluate the diagnostic performance of quantitative MRS parameters. Specifically, this study investigated whether the absolute NAA/Cho ratio, which reflects the physiological balance between axonal preservation and membrane proliferation, could serve as a quantitative metabolic biomarker to support the differentiation of intracranial gliomas from TDLs. Although the findings may have potential clinical utility, additional validation in larger, multicenter cohorts is warranted before broader clinical implementation.
Access restricted. Please log in or start a trial to view this content.
Protocol
All methods described in this protocol were carried out in accordance with relevant guidelines and regulations. This retrospective study analyzed de-identified clinical data collected during routine patient care and was approved by the Hebei General Hospital Ethics Committee (Approval No. 2026-LW-112; approved on April 10, 2026). Informed written consent was obtained from all subjects and/or their legal guardian(s) before participation.
Patient Selection and Study Design
Patients presenting with indeterminate intracranial space-occupying lesions on initial conventional MRI between January 2018 and December 2024 were retrospectively identified from routine clinical records according to the study eligibility criteria. An indeterminate intracranial space-occupying lesion was operationally defined as a brain mass demonstrating atypical, overlapping morphological characteristics on structural imaging that confounded the primary diagnosis and required formal diagnostic consensus by a multidisciplinary neuro-oncology board. The study included patients who had an untreated intracranial mass, were naïve to high-dose corticosteroid treatment before neuroimaging, completed a two-dimensional (2D) multi-voxel 1H-MRS examination before any clinical intervention, and had a definitive final diagnosis confirmed by either histopathology (via surgical resection or stereotactic biopsy) or strict clinico-radiological follow-up.
For non-biopsied cases, a follow-up diagnosis was deemed sufficiently reliable only if patients completed a documented longitudinal clinical and radiological follow-up period of at least 12 months. Standardized criteria for a confirmed TDL follow-up diagnosis required verified clinical neurological stabilization or improvement accompanied by a ≥50% volumetric reduction of the contrast-enhancing lesion component on consecutive follow-up scans without the administration of cytostatic or oncological therapies. Follow-up imaging examinations were performed at 3- to 6-month intervals to assess lesion regression. Patients were excluded if they lacked a definitive final diagnosis, were diagnosed with alternative pathologies (e.g., brain abscess, metastasis, or subacute infarction), or had non-diagnostic MRS data due to severe motion artifacts, poor shimming, or significant baseline distortion. All non-diagnostic spectra were quantitatively screened and excluded before the blinded independent evaluation to eliminate selection bias. A schematic representation of the study design and patient selection process is provided in Figure 1.
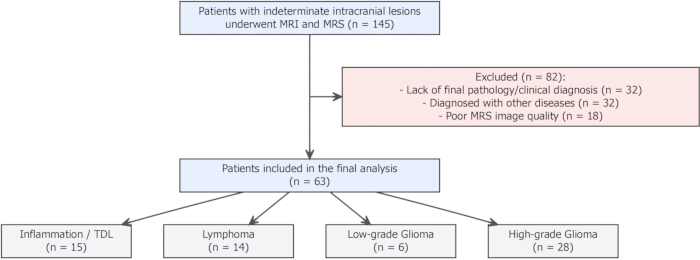
Figure 1. Patient selection and study design. Flowchart illustrating patient enrollment and study selection. A total of 145 patients with indeterminate intracranial lesions who underwent conventional magnetic resonance imaging (MRI) and proton magnetic resonance spectroscopy (1H-MRS) were screened. After application of the exclusion criteria, 63 patients were included in the final analysis. The final cohort comprised patients with high-grade glioma (n = 28), low-grade glioma (n = 6), primary central nervous system lymphoma (n = 14), and tumefactive demyelinating lesion (TDL; n = 15). Exclusion criteria included lack of a definitive diagnosis (n = 32), alternative diagnoses (n = 32), and poor-quality MRS examinations (n = 18). Please click here to view a larger version of this figure.
Conventional MRI Acquisition
All neuroimaging examinations were performed using a 3.0-T whole-body magnetic resonance scanner equipped with an 8-channel phased-array head coil. Before examination, patient safety screening was performed, establishing a mandatory exclusion threshold of an estimated glomerular filtration rate (eGFR) <30 mL/min/1.73 m2 to prevent nephrogenic systemic fibrosis. The conventional MRI protocol included axial T1-fluid-attenuated inversion recovery (FLAIR) images (repetition time [TR] = 1750 ms, echo time [TE] = 25.0 ms, field of view [FOV] = 240 mm × 192 mm, slice thickness = 6 mm, interslice gap = 1 mm, matrix size = 320 × 224), T2-weighted images (T2WI; TR = 4841 ms, TE = 102.8 ms, FOV = 240 mm × 240 mm, matrix = 416 × 416), and T2-FLAIR images (TR = 7000 ms, TE = 138.1 ms, FOV = 240 mm × 240 mm, matrix = 256 × 256).
Following intravenous administration of a macrocyclic gadolinium-based contrast agent at a standard dose of 0.2 mmol/kg and a flow rate of 2 mL/s, contrast-enhanced spoiled gradient recalled echo (SPGR) T1-weighted images were acquired (TR = 7.3 ms, TE = 3.1 ms, FOV = 240 × 240 mm, slice thickness = 1 mm with a 0.5 mm slice overlap, matrix = 256 × 256). Patients were continuously monitored within the facility for a minimum of 30 min after contrast administration to identify and manage any acute adverse or allergic reactions.
1H-MRS Acquisition and Prescribed Voxel Geometry
2D multi-voxel 1H-MRS was performed using a point-resolved spectroscopy (PRESS) sequence. The volume of interest (VOI) was prescribed on multiplanar contrast-enhanced T1-weighted and T2-FLAIR images to encompass the solid portion of the lesion, the peritumoral edema, and the adjacent normal-appearing brain tissue. To ensure institutional consistency across the retrospective cohort, the multi-voxel grid was uniformly aligned parallel to the anterior commissure-posterior commissure (AC-PC) line and centered over the maximum diameter of the target lesion.
The scanning parameters for the MRS acquisition included repetition time (TR) = 1000 ms, echo time (TE) = 144 ms, field of view (FOV) = 240 mm × 240 mm, slice thickness = 15.0 mm, interslice gap = 20.0 mm, and number of excitations (NEX) = 1.0. The nominal individual spectroscopic voxel dimensions within the acquisition matrix were 7.5 mm × 7.5 mm × 15.0 mm, acquired using a 32 × 32 spectroscopic acquisition matrix, corresponding to an individual voxel volume of approximately 0.84 mL. Standard automated procedures were consistently applied for water suppression and localized shimming. Strict quality-control checkpoints during acquisition required a localized water peak full-width at half-maximum (FWHM) linewidth of ≤15 Hz and automated water suppression attenuation exceeding 98%. A relatively long echo time (TE = 144 ms) was selected to provide a flat baseline by suppressing short-TE macromolecule signals and broad background lipid contamination commonly observed in acute inflammatory lesions, thereby improving phase clarity for the principal diagnostic metabolites.
Spectral Post-processing, Software Workflow, and Quantitative Analysis
The raw spectral data were transferred to a dedicated diagnostic post-processing workstation running specialized multi-modality evaluation software. The automated post-processing workflow consisted of consecutive steps: raw data apodization using a 2 Hz Gaussian filter, fast Fourier transformation, automated zero- and first-order phase correction, and automated polynomial baseline adjustment. Spectral quality degradation from residual rolling baselines was quantitatively assessed, and voxels with baseline distortion exceeding 10% of the maximum metabolite peak height were excluded.
Regions of interest (ROIs) were manually placed within the most representative solid portions of the lesions while avoiding macroscopic necrosis, cystic components, hemorrhage, calcifications, and areas adjacent to the skull base or ventricles to minimize spectral contamination and voxel volume-averaging artifacts. Specifically, three optimal target voxels were sampled within the active, contrast-enhancing, non-necrotic rim of the lesion. For internal standardization, a paired mirror ROI of identical size and symmetrical grid coordinates was placed in the contralateral normal-appearing white matter. The contralateral reference region was verified as metabolically unaffected by confirming normal, symmetric signal intensity across T1-weighted, T2-weighted, and T2-FLAIR images. A localized coil-intensity normalization filter was applied to minimize distance-related surface coil sensitivity bias.
The principal cerebral metabolites were identified according to their resonance frequencies: NAA at 2.0 ppm, Cr at 3.0 ppm, Cho at 3.2 ppm, lipids (Lip) at 0.9–1.3 ppm, and lactate (Lac) at 1.3 ppm. The detection threshold for metabolite peaks was defined as a signal-to-noise ratio (SNR) of ≥5. Owing to the phase modulation characteristics of the TE = 144 ms acquisition, lipid and lactate peaks were analyzed separately: lactate was identified by its characteristic inverted doublet at 1.33 ppm, whereas mobile lipids remained upright at 0.9–1.3 ppm, minimizing peak overlap. Absolute peak integrals were used to calculate the intra-lesional metabolite ratios (Cho/Cr, NAA/Cr, and NAA/Cho) by averaging measurements from the three target ROIs. Relative metabolite ratios (rCho/Cr, rNAA/Cr, and rNAA/Cho) were calculated by normalizing lesional values to those of the contralateral normal tissue. To assess inter-reader reliability, ROI selection and spectral quantification were performed independently by two experienced neuroradiologists who were blinded to the final clinical and histopathological diagnoses. Any procedural or positional discrepancies in voxel selection were resolved by consensus with a third senior neuroradiologist.
Statistical Analysis
All statistical modeling and graphical visualizations were performed using a verified statistical computing environment. The normality of continuous variables was assessed using the Shapiro–Wilk test. Continuous metabolic variables were compared across multiple disease groups using the Kruskal–Wallis H test, followed by the Wilcoxon rank-sum test for post hoc comparisons. Paired differences between the lesional core and contralateral normal tissue were evaluated using the Wilcoxon signed-rank test. Receiver operating characteristic (ROC) curves were constructed to evaluate diagnostic performance by calculating the optimal cut-off values, area under the curve (AUC), sensitivity, specificity, positive predictive value, and negative predictive value, with corresponding 95% confidence intervals (95% CIs) derived using Wilson’s score method for all point estimates. Inter-reader agreement was evaluated using the intraclass correlation coefficient (ICC) and Bland-Altman plots. A two-sided p-value <0.05 was considered statistically significant.
Access restricted. Please log in or start a trial to view this content.
Results
Study Population and Baseline Characteristics
During the study period, a total of 145 patients with indeterminate intracranial lesions who underwent both conventional MRI and 1H-MRS were initially screened. Following application of the predefined exclusion criteria, primarily because of the absence of a definitive pathological or long-term clinical diagnosis (n = 32), confirmation of alternative pathologies (n = 32), or inadequate MRS spectral quality (n = 18), 63 p...
Access restricted. Please log in or start a trial to view this content.
Discussion
Accurate differentiation between intracranial gliomas and TDLs before therapeutic intervention is important for appropriate clinical management. In this retrospective study, the diagnostic utility of quantitative 1H-MRS parameters was evaluated in patients with indeterminate intracranial lesions. The findings indicate that the NAA/Cho ratio provided greater diagnostic discrimination than the conventional Cho/Cr ratio for differentiating gliomas from TDLs. Specifically, an NAA/Cho ratio threshold of ≤0.64...
Access restricted. Please log in or start a trial to view this content.
Disclosures
Conflict of Interest:
The authors declare that they have no competing interests.
Acknowledgements
This study was supported by the Medical Science Research Project of Hebei, China (Grant Nos. 20230402 and 20180161). The funding source had no role in the study design; data collection, analysis, or interpretation; the decision to publish; or the preparation of the manuscript.
Access restricted. Please log in or start a trial to view this content.
Materials
| Name | Company | Catalog Number | Comments |
|---|---|---|---|
| 3.0-T MRI Scanner (Discovery MR750w) | GE Healthcare | N/A | MRI and 1H-MRS acquisition |
| 8-channel phased-array head coil | GE Healthcare | N/A | Head radiofrequency coil for MRI and 1H-MRS acquisition |
| Functional Tool post-processing software | GE Healthcare | Functool 9.4 | Spectral post-processing and metabolite quantification |
| Gadolinium-based contrast agent | Bayer Healthcare | N/A | Intravenous contrast agent for contrast-enhanced MRI |
| Multi-modality post-processing workstation | GE Healthcare | Advantage Workstation (AW4.6) | Dedicated workstation for spectral post-processing |
| R statistical computing software | R Foundation | RRID: SCR_001905 | Statistical analysis and graphical visualization |
References
- Ostrom QT, et al. CBTRUS statistical report: Primary brain and other central nervous system tumors diagnosed in the United States in 2016-2020. Neuro Oncol. 2023;25(Suppl 2):iv1-99.
- Lucchinetti CF, et al. Clinical and radiographic spectrum of pathologically confirmed tumefactive multiple sclerosis. Brain. 2008;131(Pt 7):1759-75.
- Haupts MR, et al. Fulminant tumefactive multiple sclerosis: Therapeutic implications of histopathology. J Neurol. 2008;255(8):1272-3.
- Algahtani H, Shirah B, Alassiri A. Tumefactive demyelinating lesions: A comprehensive review. Mult Scler Relat Disord. 2017;14:72-9.
- Altintas A, et al. Clinical and radiological characteristics of tumefactive demyelinating lesions: Follow-up study. Mult Scler. 2012;18(10):1448-53.
- Hu W, Lucchinetti CF. The pathological spectrum of CNS inflammatory demyelinating diseases. Semin Immunopathol. 2009;31(4):439-53.
- Jameson J, et al. Harrison's Principles of Internal Medicine. 20th ed. McGraw-Hill; New York; 2018.
- Masdeu JC, et al. Open ring imaging sign: Highly specific for atypical brain demyelination. Neurology. 2000;54(7):1427-33.
- Given CA, Stevens BS, Lee C. The MRI appearance of tumefactive demyelinating lesions. AJR Am J Roentgenol. 2004;182(1):195-9.
- Atlas SW. Magnetic Resonance Imaging of the Brain and Spine. 3rd ed. Lippincott Williams & Wilkins; Philadelphia; 2008.
- Hu X, et al. Combined application of MRS and DWI can effectively predict cell proliferation and assess the grade of glioma: A prospective study. J Clin Neurosci. 2021;83:56-63.
- Cianfoni A, Niku S, Imbesi SG. Metabolite findings in tumefactive demyelinating lesions utilizing short echo time proton magnetic resonance spectroscopy. AJNR Am J Neuroradiol. 2007;28(2):272-7.
- Saindane AM, et al. Proton MR spectroscopy of tumefactive demyelinating lesions. AJNR Am J Neuroradiol. 2002;23(8):1378-86.
- Cucurella MG, et al. Serial proton spectroscopy, magnetization transfer ratio and T2 relaxation in pseudotumoral demyelinating lesions. NMR Biomed. 2002;15(4):284-92.
- De Stefano N, et al. Chemical pathology of acute demyelinating lesions and its correlation with disability. Ann Neurol. 1995;38(6):901-9.
- Kiriyama T, et al. Characteristic neuroimaging in patients with tumefactive demyelinating lesions exceeding 30 mm. J Neuroimaging. 2011;21(1):69-77.
- Dagher AP, Smirniotopoulos J. Tumefactive demyelinating lesions. Neuroradiology. 1996;38(6):560-5.
- Sinha MK, et al. Tumefactive demyelinating lesion: Experience with two unusual patients. J Postgrad Med. 2010;56(2):146-9.
- Chapter 6: Intracranial infection and inflammation. In: Diseases of the Brain, Head and Neck, Spine 2020-2023: Diagnostic Imaging. Springer; Cham; 2020. Available from: https://doi.org/10.1007/978-3-030-38490-6_6
- Oz G, et al. Clinical proton MR spectroscopy in central nervous system disorders. Radiology. 2014;270(3):658-79.
Access restricted. Please log in or start a trial to view this content.