This study integrated network pharmacology, molecular docking, molecular dynamics, and MM-PBSA to prioritize potential protein interactions of glutathione-responsive abasic site-trapping prodrugs in NSCLC. Compound 5 was prioritized for MMP9 and SRC follow-up; however, these remain computational candidates. The findings are hypothesis-generating and require biochemical and cell-based validation.
Research Article
In Silico Prioritization of Potential Protein Interactions for Glutathione-Responsive Abasic Site-Trapping Prodrugs in Non-Small Cell Lung Cancer
In This Article
Summary
Abstract
Non-small cell lung cancer (NSCLC) remains a major cause of cancer-related mortality, and treatment efficacy is frequently limited by acquired resistance and systemic toxicity. Glutathione-responsive abasic site-trapping prodrugs have shown selective anticancer activity in prior experimental studies, but whether their released metabolites also show meaningful interactions with cancer-relevant proteins remains to be established. Here, an integrated in silico workflow combining network pharmacology, molecular docking, molecular dynamics (MD), and molecular mechanics Poisson-Boltzmann surface area (MM-PBSA) analysis was used to prioritize testable protein-interaction hypotheses for two glutathione-responsive prodrugs (Compound 1 and Compound 2), their aminooxy-containing products (Compound 4 and Compound 5), and a matched non-trapping control pair (Compound 3 and Compound 6). Twenty-one intersecting compound- and disease-associated targets were identified, and AKT serine/threonine kinase 1 (AKT1), epidermal growth factor receptor (EGFR), tumor necrosis factor (TNF), matrix metalloproteinase 9 (MMP9), and SRC proto-oncogene non-receptor tyrosine kinase (SRC) were prioritized by protein-protein interaction topology. Compound 5 produced the most favorable single AutoDock Vina score with MMP9 (-8.418 kcal·mol⁻1) and showed comparatively persistent docking-derived poses across the MMP9 and SRC MD trajectories. However, the top-ranked MMP9 pose did not show direct coordination of the catalytic Zn2⁺ ion or direct engagement of His401, Glu402, His405, or His411, so it cannot be assigned a canonical MMP9 inhibitory binding mode. MD and MM-PBSA analyses characterize only trajectory behavior and the relative energetic ranking of these complexes; they do not demonstrate intracellular target engagement, enzyme inhibition, or pathway regulation. The established abasic-site-trapping activity and the newly predicted protein interactions are therefore treated as separate, potentially parallel hypotheses rather than a demonstrated mechanistic chain. Overall, the results prioritize specific compound-target pairs for future testing but do not establish a multi-target anti-NSCLC mechanism.
Introduction
Non-small cell lung cancer (NSCLC) is the most common histological subtype of lung cancer and remains a major cause of cancer-related mortality worldwide1. Although substantial progress has been achieved in targeted therapy and precision oncology, long-term treatment efficacy is still frequently undermined by acquired resistance, limited response durability, and treatment-associated toxicity2. Epidermal growth factor receptor (EGFR)-targeted agents have improved outcomes in molecularly selected patients, yet resistance almost inevitably develops during treatment, creating an urgent need for therapeutic strategies that act through alternative or complementary mechanisms3,4. Conventional platinum-based chemotherapy remains an important component of treatment, but its clinical benefit is constrained by cumulative toxicity and resistance during prolonged use5,6. Together, these limitations highlight the need to identify antitumor agents that are both mechanistically distinct and selectively activated in the tumor environment.
Among endogenous DNA lesions, abasic or apyrimidinic sites are highly abundant and biologically consequential, with thousands of lesions generated in each cell every day7. When these lesions are not efficiently repaired, they can be converted into strand breaks, which can promote genomic instability and cell death8,9. Apurinic/apyrimidinic endonuclease 1 is a central enzyme in the base excision repair pathway because it cleaves abasic sites and enables downstream repair processing10,11. This repair dependency has made abasic site-associated damage an attractive target for anticancer drug development12. Based on this rationale, glutathione-responsive abasic site-trapping prodrugs were previously developed to exploit the elevated glutathione environment of tumor cells. Their glutathione-triggered products contain an aminooxy functionality capable of trapping aldehydic abasic sites, and previous experimental work showed selective cytotoxicity, cell-cycle arrest, and apoptosis in H1299 cells13. Those data support the DNA lesion-trapping component of the compound design. They do not, however, show that MMP9, SRC, EGFR, AKT1, or TNF is regulated downstream of abasic-site trapping. Any protein-target interaction identified in the present computational analysis must therefore be considered a separate hypothesis unless both processes are demonstrated in the same biological system.
The present study was designed around this distinction. The first level of the biological rationale is the previously established glutathione-responsive release and abasic-site-trapping chemistry14. The second level, examined here, is an exploratory question: whether the parent prodrugs or their released products are computationally compatible with selected cancer-associated proteins. Network pharmacology was used to prioritize candidate proteins, followed by docking, MD, and MM-PBSA analyses to examine selected protein-ligand complexes15,16. These calculations were not intended to demonstrate that the predicted proteins mediate the known DNA-damage phenotype, nor to establish a causal link between abasic-site trapping and oncogenic signaling. Instead, the workflow was used to generate a ranked set of experimentally testable hypotheses that can later be evaluated by direct binding, enzyme activity, pathway, DNA damage, and phenotype assays.
Protocol
Institutional review board approval was not required because this study was entirely computational and involved no human participants, vertebrate animals, patient-derived biospecimens, or identifiable personal data. Informed consent was therefore not applicable. All databases, software packages, force fields, and computational resources used in this protocol are listed in the Table of Materials.
Study compounds and analytical workflow
Previously reported glutathione-responsive abasic site-trapping compounds were used as study molecules17. Compound 1 and Compound 2 were selected as the parent prodrugs because glutathione-triggered cleavage generates the aminooxy-containing products Compound 4 and Compound 5, respectively. Compound 4 and Compound 5 were selected for structural analysis because they represent the released species that retain the abasic-site-reactive aminooxy group. Compound 3 was included as a matched glutathione-responsive structural control; its cleavage product, Compound 6, lacks the aminooxy functionality required for covalent trapping of abasic-site aldehydes. Accordingly, Compounds 1–3 were included in reverse target prediction to compare the parent scaffolds, Compound 4 and Compound 5 were evaluated against the prioritized proteins, and Compound 6 was used as the negative-control ligand in the SRC MD comparison. The SRC–Compound 6 trajectory was included to provide a matched structural comparator for the aminooxy-containing Compound 5 system, not as evidence that the aminooxy group itself determines SRC binding. The chemical structures and activation relationships of Compounds 1–6 are shown in Figure 1. This design intentionally keeps the established DNA lesion-trapping chemistry separate from the present hypothesis-generating analysis of possible protein interactions.
Prediction of compound-associated targets
The two-dimensional structures of Compound 1, Compound 2, and Compound 3 were saved in MDL MOL format and converted to canonical simplified molecular-input line-entry system (SMILES) strings using Open Babel version 3.1.1 with the canonical SMILES output format18. Each exported string was re-imported, and the regenerated structure was visually cross-checked against the corresponding two-dimensional structure before submission to SwissTargetPrediction, with the species restricted to Homo sapiens19. Predicted targets with nonzero probability values were retained. The target lists obtained for the three compounds were merged, duplicate entries were removed, and the remaining targets were standardized to official human gene symbols before further analysis. The standardized compound-target pairs were imported into network visualization and analysis software as a network table, with compounds and predicted targets represented as nodes and compound-target relationships represented as edges, to visualize the predicted target relationships20.
Retrieval of disease-related targets and identification of intersecting targets
Disease-associated targets were retrieved from the GeneCards database using the search term “lung cancer H1299”21. A relevance score threshold greater than 0.27 was applied to retain genes with stronger relevance to this query. Gene symbols were standardized, and duplicate entries were removed manually. The overlap between compound-predicted targets and disease-associated targets was identified using online Venn-diagram/intersection analysis tool22. Only the intersecting targets were retained for subsequent protein-protein interaction (PPI), enrichment, and target prioritization analyses.
Protein-protein interaction analysis and screening of core targets
The intersecting targets were submitted to the Search Tool for the Retrieval of Interacting Genes/Proteins (STRING) version 11.5, with the species restricted to Homo sapiens and the minimum required interaction score set to 0.40023. The resulting PPI data were imported into Cytoscape version 3.10.0 for visualization and topology analysis. Within a network-topology analysis plugin, degree, betweenness centrality, and closeness centrality were calculated for each node in the original 21-node PPI network; the resulting values were then used for the sequential median-based filtering described below24. Centrality metrics were calculated on the original 21-node PPI network and then used for sequential filtering. The median degree of the original network was 12, and nodes with degree ≥ 12 were retained, yielding 13 candidates. Within these 13 candidates, the median betweenness centrality was 0.031293, and the median closeness centrality was 0.769231. The second filter retained nodes with betweenness centrality ≥ 0.031293 and closeness centrality > 0.769231, yielding five hub candidates: AKT1, EGFR, TNF, MMP9, and SRC. The reported centrality values were carried forward from the original 21-node network rather than recalculated after subsetting. The final five hub candidates were used for subsequent structural analysis. The original topology metrics correspond to an undirected PPI network containing 21 nodes and 116 edges.
Gene Ontology and Kyoto Encyclopedia of Genes and Genomes enrichment analysis
The intersecting targets were subjected to Gene Ontology (GO) and Kyoto Encyclopedia of Genes and Genomes (KEGG) enrichment analysis using the Database for Annotation, Visualization and Integrated Discovery (DAVID), with the species restricted to Homo sapiens25. GO enrichment was evaluated for biological process (BP), cellular component (CC), and molecular function (MF), as well as KEGG signaling pathways. For this exploratory analysis, nominal p < 0.10 was the inclusion threshold used to retain enrichment entries; Benjamini-adjusted p-values, Bonferroni values, false discovery rates, and Fisher's exact test values were reported in the supplementary tables but were not used to define the retained set. Retained entries were ranked by nominal p-value. For downstream visualization and interpretation, the top 20 KEGG pathways and the top 10 terms from each GO category were retained. Bar charts and bubble plots were generated using an online bioinformatics visualization tool.
Preparation of receptors and ligands for molecular docking
The crystal structures of the prioritized proteins were retrieved from the RCSB Protein Data Bank (PDB): AKT1, PDB ID 3O96; EGFR, PDB ID 5UWD; TNF, PDB ID 2AZ5; MMP9, PDB ID 1GKC; and SRC, PDB ID 2H8H. Protein structures used for docking were prepared in molecular visualization software by removing co-crystallized ligands and water molecules, followed by processing in docking-preparation software. For MMP9, an unmodified copy of PDB 1GKC was retained separately as the crystallographic reference for the catalytic Zn2⁺ environment and the N2-[(2R)-2-{[formyl(hydroxy)amino]methyl}-4-methylpentanoyl]-N,3-dimethyl-L-valinamide (NFH) binding mode. In chain A of 1GKC, the catalytic Zn2⁺ is coordinated by His401, His405, and His411 at 2.21, 2.23, and 2.22 Å, respectively, whereas the two NFH oxygen atoms coordinate Zn2⁺ at 2.07 and 2.38 Å; Glu402 is the catalytic acid/base residue. These crystallographic contacts were used as a positive structural reference for evaluating the Compound 5 docking interaction map. For SRC, PDB 2H8H was used for the SRC MD calculations. These structural comparisons were used for interpretation only and were not treated as evidence of enzyme inhibition or intracellular target engagement.
The three-dimensional structures of Compound 4 and Compound 5 were obtained from PubChem and optimized by energy minimization in molecular modeling software26. Ligands were protonated under physiological conditions and minimized using the Merck molecular force field 94 (MMFF94) until the energy gradient was below 0.01 kcal·mol⁻1·Å⁻1. Hydrogen atoms were added, Gasteiger charges were assigned, and rotatable bonds were defined in docking-preparation software. Compound 6, the glutathione-cleavage product of the non-trapping Compound 3 control, was prepared using the same workflow and docked to SRC only to generate the starting pose for the matched control MD trajectory. Thus, Compound 6 was neither introduced as an additional predicted therapeutic ligand nor used to support a multi-target mechanism.
Molecular docking procedure
Molecular docking was performed using molecular docking software under a semiflexible docking protocol, with receptors kept rigid and ligands allowed to remain flexible27,28. For each receptor, the docking box was centered on the position of the co-crystallized ligand so that the search region corresponded to the experimentally defined binding pocket. The docking box dimensions were set to 24 Å × 24 Å × 24 Å for AKT1, EGFR, and SRC, 26 Å × 26 Å × 26 Å for MMP9, and 28 Å × 28 Å × 28 Å for TNF. Exhaustiveness was set to 32, the number of output poses was set to 20, and the energy range was set to 4 kcal·mol⁻1. The top-ranked conformation from each docking run was retained for interaction analysis.
To assess the internal reliability of the docking setup, each co-crystallized ligand was redocked into its corresponding receptor pocket using the same parameters, with a heavy-atom root mean square deviation (RMSD) below 2.0 Å used as the acceptance criterion. Final poses were inspected in molecular visualization software. For the MMP9–Compound 5 complex, the retained interaction map was examined specifically for annotated direct ligand coordination to the catalytic Zn2⁺ ion and for contacts with His401, Glu402, His405, and His411, and the ligand position was compared with the crystallographic NFH pose in PDB 1GKC. A quantitative metal-coordination distance was reported only when direct ligand-Zn2⁺ coordination was evident in the retained pose; otherwise, it was designated not applicable rather than inferred. So, an MMP9 docking pose lacking these canonical catalytic-site features was categorized as noncanonical and was not interpreted as evidence of MMP9 enzymatic inhibition. More generally, AutoDock Vina scores and docking poses were used for relative prioritization and hypothesis generation, not as proof of binding affinity or intracellular target engagement.
Molecular dynamics protocol
Protein-ligand complexes selected for MD analysis were constructed from the docking-derived binding poses. MD calculations were performed with GROMACS29. Proteins were parameterized using the CHARMM36 force field, while ligand atom types and parameters were assigned with the second-generation General Amber Force Field (GAFF2)30,31. Austin Model 1-bond charge correction (AM1-BCC) partial charges were generated through small-molecule parameterization and ligand-topology generation tools; ligand topology generation software then generated the GROMACS-compatible ligand topology files32,33,34. Each complex was placed in a TIP3P water box under periodic boundary conditions with a minimum solute-to-box distance of 1.0 nm. Sodium and chloride ions were added to neutralize the net charge in each system, and additional NaCl was added to achieve a final ionic strength of 0.15 M.
Energy minimization was performed using the steepest-descent algorithm until the maximum force fell below 1000 kJ·mol⁻1·nm⁻1. The minimized systems were then equilibrated under constant particle number, pressure, and temperature (NPT) conditions at 310 K and 1 bar with positional restraints applied to the protein backbone. Temperature was controlled with the V-rescale thermostat, and pressure with the Parrinello-Rahman barostat. Long-range electrostatic interactions were calculated using the particle mesh Ewald method. The short-range electrostatic cutoff and van der Waals cutoff were both set to 1.0 nm, and all bonds involving hydrogen atoms were constrained using the linear constraint solver (LINCS) algorithm. Production trajectories were generated for 150 ns with a 2-fs integration time step, and coordinates were saved every 10 ps for subsequent analysis.
Trajectory analysis
Trajectory analyses were performed on the equilibrated portions of the production trajectories. Protein backbone RMSD and ligand RMSD were calculated after least-squares fitting to the initial reference conformation. Root mean square fluctuation (RMSF) values were calculated on a per-residue basis using Cα atoms. Hydrogen-bond analysis between each ligand and its receptor was performed using a donor-acceptor distance cutoff of 3.5 Å and a donor-hydrogen-acceptor angle cutoff of 30°. Hydrogen-bond occupancy was defined as the proportion of analyzed frames in which a given hydrogen bond was present. These metrics were used to characterize structural stability, residue-level flexibility, and persistence of intermolecular contacts across the three MD trajectories.
Molecular mechanics Poisson-Boltzmann surface area (MM-PBSA) binding free-energy calculation
Binding free energy was calculated using the MM-PBSA method implemented with MM-PBSA analysis software on the equilibrated segments of the MD trajectories35. For each protein-ligand complex, the final 50 ns of the 150 ns production trajectory was used for free-energy analysis. A total of 500 evenly spaced frames were sampled at 100 ps intervals from 100.0 ns through 149.9 ns; the 150.0 ns endpoint was excluded from the sampled set. The total binding free energy was calculated as the sum of the van der Waals energy, electrostatic energy, polar solvation energy, and nonpolar solvation energy terms:
ΔG_bind = ΔE_vdW + ΔE_ele + ΔG_polar + ΔG_nonpolar (1)
No entropy correction was applied. Mean binding free energies and standard deviations were calculated across all sampled frames.
Reproducibility and computational validation controls
All gene names used in the target-prediction, disease-target retrieval, and intersection-analysis steps were standardized to official human gene symbols before downstream analysis. Identical docking parameters were maintained across all receptor-ligand pairs. The docking setup was technically checked by redocking the corresponding co-crystallized ligand into each receptor pocket using the same search settings and the prespecified heavy-atom RMSD acceptance threshold of <2.0 Å. The crystallographic MMP9–NFH complex was retained as the positive structural reference for the catalytic Zn2⁺ environment, while SRC–Compound 6 served as the matched non-trapping comparator for the SRC trajectory analysis. MD trajectories were inspected for temperature and pressure stability and for the absence of abnormal box-volume drift before inclusion in subsequent analyses. All input files, receptor structures, ligand topology files, docking configuration files, MD parameter files, and MM-PBSA frame-selection records were archived to support computational reproducibility.
Results
Prediction of compound-associated targets and identification of intersecting targets
Reverse target prediction of Compounds 1–3 yielded 212 potential human targets. In parallel, disease-target retrieval from GeneCards using the keyword “lung cancer H1299” and a relevance-score threshold greater than 0.27 identified 188 NSCLC-associated targets. Intersection analysis between the compound-predicted targets and the disease-associated target pool yielded 21 overlapping targets, which were retained for all subsequent analyses. The overlap between the two target sets is shown in Figure 2. These results indicate that the study compounds converged on a restricted subset of disease-relevant targets rather than a diffuse, nonspecific target space.
Protein-protein interaction analysis and screening of core targets
The 21 intersecting targets were imported into STRING to construct a PPI network. The resulting network contained 21 nodes and 116 edges. The node-degree values in Supplementary Table 1 sum to 232, consistent with 116 undirected edges. Centrality values were calculated for this original network. The median degree was 12; applying a degree ≥ 12 retained 13 candidates. Among these 13 candidates, the median betweenness centrality was 0.031293, and the median closeness centrality was 0.769231. Applying betweenness centrality ≥ 0.031293 together with closeness centrality > 0.769231 prioritized five hub candidates: AKT1, EGFR, TNF, MMP9, and SRC. The values shown for the retained subsets are the original 21-node network centrality metrics carried forward during filtering; they were not recomputed for 13-node or 5-node subnetworks. Their network centrality was used only to rank candidates for subsequent structure-based evaluation and should not be interpreted as evidence that they are biological targets of the compounds. Supplementary Table 1, Supplementary Table 2, and Supplementary Table 3 report the metrics for the initial 21-node network, the 13 candidates retained after the first screening step, and the final five hub candidates, respectively. The sequential PPI network screening and the final five hub candidates are shown in Figure 3A, Figure 3B, Figure 3C, and Figure 3D.
Gene Ontology and Kyoto Encyclopedia of Genes and Genomes enrichment analysis
Functional enrichment analysis of the 21 intersecting targets identified 121 KEGG pathways meeting the nominal p < 0.10 inclusion criteria. The 20 highest-ranked pathways are shown in Figure 4A. Among these, endocrine resistance, cancer pathways, proteoglycans in cancer, EGFR tyrosine kinase inhibitor resistance, and the ErbB signaling pathway were particularly prominent. These pathways are closely related to tumor proliferation, survival, invasion, and treatment resistance in NSCLC. Complete enrichment statistics for all 121 retained KEGG pathways meeting nominal p < 0.10 are provided in Supplementary Table 4.
GO enrichment analysis further identified 177 BP terms, 29 CC terms, and 61 MF terms meeting the same nominal p < 0.10 inclusion criterion. The 10 highest-ranked terms from each category are shown in Figure 4B, Figure 4C, and Figure 4D. The dominant biological processes included positive regulation of vascular-associated smooth muscle cell proliferation, the G2/M transition of the mitotic cell cycle, insulin-like growth factor receptor signaling, protein phosphorylation, negative regulation of apoptosis, and signal transduction. The main cellular component terms were nucleus, membrane raft, focal adhesion, plasma membrane, and telomeric region of the chromosome. In contrast, the top molecular-function terms shown in Figure 4D included protein kinase activity, protein serine kinase activity, ATP binding, protein serine/threonine kinase activity, protein tyrosine kinase activity, RNA polymerase II CTD heptapeptide repeat kinase activity, kinase activity, histone H2AXY142 kinase activity, histone H3Y41 kinase activity, and identical protein binding. The full enrichment statistics for BP, CC, and MF are provided in Supplementary Table 5, Supplementary Table 6, and Supplementary Table 7. Together, these enrichment results indicate that the intersecting target set is concentrated in signaling, survival regulation, and oncogenic-response processes relevant to NSCLC progression.
Molecular docking-based prioritization of metabolite-target complexes
Molecular docking was performed between Compound 4 and Compound 5 and the five proteins prioritized by network topology. The values reported in Table 1 are AutoDock Vina docking scores and are not experimentally measured binding free energy. Compound 5 produced the most favorable single score with MMP9 (-8.418 kcal·mol⁻1), followed by Compound 4 with MMP9 (-7.840 kcal·mol⁻1). Compound 5 also scored more favorably than Compound 4 for AKT1 and EGFR, whereas Compound 4 scored slightly more favorably for SRC (-6.549 versus -6.204 kcal·mol⁻1) and TNF (-5.436 versus -5.299 kcal·mol⁻1). Thus, Compound 5 did not show a uniform scoring advantage across the five proteins. The docking results were used only to prioritize representative complexes for further structural analysis.
Representative docking conformations are shown in Figure 5. In the top-ranked MMP9–Compound 5 interaction map, the displayed contacts were located near Ala417 and Pro421, with distances of approximately 3.0 Å and 2.4 Å, respectively. No direct Compound 5-ZN2⁺ coordination was annotated in the retained top-pose interaction map, and no direct contacts with His401, Glu402, His405, or His411 were shown. This contrasts with the 1GKC crystallographic reference, in which His401, His405, and His411 coordinate the catalytic ZN2⁺ at 2.21, 2.23, and 2.22 Å, and the reverse-hydroxamate inhibitor NFH coordinates the same ZN2⁺ through two oxygen atoms at 2.07 and 2.38 Å. Because direct Compound 5-ZN2⁺ coordination was not annotated in the retained interaction map, no Compound 5-ZN2⁺ coordination distance was assigned; this is interpreted as the absence of demonstrated direct coordination in the retained map rather than as a measured metal-separation value. A three-dimensional comparison with the MMP9–NFH crystallographic reference is shown in Supplementary Figure 1. The geometry, therefore, differs from a canonical zinc-dependent inhibitory binding mode, and the present docking result does not support classifying Compound 5 as an MMP9 inhibitor. MMP9 was retained for MD analysis only to determine whether this specific noncanonical docking geometry persisted during the trajectory. For the other complexes, Compound 5 showed predicted contacts with AKT1 and SRC, whereas Compound 4 also formed defined docking interactions with MMP9 and SRC. Consistent with Figure 5F, these observations describe predicted interactions and relative docking scores, not experimentally verified affinities.
Three complexes were selected for MD analysis for comparative, rather than confirmatory, purposes. MMP9–Compound 5 was selected because it had the most favorable single docking score but a noncanonical MMP9 pose that required cautious structural follow-up. SRC–Compound 5 was selected as a second candidate complex, and SRC–Compound 6 was included as the matched non-trapping control trajectory. The corresponding initial conformations are shown in Figure 6A, Figure 6B, and Figure 6C. This design enabled comparison of the persistence of selected docking geometries without treating MD stability as evidence of target engagement or functional regulation.
Molecular dynamics analysis
To compare the persistence of selected docking-derived geometries under dynamic aqueous conditions, 150 ns MD trajectories were generated for the MMP9–Compound 5 and SRC (PDB 2H8H)–Compound 5 complexes, with SRC (PDB 2H8H)–Compound 6 included as the matched negative-control trajectory. The initial conformations are shown in Figure 6A, Figure 6B, and Figure 6C. Across these trajectories, Compound 5 showed lower ligand RMSD (Figure 6D) in the MMP9 and SRC systems than Compound 6 in SRC. The MMP9–Compound 5 trajectory reached a comparatively low-fluctuation regime, the SRC–Compound 5 trajectory stabilized after an initial adjustment period, and the SRC–Compound 6 trajectory showed larger fluctuations. These differences indicate greater persistence of the selected Compound 5 docking poses during MD. They do not demonstrate that Compound 5 binds MMP9 or SRC in cells, and the MMP9 trajectory does not overcome the absence of a canonical catalytic-ZN2⁺ interaction in the starting pose.
The protein backbone RMSD showed a similar comparative pattern. The MMP9–Compound 5 trajectory entered a relatively stable backbone regime after approximately 30 ns, whereas the SRC–Compound 5 trajectory showed a later plateau, and the SRC–Compound 6 trajectory displayed larger fluctuations. These observations describe trajectory behavior only. A stable protein backbone or ligand trajectory cannot establish intracellular target occupancy, enzyme inhibition, or signaling modulation. Protein-backbone RMSD profiles for all three systems are provided in Supplementary Figure 2.
Trajectory analysis
Hydrogen-bond occupancy and residue-fluctuation analyses were used to describe contact persistence within the MD trajectories (Figure 7A). Compound 5 showed a high-occupancy hydrogen bond with Arg95 in the MMP9 trajectory (>85%) and a recurrent interaction with Leu325 in the SRC trajectory (>70%), whereas representative contacts in the SRC–Compound 6 control had lower occupancies. These residues are not presented as evidence of functional target modulation; the occupancy values only indicate how frequently the specified contacts occurred during the analyzed trajectories.
RMSF analysis of the binding-pocket residues showed system-specific differences in local flexibility (Figure 7B). The SRC–Compound 6 trajectory displayed several larger local fluctuations than the SRC–Compound 5 trajectory, whereas the MMP9–Compound 5 trajectory showed a comparatively restrained fluctuation profile within its own binding-pocket residue set. Because MMP9 and SRC are different proteins, their residue-level RMSF values were not interpreted as a direct residue-by-residue comparison. Together with hydrogen-bond occupancy, these results characterize contact persistence and local flexibility, helping to prioritize complexes for experimental testing. They do not establish MMP9 or SRC as intracellular targets or demonstrate that either protein mediates the anticancer phenotype of the compounds.
Molecular mechanics Poisson-Boltzmann surface area binding free-energy calculation
MM-PBSA estimates calculated from the equilibrated trajectory segments are shown in Figure 8. The MMP9–Compound 5 complex yielded a ΔG_bind estimate of -19.65 ± 6.43 kcal·mol⁻1, the SRC–Compound 5 complex yielded -17.72 ± 6.84 kcal·mol⁻1, and the SRC–Compound 6 control yielded -10.37 ± 5.61 kcal·mol⁻1. Within this computational protocol, the relative energetic ranking was therefore MMP9–Compound 5, followed by SRC–Compound 5 and SRC–Compound 6. These values are method-dependent estimates derived from a finite trajectory segment, and no entropy correction was applied. They were therefore used for within-study comparison only and should not be interpreted as experimentally measured binding affinities or as evidence of functional protein modulation.
Across docking, MD, contact-occupancy, residue-fluctuation, and MM-PBSA analyses, Compound 5 was computationally prioritized for follow-up in the MMP9 and SRC complexes. Convergence among these calculations strengthens the rationale for choosing these pairs for subsequent experiments, but it does not validate MMP9 or SRC as direct intracellular targets. In particular, the noncanonical MMP9 pose and absence of demonstrated catalytic ZN2⁺ coordination preclude inference of a canonical MMP9 inhibitory mechanism from the present structural data.
Conclusions derived from the results
The computational workflow prioritized 21 overlapping disease-associated targets and identified AKT1, EGFR, TNF, MMP9, and SRC as topological hub candidates. Structure-based analyses further prioritized Compound 5 for experimental follow-up in the MMP9 and SRC complexes. These findings do not demonstrate direct target engagement, MMP9 or SRC inhibition, pathway regulation, or a causal mechanistic connection between protein interactions and the previously established abasic-site-trapping effect. The study therefore supports a set of testable computational hypotheses rather than an experimentally established multi-target anti-NSCLC mechanism.
DATA AVAILABILITY:
The dataset supporting the findings of this study is publicly available in Wang X, Peng Z, Xing Y, Xue L. In silico prioritization of potential protein interactions for glutathione-responsive abasic site-trapping prodrugs in non-small cell lung cancer [dataset]. Figshare; 2026. doi:10.6084/m9.figshare.33313620.v1.
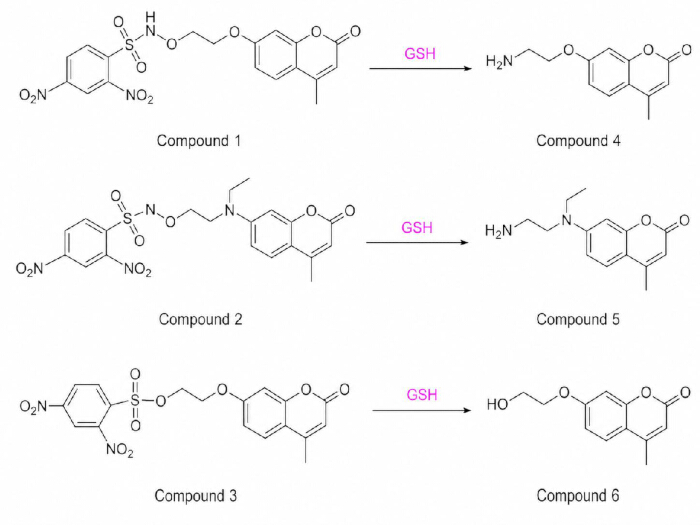
Figure 1: Chemical structures and glutathione-triggered conversion relationships of the study compounds. Compound 1 and Compound 2 are glutathione-responsive prodrugs that release the aminooxy-containing metabolites Compound 4 and Compound 5, respectively. Compound 3 is a matched glutathione-responsive structural control that generates Compound 6, which lacks the aminooxy abasic-site-trapping functionality. Compounds 1–3 were used for reverse target prediction, Compound 4 and Compound 5 for hub-target docking, and Compound 6 as the negative-control ligand in the SRC molecular dynamics comparison. Abbreviations: SRC, SRC proto-oncogene, non-receptor tyrosine kinase. Please click here to view a larger version of this figure.
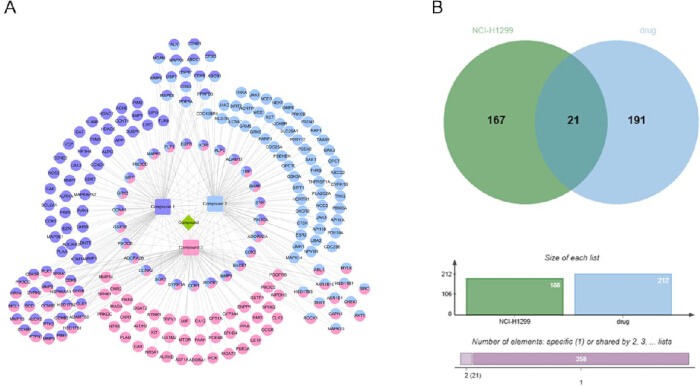
Figure 2: Intersection between compound-predicted targets and non-small cell lung cancer-associated targets. (A) Compound-target network generated from the reverse target-prediction results for Compounds 1–3. (B) Venn diagram showing the overlap between compound-predicted targets and disease-associated targets retrieved using the H1299 lung-cancer query. The 21 intersecting targets were retained for protein-protein interaction analysis, enrichment analysis, and subsequent structure-based prioritization. Please click here to view a larger version of this figure.
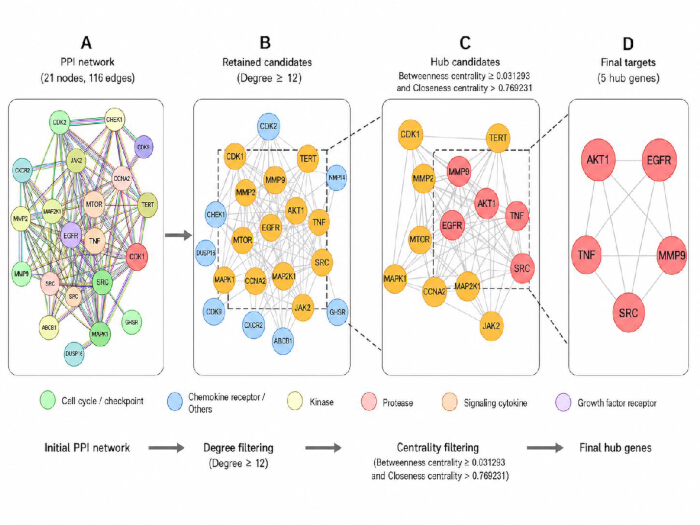
Figure 3: Protein-protein interaction network and core target screening. (A) Protein-protein interaction network of the 21 intersecting targets (116 edges). (B) First screening step using Degree ≥ 12, which retained 13 candidates. (C) Second screening of the 13 retained candidates using betweenness centrality ≥ 0.031293 and Closeness centrality > 0.769231, which yielded five hub candidates. (D) Final five hub candidates: AKT1, EGFR, TNF, MMP9, and SRC. Centrality values used for the sequential filters were calculated on the original 21-node, 116-edge network and carried forward rather than recalculated after each subset was formed. Abbreviations: AKT1, AKT serine/threonine kinase 1; EGFR, epidermal growth factor receptor; TNF, tumor necrosis factor; MMP9, matrix metalloproteinase 9; SRC, SRC proto-oncogene, non-receptor tyrosine kinase. Please click here to view a larger version of this figure.
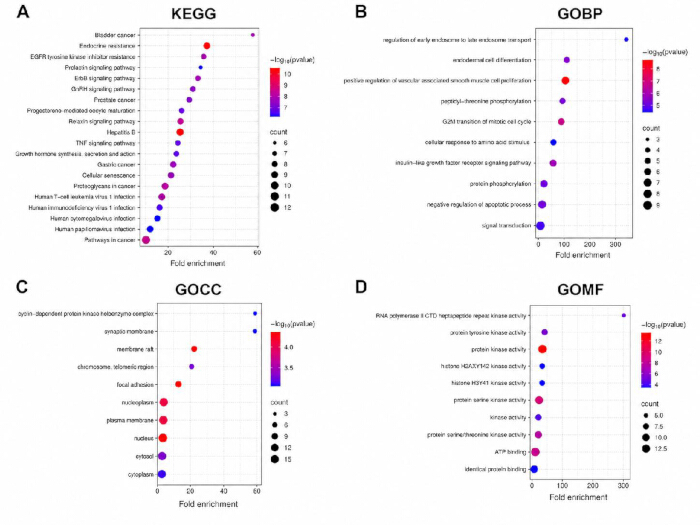
Figure 4: Functional enrichment analysis of the intersecting targets. (A) Bubble plot of the top 20 enriched Kyoto Encyclopedia of Genes and Genomes pathways. (B) Bar plot of the top 10 enriched Gene Ontology biological process terms. (C) Bar plot of the top 10 enriched Gene Ontology cellular component terms. (D) Bar plot of the top 10 enriched Gene Ontology molecular function terms. Fold enrichment is shown on the x-axis in the final visualization; bubble size in panel A reflects gene count. All underlying KEGG and GO entries included in Supplementary Tables 4–7 met the nominal p < 0.10 inclusion criterion; plotted pathways/terms were the highest-ranked by nominal p-value. Multiple-testing-adjusted values are reported in the supplementary tables but were not used for inclusion. Please click here to view a larger version of this figure.
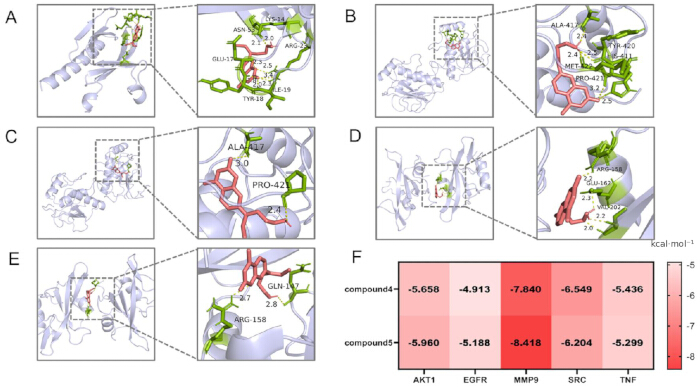
Figure 5: Molecular docking poses and AutoDock Vina scores of Compound 4 and Compound 5 with the prioritized proteins. (A) Predicted docking pose of Compound 5 with AKT1. (B) Predicted docking pose of Compound 4 with MMP9. (C) Top-ranked predicted pose of Compound 5 with MMP9; the displayed contacts are near Ala417 and Pro421, while no direct catalytic ZN2⁺ coordination or direct contact with His401, Glu402, His405, or His411 is annotated. The pose is therefore not presented as a canonical MMP9 inhibitory binding mode. A reference interaction-map comparison with the NFH-bound MMP9 crystal structure (PDB 1GKC), including the crystallographic ZN2⁺ coordination distances, is provided in Supplementary Figure 3. (D) Predicted docking pose of Compound 4 with SRC. (E) Predicted docking pose of Compound 5 with SRC. (F) Heatmap of AutoDock Vina docking scores (kcal·mol⁻1) for Compound 4 and Compound 5 against the five prioritized proteins. More negative values indicate more favorable Vina scores within this docking protocol; they are not experimentally measured binding affinities. Abbreviations: AKT1, AKT serine/threonine kinase 1; MMP9, matrix metalloproteinase 9; NFH, N2-[(2R)-2-{[formyl(hydroxy)amino]methyl}-4-methylpentanoyl]-N,3-dimethyl-L-valinamide; SRC, SRC proto-oncogene, non-receptor tyrosine kinase; PDB, Protein Data Bank; Ala, alanine; Pro, proline; His, histidine; and Glu, glutamate. Please click here to view a larger version of this figure.
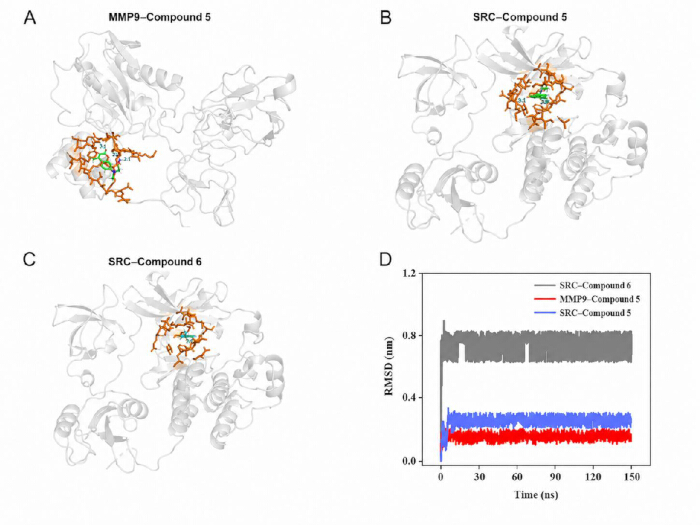
Figure 6: Structural overview and ligand-stability analysis of the MD complexes. (A) Initial docking conformation of Compound 5 with MMP9 used as the starting structure for MD. (B) Initial docking conformation of Compound 5 with SRC (PDB 2H8H). (C) Initial docking conformation of Compound 6 with SRC (PDB 2H8H); Compound 6 is the glutathione-cleavage product of control Compound 3 and lacks the aminooxy abasic-site-trapping functionality. (D) Ligand root mean square deviation relative to the initial docking pose over the 150 ns trajectories for MMP9–Compound 5, SRC–Compound 5, and SRC–Compound 6. The panel compares pose persistence during MD and does not demonstrate intracellular target engagement. Abbreviations: MD, molecular dynamics; MMP9, matrix metalloproteinase 9; SRC, SRC proto-oncogene, non-receptor tyrosine kinase; PDB, Protein Data Bank; RMSD, root mean square deviation. Please click here to view a larger version of this figure.
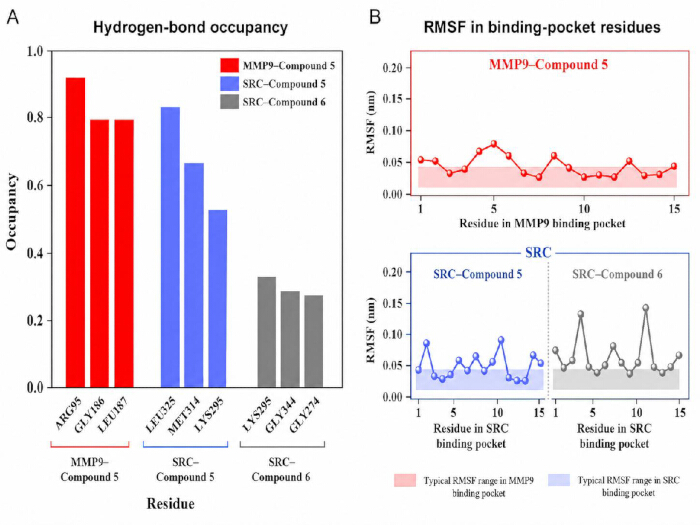
Figure 7: Dynamic interaction features during molecular dynamics analysis. (A) Occupancy of representative ligand-protein hydrogen bonds during the 150 ns trajectories for MMP9–Compound 5, SRC–Compound 5, and SRC–Compound 6. (B) Root mean square fluctuation of binding-pocket residues. The MMP9 profile is interpreted within the MMP9 system, whereas the SRC–Compound 5 and SRC–Compound 6 profiles provide the direct matched comparison within SRC. These analyses describe contact persistence and local flexibility during MD and do not demonstrate intracellular target engagement or functional modulation of MMP9 or SRC. Abbreviations: MD, molecular dynamics; MMP9, matrix metalloproteinase 9; SRC, SRC proto-oncogene, non-receptor tyrosine kinase; RMSF, root mean square fluctuation. Please click here to view a larger version of this figure.
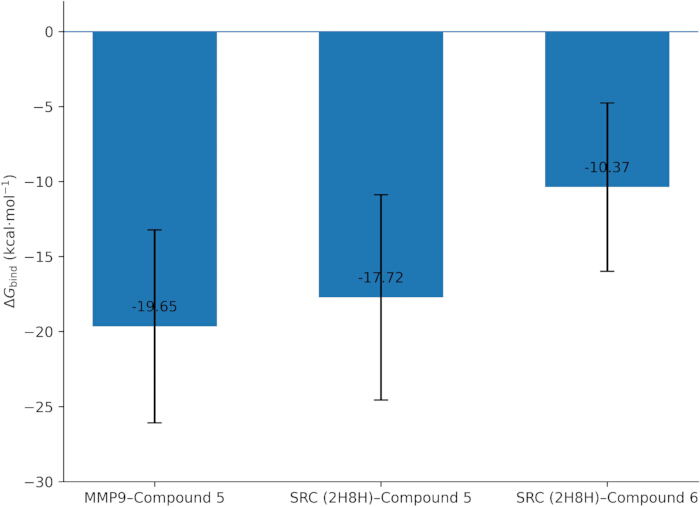
Figure 8: Molecular mechanics Poisson-Boltzmann surface area energetic estimates for the analyzed complexes. Estimated ΔG_bind values obtained by the molecular mechanics Poisson-Boltzmann surface area method from the equilibrated trajectory segments of the MMP9–Compound 5, SRC (PDB 2H8H)–Compound 5, and SRC (PDB 2H8H)–Compound 6 complexes. Values are presented as mean ± standard deviation and are used for relative within-study comparison rather than as experimentally measured binding affinities. Figure 8 uses the y-axis label ΔG_bind (kcal·mol⁻1), consistent with the equation and terminology used in the Methods and Results. Abbreviations: MMP9, matrix metalloproteinase 9; SRC, SRC proto-oncogene, non-receptor tyrosine kinase; PDB, Protein Data Bank; ΔG_bind, binding free energy; MM-PBSA, molecular mechanics Poisson–Boltzmann surface area. Please click here to view a larger version of this figure.
| Compound | AKT1 (kcal·mol⁻¹) | EGFR (kcal·mol⁻¹) | MMP9 (kcal·mol⁻¹) | SRC (kcal·mol⁻¹) | TNF (kcal·mol⁻¹) |
| Compound 4 | -5.658 | -4.913 | -7.840 | -6.549 | -5.436 |
| Compound 5 | -5.960 | -5.188 | -8.418 | -6.204 | -5.299 |
Table 1: AutoDock Vina docking scores of Compound 4 and Compound 5 against the five prioritized proteins. AutoDock Vina docking scores (kcal·mol⁻1) for Compound 4 and Compound 5 with AKT1, EGFR, MMP9, SRC, and TNF. More negative values indicate more favorable scores within the specified docking protocol. These values are computational scores and should not be described as experimentally measured binding free energies or affinities. Abbreviations: AKT1, AKT serine/threonine kinase 1; EGFR, epidermal growth factor receptor; MMP9, matrix metalloproteinase 9; SRC, SRC proto-oncogene, non-receptor tyrosine kinase; TNF, tumor necrosis factor.
Supplementary Figure 1: Structural comparison of the MMP9–NFH crystallographic reference and the top-ranked MMP9–Compound 5 docking pose. (A) Catalytic ZN2⁺ environment of the MMP9–NFH reference complex (PDB 1GKC), showing His401, His405, His411, Glu402, and the displayed NFH coordination distances. (B) Top-ranked Compound 5 docking pose showing the displayed Ala417 and Pro421 contacts. (C) Alternative three-dimensional view of the same Compound 5 docking pose. The comparison is provided as a structural reference and does not establish MMP9 inhibition. Abbreviations: MMP9, matrix metalloproteinase 9; NFH, N2-[(2R)-2-{[formyl(hydroxy)amino]methyl}-4-methylpentanoyl]-N,3-dimethyl-L-valinamide; PDB, Protein Data Bank; Ala, alanine; Pro, proline; His, histidine; Glu, glutamate.Please click here to download this file.
Supplementary Figure 2: Protein backbone root mean square deviation during molecular dynamics analysis. Protein-backbone root mean square deviation profiles for the MMP9–Compound 5, SRC (PDB 2H8H)–Compound 5, and SRC (PDB 2H8H)–Compound 6 systems over the full molecular dynamics trajectories. The final plot uses the standardized labels MMP9–Compound 5, SRC–Compound 5, and SRC–Compound 6, with axes reported as RMSD (nm) and Time (ns). The profiles describe time-dependent conformational behavior during MD and should not be interpreted as evidence of cellular binding or protein regulation. Abbreviations: MMP9, matrix metalloproteinase 9; SRC, SRC proto-oncogene, non-receptor tyrosine kinase; PDB, Protein Data Bank; RMSD, root mean square deviation; MD, molecular dynamics.Please click here to download this file.
Supplementary Figure 3: Comparison of the MMP9 catalytic ZN2⁺ environment in the 1GKC-NFH reference complex and the top-ranked Compound 5 docking pose. In the crystallographic MMP9–NFH reference complex (PDB 1GKC), His401, His405, and His411 coordinate the catalytic ZN2⁺ at 2.21, 2.23, and 2.22 Å, respectively, and two NFH oxygen atoms coordinate ZN2⁺ at 2.07 and 2.38 Å; Glu402 is the catalytic acid/base residue. In contrast, the retained top-ranked Compound 5 interaction map displays contacts with Ala417 (3.0 Å) and Pro421 (2.4 Å) but no annotated direct ZN2⁺ coordination or direct contacts with His401, Glu402, His405, or His411. Accordingly, no Compound 5-ZN2⁺ coordination distance was assigned. This comparison supports classification of the Compound 5 pose as a noncanonical predicted association rather than a canonical zinc-dependent inhibitory binding mode. Abbreviations: MMP9, matrix metalloproteinase 9; PDB, Protein Data Bank; Ala, alanine; Pro, proline; His, histidine; Glu, glutamate.Please click here to download this file.
Supplementary Table 1: Topological metrics for the initial 21-node, 116-edge protein-protein interaction network. Topological parameters for all 21 intersecting-target nodes before centrality-based screening, including average shortest path length, betweenness centrality, closeness centrality, clustering coefficient, degree, eccentricity, neighborhood connectivity, radiality, stress, and topological coefficient. The node degrees sum to 232, which corresponds to 116 undirected edges.Please click here to download this file.
Supplementary Table 2: Original-network topological metrics for the 13 candidates retained after degree-based screening. Topological parameters for the 13 nodes retained after applying the degree criterion to the initial 21-node, 116-edge network. These values are the original 21-node, 116-edge network metrics carried forward for the subsequent betweenness- and closeness-centrality filtering step; they were not recomputed on a 13-node subnetwork.Please click here to download this file.
Supplementary Table 3: Original-network topological metrics for the final five hub candidates retained after sequential filtering. Original 21-node, 116-edge network topological parameters for the final five hub candidates, AKT1, EGFR, TNF, MMP9, and SRC, retained after sequential filtering. These carried-forward values support network-based prioritization only and do not represent metrics recomputed on a five-node subnetwork or establish the proteins as experimentally validated drug targets. Abbreviations: AKT1, AKT serine/threonine kinase 1; EGFR, epidermal growth factor receptor; TNF, tumor necrosis factor; MMP9, matrix metalloproteinase 9; SRC, SRC proto-oncogene, non-receptor tyrosine kinase.Please click here to download this file.
Supplementary Table 4: Complete Kyoto Encyclopedia of Genes and Genomes enrichment results for 121 pathways meeting the nominal p < 0.10 inclusion criterion. Complete Kyoto Encyclopedia of Genes and Genomes enrichment statistics for all 121 retained pathways among the 21 intersecting targets (nominal p < 0.10), including gene ratio, gene counts, list totals, population hits, population totals, p-values, Benjamini values, fold enrichment, Bonferroni values, false discovery rates, and Fisher's exact test values. The 20 highest-ranked pathways are visualized in Figure 4A. The nominal p-value criterion defined inclusion; Benjamini, Bonferroni, and false discovery rate values are reported for transparency and were not used to define the retained set.Please click here to download this file.
Supplementary Table 5: Complete Gene Ontology biological process enrichment results (177 terms meeting nominal p < 0.10). Complete enrichment statistics for all 177 retained Gene Ontology biological process terms (nominal p < 0.10), including gene ratio, gene count, list total, population hits, population total, p-value, Benjamini value, fold enrichment, Bonferroni value, false discovery rate, and Fisher's exact test value. The 10 highest-ranked terms are visualized in Figure 4B. The nominal p-value criterion defined inclusion; adjusted values are reported for transparency and were not used to define the retained set.Please click here to download this file.
Supplementary Table 6: Complete Gene Ontology cellular component enrichment results (29 terms meeting nominal p < 0.10). Complete enrichment statistics for all 29 retained Gene Ontology cellular component terms (nominal p < 0.10), including gene ratio, gene count, list total, population hits, population total, p-value, Benjamini value, fold enrichment, Bonferroni value, false discovery rate, and Fisher's exact test value. The 10 highest-ranked terms are visualized in Figure 4C. The nominal p-value criterion defined inclusion; adjusted values are reported for transparency and were not used to define the retained set.Please click here to download this file.
Supplementary Table 7: Complete Gene Ontology molecular function enrichment results (61 terms meeting nominal p < 0.10). Complete enrichment statistics for all 61 retained Gene Ontology molecular function terms (nominal p < 0.10), including gene ratio, gene count, list total, population hits, population total, p-value, Benjamini value, fold enrichment, Bonferroni value, false discovery rate, and Fisher's exact test value. The 10 highest-ranked terms are visualized in Figure 4D. The nominal p-value criterion defined inclusion; adjusted values are reported for transparency and were not used to define the retained set.Please click here to download this file.
Discussion
The present study should be interpreted within a two-level mechanistic framework. The first level is supported by previous experimental work: glutathione-responsive activation releases an aminooxy-containing species that can trap aldehydic abasic sites, and the compound class showed selective cytotoxicity, cell-cycle effects, and apoptosis in H1299 cells. The second level is exploratory and is the focus of the current work: computational target prediction and structure-based analyses suggest that the same chemical series may also be compatible with selected cancer-associated proteins. No experiment in this study demonstrates that predicted protein interactions occur in cells or that they are downstream consequences of abasic-site trapping. The two levels are therefore intentionally kept separate rather than combined into a proven multi-target mechanism.
At the network level, the 21 intersecting targets were enriched in cancer- and resistance-related pathways, and AKT1, EGFR, TNF, MMP9, and SRC occupied central positions in the PPI network. These results are useful for candidate prioritization, but network centrality and enrichment cannot show that a compound physically engages a protein or changes a pathway. Hub proteins should therefore be considered candidates for targeted validation. Establishing a functional role would require direct perturbation or target-engagement experiments in the same NSCLC cell line used to measure the cellular phenotype.
MMP9 illustrates why this distinction is important. Compound 5 had the most favorable single docking score with MMP9, but the retained top-pose interaction map did not annotate direct coordination of the catalytic Zn2+ ion or direct engagement of His401, Glu402, His405, or His411. In the 1GKC crystallographic reference, His401, His405, and His411 coordinate Zn2+ at 2.21, 2.23, and 2.22 Å, while the two NFH oxygen atoms coordinate Zn2+ at 2.07 and 2.38 Å; Glu402 is the catalytic acid/base residue. The Compound 5 map instead showed contacts near Ala417 and Pro421. Supplementary Figure 3 presents the reference interaction map comparison. Because direct Compound 5-Zn2+ coordination was not annotated, no Compound 5-Zn2+ coordination distance was assigned. Accordingly, the current structural result is best described as a noncanonical predicted association with MMP9, not as evidence of catalytic-site inhibition. The subsequent MD trajectory only tests whether that specific docking pose remains persistent over time; it cannot convert a noncanonical docking geometry into proof of enzymatic inhibition36,37. MMP9 should therefore remain a candidate for biochemical testing rather than a principal or validated target. MMP9 has been widely discussed in relation to cancer invasion, tumor-microenvironment remodeling, and MMP9–directed therapeutic strategies38,39.
The same evidentiary boundary applies to SRC. The SRC–Compound 5 trajectory exhibited more persistent contacts than the SRC–Compound 6 control, but MD stability does not equate to intracellular target occupancy40,41. The use of Compound 6 provides a matched comparison for the non-trapping cleavage product and strengthens the internal structural comparison, yet it does not prove that the aminooxy functionality is responsible for SRC binding or that SRC signaling is altered in cells. Direct assessment of total SRC, p-SRC/SRC, downstream signaling markers, and orthogonal target-engagement measurements would be required to support such a claim.
MM-PBSA likewise provides a relatively energetic estimate for the sampled trajectories rather than an experimental affinity measurement. The more favorable estimates for MMP9–Compound 5 and SRC–Compound 5 than for SRC–Compound 6 are consistent with the comparative trajectory observations, but the calculations are sensitive to the sampled conformations and methodological approximations, and the present analysis did not include an entropy correction. Agreement among docking, MD, and MM-PBSA therefore increases only internal computational consistency; it does not establish functional modulation of MMP9 or SRC.
The relationship between abasic-site trapping and the predicted protein interactions remains unresolved. One possibility is that the glutathione-released aminooxy scaffold retains its established DNA lesion-trapping activity while also having independent, parallel interactions with selected proteins. Another possibility is that some predicted protein interactions do not occur at biologically relevant concentrations or do not contribute to the phenotype. The current data cannot distinguish these possibilities. Demonstrating a mechanistic bridge would require simultaneous measurement of DNA damage responses and protein pathway changes after compound treatment, followed by perturbation experiments demonstrating that altering a candidate target alters the anticancer phenotype.
Future experimental validation should be performed in H1299 cells, the same cellular model used in the previous experimental characterization of this chemical series. A staged strategy would first compare Compound 5 with vehicle and the matched non-trapping Compound 6 using concentration-response viability, apoptosis, cell-cycle, migration/invasion, and γH2AX assays to establish the phenotypic and DNA-damage context42. MMP9 should then be examined by gelatin zymography and protein-expression analysis, while SRC signaling should be assessed through total SRC and Tyr416-phosphorylated SRC, with the p-SRC/SRC ratio used as the principal signaling readout. Direct compound-protein association should be evaluated independently using an orthogonal target-engagement method such as surface plasmon resonance43. A candidate interaction should be considered experimentally supported only when direct-binding evidence is concordant with the corresponding cellular functional readout. Genetic or pharmacological perturbation of MMP9 or SRC would provide a further test of whether either candidate contributes causally to the H1299 phenotype. This staged framework preserves the distinction between the previously established abasic-site-trapping activity and the computationally prioritized MMP9/SRC interaction hypotheses, while defining a direct route for subsequent experimental testing.
Disclosures
The authors declare that they have no competing financial interests or other conflicts of interest related to this work. The funders had no role in the design of the study; in the collection, analysis, or interpretation of the data; in the writing of the manuscript; or in the decision to publish the results.
Acknowledgements
This work was supported by the Youth Project of the Liaoning Provincial Department of Education (JYTQN2023441), the Doctoral Research Initiation Project of the Liaoning Provincial Joint Fund of the Science and Technology Department (2023-BSBA-151), and the Young Scientific and Technological Talent Support Project of Jinzhou Medical University (JYQT202305). ChatGPT (OpenAI) was used during manuscript revision for language editing, organization, and revision support. The authors reviewed and verified the scientific content, data interpretation, and final wording and take full responsibility for the manuscript.
Materials
| Name | Company | Catalog Number | Comments |
|---|---|---|---|
| ACPYPE | ACPYPE developers / Bio2Byte | Version 2023.11.14 | Generation and conversion of small-molecule ligand topology files to GROMACS-compatible format. |
| AmberTools (Antechamber) | AMBER Development Team | AmberTools 23.3 | AM1-BCC partial-charge assignment and GAFF2 ligand parameter generation. |
| AutoDock Vina | Forli Lab, Scripps Research | Version 1.2.5 | Molecular docking and generation of ranked protein-ligand poses. |
| AutoDockTools (MGLTools) | Center for Computational Structural Biology, Scripps Research | Version 1.5.7 | Receptor and ligand preparation, Gasteiger charge assignment, rotatable-bond definition, and PDBQT conversion. |
| BIOVIA Discovery Studio Visualizer | Dassault Systèmes BIOVIA | Version 2025 | Docking-pose visualization and protein-ligand interaction inspection. |
| CHARMM36 force field | MacKerell Laboratory / CHARMM force-field developers | CHARMM36 | Protein parameterization for molecular dynamics calculations; CHARMM36 was used consistently throughout the study (not CHARMM36m). |
| Chem3D Ultra (ChemOffice Professional) | Revvity Signals Software | Version 22.2 | Ligand energy minimization using the MMFF94 force field. |
| Compounds 1–6 | Previously synthesized as described in Li et al., ACS Chemical Biology (2022) | N/A | Glutathione-responsive parent prodrugs, released products, and matched non-trapping control pair used in the computational workflow. |
| cytoHubba | cytoHubba developers / Cytoscape App Store | Version 0.1 | Degree, betweenness centrality, and closeness centrality analysis for hub-target prioritization. |
| Cytoscape | Cytoscape Consortium | Version 3.10.0 | Compound-target and PPI network visualization and topology analysis. |
| DAVID Bioinformatics Resources | Laboratory of Human Retrovirology and Immunoinformatics, Frederick National Laboratory for Cancer Research | Web resource | Gene Ontology and KEGG enrichment analysis; nominal p < 0.10 was used as the exploratory inclusion criterion; adjusted values were reported but were not used to define the retained set. |
| GAFF2 | AMBER Development Team | GAFF2 | Ligand force-field parameterization. |
| GeneCards Human Gene Database | GeneCards Suite / LifeMap Sciences, Inc. / Weizmann Institute of Science | Web resource | Retrieval of disease-associated targets using the query 'lung cancer H1299'. |
| gmx_MMPBSA | gmx_MMPBSA Development Team | Version 1.6.3 | MM-PBSA binding free-energy calculations from GROMACS molecular dynamics trajectories; 500 frames were sampled from 100.0–149.9 ns at 100-ps intervals, with the 150.0-ns endpoint excluded; no entropy correction was applied. |
| GROMACS | GROMACS Development Team | Version 2024.4 | Molecular dynamics trajectory generation and trajectory analysis. |
| Microbioinfo online visualization platform | Shanghai Newcore Biotechnology Co., Ltd. / Microbioinfo | Web resource | Generation of enrichment bar charts and bubble plots. |
| Open Babel | Open Babel Development Team | Version 3.1.1 | Conversion of structure files to canonical SMILES for SwissTargetPrediction input. |
| PubChem | National Center for Biotechnology Information, U.S. National Library of Medicine, NIH | Web resource | Retrieval of three-dimensional ligand structures. |
| PyMOL Molecular Graphics System | Schrödinger, LLC | Version 2.5.4 | Protein preparation, structural visualization, and docking-pose inspection. |
| RCSB Protein Data Bank | Research Collaboratory for Structural Bioinformatics (RCSB) | PDB IDs: 3O96; 5UWD; 2AZ5; 1GKC; 2H8H | Protein structure retrieval for AKT1, EGFR, TNF, MMP9, and SRC, respectively. |
| STRING | STRING Consortium | Version 11.5 | Protein-protein interaction network construction; Homo sapiens; minimum required interaction score 0.400; the original topology metrics correspond to the 21-node, 116-edge undirected PPI network. |
| SwissTargetPrediction | Molecular Modeling Group, University of Lausanne / SIB Swiss Institute of Bioinformatics | Web resource | Reverse target prediction for Compounds 1–3; species restricted to Homo sapiens. |
| TIP3P water model | Implemented in GROMACS | TIP3P | Three-site explicit-solvent water model used for solvating protein-ligand complexes. |
| Venny | BioinfoGP, Centro Nacional de Biotecnología (CNB-CSIC) | Version 2.1 | Intersection of compound-predicted and disease-associated target lists. |
References
- Sung H, et al. Global cancer statistics 2020: GLOBOCAN estimates of incidence and mortality worldwide for 36 cancers in 185 countries. CA Cancer J Clin. 2021;71:209-49.
- Herbst RS, Morgensztern D, Boshoff C. The biology and management of non-small cell lung cancer. Nature. 2018;553:446-54.
- Kim J, et al. Updates on the treatment of epidermal growth factor receptor-mutant non-small cell lung cancer. Cancer. 2025;131:e35778.
- Lin Y, Wang X, Jin H. EGFR-TKI resistance in NSCLC patients: mechanisms and strategies. Am J Cancer Res. 2014;4:411-35.
- Dasari S, et al. Pharmacological effects of cisplatin combination with natural products in cancer chemotherapy. Int J Mol Sci. 2022;23:1532.
- Ellie S, et al. Chemotherapy drugs cyclophosphamide, cisplatin and doxorubicin induce germ cell loss in an in vitro model of the prepubertal testis. Sci Rep. 2018;8:1773.
- De Bont R, van Larebeke N. Endogenous DNA damage in humans: a review of quantitative data. Mutagenesis. 2004;19:169-85.
- Ciccia A, Elledge SJ. The DNA damage response: making it safe to play with knives. Mol Cell. 2010;40:179-204.
- David SS, Williams SD. Chemistry of glycosylases and endonucleases involved in base-excision repair. Chem Rev. 1998;98:1221-62.
- Robson CN, Hickson ID. Isolation of cDNA clones encoding a human apurinic/apyrimidinic endonuclease that corrects DNA repair and mutagenesis defects in E. coli xth (exonuclease III) mutants. Nucleic Acids Res. 1991;19:5519-23.
- Sczepanski JT, et al. Rapid DNA-protein cross-linking and strand scission by an abasic site in a nucleosome core particle. Proc Natl Acad Sci U S A. 2010;107:22475-80.
- Krokan HE, Bjørås M. Base excision repair. Cold Spring Harb Perspect Biol. 2013;5:a012583.
- Li X, et al. Selective antitumor activity and photocytotoxicity of glutathione-activated abasic site trapping agents. ACS Chem Biol. 2022;17:797-803.
- Hopkins AL. Network pharmacology: the next paradigm in drug discovery. Nat Chem Biol. 2008;4:682-90.
- Meng XY, et al. Molecular docking: a powerful approach for structure-based drug discovery. Curr Comput Aided Drug Des. 2011;7:146-57.
- Hollingsworth SA, Dror RO. Molecular dynamics simulation for all. Neuron. 2018;99:1129-43.
- Genheden S, Ryde U. The MM/PBSA and MM/GBSA methods to estimate ligand-binding affinities. Expert Opin Drug Discov. 2015;10:449-61.
- O'Boyle NM, et al. Open Babel: an open chemical toolbox. J Cheminform. 2011;3:33.
- Daina A, Michielin O, Zoete V. SwissTargetPrediction: updated data and new features for efficient prediction of protein targets of small molecules. Nucleic Acids Res. 2019;47:W357-64.
- Shannon P, et al. Cytoscape: a software environment for integrated models of biomolecular interaction networks. Genome Res. 2003;13:2498-504.
- Stelzer G, et al. The GeneCards Suite: from gene data mining to disease genome sequence analyses. Curr Protoc Bioinformatics. 2016;54:1.30.1-1.30.33.
- Oliveros JC. Venny: an interactive tool for comparing lists with Venn's diagrams [Internet]. BioinfoGP, CNB-CSIC; 2007-2015.
- Szklarczyk D, et al. The STRING database in 2021: customizable protein-protein networks and functional characterization of user-uploaded gene/measurement sets. Nucleic Acids Res. 2021;49:D605-12.
- Chin CH, et al. cytoHubba: identifying hub objects and subnetworks from complex interactome. BMC Syst Biol. 2014;8:S11.
- Sherman BT, et al. DAVID: a web server for functional enrichment analysis and functional annotation of gene lists (2021 update). Nucleic Acids Res. 2022;50:W216-21.
- Kim S, et al. PubChem 2023 update. Nucleic Acids Res. 2023;51:D1373-80.
- Eberhardt J, et al. AutoDock Vina 1.2.0: new docking methods, expanded force field, and Python bindings. J Chem Inf Model. 2021;61:3891-8.
- Gerek ZN, Ozkan SB. A flexible docking scheme to explore the binding selectivity of PDZ domains. Protein Sci. 2010;19:914-28.
- Abraham MJ, et al. GROMACS: high-performance molecular simulations through multi-level parallelism from laptops to supercomputers. SoftwareX. 2015;1-2:19-25.
- Best RB, et al. Optimization of the additive CHARMM all-atom protein force field targeting improved sampling of backbone and side-chain dihedral angles. J Chem Theory Comput. 2012;8:3257-73.
- Vassetti D, Pagliai M, Procacci P. Assessment of GAFF2 and OPLS-AA general force fields in combination with the water models TIP3P, SPCE, and OPC3 for the solvation free energy of druglike organic molecules. J Chem Theory Comput. 2019;15:1983-95.
- Jakalian A, Jack DB, Bayly CI. Fast, efficient generation of high-quality atomic charges. AM1-BCC model: II. Parameterization and validation. J Comput Chem. 2002;23:1623-41.
- Sousa da Silva AW, Vranken WF. ACPYPE—AnteChamber PYthon Parser interfacE. BMC Res Notes. 2012;5:367.
- Case DA, et al. AmberTools. J Chem Inf Model. 2023;63:6183-91.
- Valdés-Tresanco MS, et al. gmx_MMPBSA: a new tool to perform end-state free-energy calculations with GROMACS. J Chem Theory Comput. 2021;17:6281-91.
- Islam MT, Jang NH, Lee HJ. Natural products as regulators against matrix metalloproteinases for the treatment of cancer. Biomedicines. 2024;12:794.
- Mondal S, et al. Matrix metalloproteinase-9 (MMP-9) and its inhibitors in cancer: a minireview. Eur J Med Chem. 2020;194:112260.
- Rashid ZA, Bardaweel SK. Novel matrix metalloproteinase-9 (MMP-9) inhibitors in cancer treatment. Int J Mol Sci. 2023;24:12133.
- Kessenbrock K, Plaks V, Werb Z. Matrix metalloproteinases: regulators of the tumor microenvironment. Cell. 2010;141:52-67.
- Vandooren J, Van den Steen PE, Opdenakker G. Biochemistry and molecular biology of gelatinase B or matrix metalloproteinase-9 (MMP-9): the next decade. Crit Rev Biochem Mol Biol. 2013;48:222-72.
- Merchant N, et al. Matrix metalloproteinases: their functional role in lung cancer. Carcinogenesis. 2017;38:766-80.
- Chabanon RM, et al. Targeting the DNA damage response in immuno-oncology: developments and opportunities. Nat Rev Cancer. 2021;21:701-17.
- Das S, et al. Surface plasmon resonance as a fascinating approach in target-based drug discovery and development. TrAC Trends Anal Chem. 2024;171:117501.