This protocol describes the isolation, purification, and culture of highly pure human myeloid cells/microglia from rapid-autopsy postmortem brain tissue obtained from people with and without human immunodeficiency virus-1 (HIV-1). It provides a robust ex vivo platform for investigating myeloid cell/microglial biology, brain HIV reservoirs, neuroinflammation, and HIV cure strategies.
Method Article
Isolation of Brain Microglia to Study Persistence of Human Immunodeficiency Virus-1
* These authors contributed equally
In This Article
Summary
Abstract
We have established and optimized a robust protocol to isolate, culture, and study primary human brain myeloid cells (BrMCs) from rapid-autopsy postmortem brain tissues obtained from people with or without HIV-1 (HIV), in which >97.3% of BrMCs are brain microglia (MG). Therefore, we refer to these isolated BrMCs as MG or BrMCs/MG to better represent the cell populations. This method enables comprehensive ex vivo investigation of microglial biology, including their roles in maintaining HIV reservoirs in the brain, mediating neuroinflammation, and contributing to neuronal injury, as well as the evaluation of HIV cure strategies.
To preserve cellular viability and RNA/protein integrity, brain tissues were collected within 6 h after death, following rapid research autopsy. Multiple regions, including the frontal, parietal, and occipital cortices, the hippocampus, and the basal ganglia, were processed using enzymatic digestion and controlled mechanical dissociation, followed by density gradient centrifugation to generate viable single-cell suspensions with efficient removal of myelin debris and erythrocyte lysis. BrMCs/MG were then purified using a two-step isolation approach, consisting of CD3⁺ T cell depletion followed by CD11b⁺ magnetic bead enrichment to ensure purity and specificity.
Purified myeloid cells were cultured under defined conditions supplemented with M-CSF to maintain viability and functional integrity during prolonged ex vivo culture. This optimized platform provides a reliable, scalable platform for downstream molecular, immunological, and virological analyses of brain-resident HIV reservoirs and related mechanisms in BrMCs/MG.
Introduction
Brain myeloid cells (BrMCs)/microglia are the main innate immune cells in the central nervous system (CNS)1,2,3. In healthy conditions, they constantly monitor the brain and help with tasks such as synaptic pruning, clearing debris, and supporting neurons4,5,6. When disease is present, microglia are immunologically activated, leading to neuroinflammation, which plays an essential role in neurodegeneration in diverse CNS disorders7,8,9. During HIV-1 (HIV) infection, BrMCs/microglia are the main HIV reservoir in the brain, along with CNS T cells and possibly astrocytes; the latter likely plays a minor role in HIV reservoirs in the CNS. Microglia harbor latently infected, integrated proviral HIV DNA but maintain a low-level HIV RNA expression, despite effective antiretroviral therapy (ART)10,11,12. Persistent HIV infection in BrMCs/microglia leads to chronic inflammation and is associated with HIV-associated neurocognitive disorder (HAND) even under modern ART, evidenced by cognitive, behavioral, and motor symptoms in up to 50% of people with HIV (PWH)13,14,15,16. Thus, understanding the function of HIV persistently infected microglia is one of the keys to learning the molecular mechanism of HIV infection and latency, the crosstalk of microglia with astrocytes and other CNS cells, neuronal injury, and the HAND disease process, which is critical to finding treatment targets against neuroHIV11,12,17.
However, there are technical challenges in studying microglia using human postmortem brain tissue. High myelin content, especially in white matter, can trap cells and block filters, which lowers cell recovery unless the myelin is removed before immunomagnetic selection18,19. After PWH death, cell surface markers, such as TMEM119 and P2RY12, can be broken down, thus making it harder to identify microglia accurately20,21. In addition, myeloid cells in HIV-infected brains have peripheral monocytes and tissue-resident macrophages that share some common markers with microglia; therefore, extra steps are needed to enrich the pure population of BrMCs, particularly microglia22,23.
Current approaches for isolating human microglia do not work well for HIV-infected post-mortem tissues. Fluorescence-activated cell sorting gives comprehensive results but needs expensive equipment, takes more time, and produces low cell yield from small amounts of precious human brain tissues24,25. Immunopanning is specific, but it cannot handle samples from many brain regions at once and requires a long incubation time, which is not suitable for post-mortem tissue that requires rapid tissue processing after overnight shipment26,27. Also, none of these methods allows for the recovery of both T lymphocytes and myeloid cells from the same sample, which is needed in order to have a full immune profiling of HIV-infected CNS cells17,28.
This protocol provides a reproducible, reliable, and efficient approach for isolation and enrichment of microglia and other CNS immune cells from HIV-infected postmortem human brain tissues. Controlled mechanical dissociation combined with mild enzymatic digestion (e.g., TrypLE Express and DNase I) can largely preserve surface antigens and minimize cell aggregation29,30. Myelin is removed through Percoll density gradient centrifugation, followed by immunomagnetic separation of CD3⁺ T cells and CD11b⁺ myeloid cells31,32. Importantly, the use of mild enzymatic conditions preserves the key myeloid markers, including CD11b and CD68, as well as microglia-specific biomarkers such as TMEM119 and P2RY12, enabling us to accurately characterize CNS cells and downstream signaling pathway analyses33. The two-step selection approach also generates a highly pure CD3⁺ T cell fraction suitable for virological and immunological studies, which is particularly relevant to NeuroHIV, given the role of T cells in the viral CNS reservoir and HIV-associated neurological injury after T cell infiltration into the brain34,35.
Overall, this two-step sequential approach—initial depletion of CD3⁺ T cells followed by enrichment of CD11b⁺ myeloid cells from the CD3-negative fraction—improves both cell purity and CNS cell yield while maximizing the use of these precious, limited, and valuable tissue samples. The isolated cells are suitable for a wide range of downstream applications, including bulk and single-cell RNA sequencing, flow cytometry, functional assays, and virological analyses, including HIV DNA/RNA quantification and viral outgrowth assays to determine the replication-competent viral reservoirs within CNS resident immune cells17,36,37.
This protocol is compatible with laboratories equipped for postmortem brain tissue processing under BSL-2+ conditions, because many PWH are under ART suppression or with only short-term ART interruption at the end of life. And it only requires standard immunomagnetic separation and flow cytometry platforms to validate the specificity of BrMCs/microglia after isolation. With minor modifications, it can also be adapted to studying CNS diseases such as Alzheimer’s disease, multiple sclerosis, long COVID19, and traumatic brain injury38,39,40. This protocol has also been optimized for isolating brain cells from SIVmac251- or SIVmac239-infected non-human primates (NHPs)12,41, as well as humanized mouse models of HIV infection or latency, providing a physiologically relevant model of HIV infection in the brain. Unlike human brains, these animal models are more readily accessible and offer a valuable complementary resource for mechanistic and translational studies of HIV infection, HIV latency, and associated neuroHIV.
Protocol
NOTE: Handle all human/NHP tissues under BSL-2 conditions. Use appropriate personal protective equipment, including a gown, gloves, a mask, and a face shield, for Percoll treatment, ACK buffer, and DMSO. Dispose of chemical and biological waste according to institutional guidelines. Rinse all the disposable equipment used during tissue dissociation, such as scalpels, pipettes, and Petri dishes, in 10% bleach before discarding them in biohazard bags. Rinse reusable equipment, such as forceps and scissors, with 10% SDS before washing and autoclaving it.
1. Brain tissue collection
- Human samples
NOTE: Human tissues used in this study were obtained under protocols approved by the Institutional Review Board (IRB) of the University of California, San Diego (UCSD; IRB No. 160563)12. The human donors were individuals living with HIV who were receiving antiretroviral therapy (ART). Key donor characteristics, including age, sex, postmortem interval (PMI), and ART status, are briefly summarized here, and these donor characteristics have been carefully described in the previous publication12.- Collect tissues within ≤6 h of death to preserve cell viability and RNA integrity and send them to the processing lab within 24 h.
- NHP samples
NOTE: Rhesus macaques (Macaca mulatta) were housed at the Emory National Primate Research Center (ENPRC, PROTO201700286) or the California National Primate Research Center (CNPRC, UCD IACUC #22832). Animal care and experimental procedures were conducted in accordance with the regulations of the respective Institutional Animal Care and Use Committees (IACUCs) and complied with institutional and federal guidelines. All animal care facilities are accredited by the U.S. Department of Agriculture and the Association for Assessment and Accreditation of Laboratory Animal Care International (AAALAC).- Collect tissues immediately after necropsy12.
- Tissue collection
NOTE: Perform all handling in prechilled weigh boats placed on ice.- Collect 2–20 g per brain region (e.g., frontal, parietal, occipital cortex, hippocampus, basal ganglia), depending on the tissue availability.
- Place tissues in ice-cold DMEM/F12 supplemented with ART: 100 nM Nevirapine, 200 nM Raltegravir, 25 nM Darunavir. Maintain tissues at 4 °C.
- Transport conditions
- Store samples in sealed tubes at 4 °C on ice.
- Have certified personnel transport the tubes under UN3373 Category B regulations12. Ship overnight on ice to the processing laboratory.
2. Tissue preparation
- Transfer tissue to 50 mL tubes. Wash the tissue 10–15x by gently inverting the tubes with 20–40 mL of cold HBSS with DNase(10 U/mL) until the supernatant is clear.
NOTE: This removes blood, debris, and contaminants, so ensure the volume is sufficient for the tissue pieces to move freely during washing. - Remove and discard the meninges and large vessels using sterile forceps.
- Transfer tissue into the new Petri dish and record tissue weight (excluding container) by brain region.
- Tear the tissue into ~1–2 mm fragments with a sterile pair of forceps in ~10 mL of HBSS + DNase I (10 U/mL).
NOTE: Mincing can be done in the Petri dish using a scalpel.
3. Enzymatic digestion
- Prepare the digestion mix by mixing 10 mL of 1x recombinant cell-dissociation enzyme and DNase I (final 10 U/mL).
- Prewarm the rotary shaker to 37 °C and the recombinant cell-dissociation enzyme with DNase I (final 10U/mL) in a 37 °C incubator.
- Transfer the tissue in the digestion mix from step 3.1 to flasks (T150 for volumes > 50 mL; smaller flasks if <50 mL) and incubate in rotatory shakers at: 37 °C, 150 rpm, 30 min.
- Triturate gently using 10 mL, then 5 mL pipettes to pipet up and down.
NOTE: Avoid harsh pipetting. - Incubate for 5 min at room temperature to allow the tissue to settle.
- Cell collection
- Collect the supernatant in a 50 mL tube; this is Collection #1. Add 10% FBS in the collected supernatant to quench the enzyme activity.
- Resuspend the remaining tissue in HBSS + DNase I (10U/mL) + 10% FBS (10 mL/g of tissue). Triturate gently and filter through 70–100 µm strainers.
NOTE: If the enzymatic digestion is adequate, all the tissue will pass through the strainer. - Centrifuge at 500 × g, room temperature, 10 min; this is Collection #2.
NOTE: To maximize recovery, allow the suspension to settle and transfer only the supernatant to a new tube.
- Final processing
- Centrifuge the collections (C1 and C2) at 500 × g for 10 min.
- Discard supernatants. Pool the cell pellets from C1 and C2 into a single tube.
4. Myelin debris removal (Percoll gradient)
- Prepare isotonic Percoll (SIP) by mixing 9 parts of Percoll with 1 part of 10x HBSS. Prepare enough to have ~2.5 mL/g of tissue.
- Prepare 35% Percoll working solution by mixing 3.5 mL of SIP with 5.5 mL of 1x HBSS. Prepare enough to have ~4.5 mL/g of tissue.
- Density separation
- Resuspend the cell pellet obtained from Step 3.7.2 in 35% Percoll. Use approximately 4.5ml of 35% Percoll per gram of the original tissue weight (i.e., tissue weight measured before dissociation)
- NOTE: Resuspend the cells with 35% Percoll in a 50 mL tube (maximum 30 mL per tube). If tissues are large, divide the cells into multiple 50 mL tubes.
- Carefully overlay each tube with 10 mL of 1x HBSS. Incubate for 5 min on ice or at 4 °C.
- Centrifuge at 800 × g, 45 min, 4 °C (no brake during deceleration).
- Layer recovery
- Carefully discard the supernatant and myelin layer without disturbing the lower interphase.
- Collect the pellet and interphase (below the myelin layer containing mixed brain cells and the Percoll fraction) into a new 50 mL conical tube to avoid debris carryover.
- Diluting and washing
- Add HBSS at a 3:1 ratio (e.g., 30 mL of HBSS per 10 mL of collected suspension) to dilute Percoll (~3x dilution).
- Centrifuge at 1,000 × g, 10 min at 4 °C (use full brake and acceleration).
- Remove the supernatant completely.
- RBC lysis and cell counting
- Treat the cell plate from Step 4.5.3 with ACK buffer (5 mL, 10 min, 37 °C).
- Count the viable cells by using Trypan blue.
- NOTE: Expected yield: ~0.1–1 × 10⁶ CNS cells/g of tissue, depending on the condition of the tissues.
- Add 10 mL of PBS to inactivate the ACK lysis buffer. Centrifuge for 500 × g for 5 min.
NOTE: Optional stop: Cells may be cultured overnight prior to sorting at a density of 0.5–1 × 10⁶ cells/mL of medium (DMEM/F-12, glutamine supplement with sodium Pyruvate (500 mL), 10% heat-inactivated FBS, 1x HEPES buffer solution, 1x Antibiotic-Antimycotic (5.5 mL of 100x stock), 10 ng/mL MCSF (1,000x stock).
Following completion of the tissue dissociation, RBC lysis, cell counting, and optional overnight culture steps described above, CD3+ and CD11b+ cells populations were isolated using commercially available cell-isolation kits according to the manufacturer’s instructions. Detailed information regarding the kits, reagents, and complete isolation procedure is provided in the Table of Materials, with a brief overview of the isolation workflow provided below.
5. CD3⁺ T cell isolation (positive selection)
NOTE: Isolate CD3+ from the prepared single-cell suspension first, using a release-format immunomagnetic positive-selection kit for CD3 (see the Table of Materials). Retain both the CD3+ and CD3- fractions produced by this section. The CD3- fraction is required for Step 6.
- Prepare the release buffer.
- Prepare 1x release buffer by diluting the 40x release buffer concentrate in cell separation buffer on the day of use and keep it in 4–6 °C or on ice.
NOTE: Prepare 2.5 mL of 1x release buffer for each sample to be processed.
- Prepare 1x release buffer by diluting the 40x release buffer concentrate in cell separation buffer on the day of use and keep it in 4–6 °C or on ice.
- Prepare the cell sample and label with the selection cocktail.
- Resuspend the cell pellet from step 4.6.3 at 1 × 10⁸ cells/mL in cell separation buffer in a 5 mL round-bottom polystyrene tube.
- Add the CD3 selection cocktail to the sample at 100 µL per mL of sample. Mix the sample gently and incubate for 3 min at room temperature.
- Label the sample with magnetic particles.
- Vortex the magnetic particles for 30 s immediately before use. Add the magnetic particles to the sample at 100 µL per mL per sample. Mix the sample gently and incubate for 3 min at room temperature.
- Bring the sample to a total volume of 2 mL with cell separation buffer and mix by gently pipetting the suspension up and down two or three times.
- Isolate the CD3+ reaction by magnetic separation.
- Place the uncapped sample tube into the magnetic cell separator and incubate for 5 min at room temperature.
- NOTE: Cells bound to the magnetic particles constitute the CD3+ fraction and remain attached to the tube wall inside the magnetic field; the unbound supernatant constitutes the CD3- fraction.
- Without removing the tube from the magnetic separator, pipette the supernatant into a clean, labeled 15 mL conical tube designated for the CD3- fraction.
- Remove the tube from the magnetic separator and resuspend the retained cells gently in 2 mL of cell separator buffer.
- Repeat steps 5.4.1 through 5.4.3 for a total of three 5 min magnetic separations, pooling all the supernatants into the same CD3- fraction tube.
- Release CD3+ fraction from the magnetic particles.
- Add 2.5 mL of 1x release buffer (prepared in step 5.1.2) to retained cells and mix by gently pipetting the suspension up and down two to three times. Incubate the suspension for 3 min at room temperature.
- Place the uncapped tube into the magnetic cell separator and incubate for 5 min at room temperature.
- Without removing the tube from the magnetic separator, pipette the supernatant into a clean, labeled 15 mL conical tube designated for the CD3+ fraction.
NOTE: The release buffer disengages the magnetic particles from the labeled cells: the resulting supernatant is the purified CD3+ fraction, while the residual magnetic particles remain bound to the tube wall in the magnetic field and are discarded.
- Cell count and cryopreservation
- Count the cells and store the CD3+ aliquot by snap-freezing aliquots in -80 °C after cryopreserving the remaining cells in a cryo-mixture (90% FBS + 10% DMSO) for 24 h in an isopropanol-based freezing medium and then transfer the sample into liquid nitrogen.
6. CD11b⁺ Myeloid cell isolation (from CD3⁻ fraction)
NOTE: The CD3- fraction retained from step 5.4.4 was processed through a second immunomagnetic positive selection step to isolate CD11b+ myeloid cells using anti-CD11b magnetic microbead and a column-format magnetic separator (see the Table of Materials).
- Prepare the separation buffer and determine cell number.
- Prepare the 1x BSA-based separation buffer by diluting the 20x concentration in isotonic rinsing solution and keep the prepared buffer cold (4–8 °C) until use.
- Determine the total number of cells in the CD3 fraction using a hemocytometer or automated cell counter.
- Label cells with anti-CD11b magnetic microbeads.
- Centrifuge the cell suspension at 300 × g for 10 min and aspirate the supernatant completely.
- Resuspend the cell pellet in 80 µL of 1x BSA-based separation buffer per 1 × 10⁷ total cells.
- Add 20 µL of anti-CD11b magnetic microbeads per 1 × 10⁷ total cells, mix well, and incubate for 15 min at 4–8 °C.
- NOTE: Incubating on wet ice rather than a refrigerator may require a longer incubation time. Incubating at higher temperatures or for longer than the recommended time may increase the risk of non-specific cell labeling
- Wash the labeled cells by adding 1 mL of 1x separation buffer per 1 × 10⁷ cells, centrifuge at 300 × g for 10 min, and aspirate the supernatant completely.
- Resuspend up to 1 × 10⁸ total cells in 500 µL of separation buffer.
- Perform column-based magnetic separation.
- Place a magnetic separation column into the magnetic separator and equilibrate it by rinsing with 500 µL of 1x separation buffer for a small-volume column or 1 mL of 1x separation buffer for a large-volume column; discard the rinse effluent.
NOTE: Use a small-volume column when the sample contains few total cells. US a large-volume column for samples containing large total cell numbers, such as spleen-derived or combined immune preparations. - Place a clean 5 mL round-bottom polystyrene tube beneath the equilibrated column and apply the 500 µL (small-volume column) or 1 mL (large-volume column) labeled cell suspension to the top of the column.
- After the sample has fully entered the column, wash the column three times, adding 500 µL of 1x separation buffer per wash for the small-volume or 1 mL per wash for a large-volume column. Add each subsequent wash only once the column reservoir has emptied.
NOTE: The combined effluent collected in steps 6.3.2 and 6.3.3 constitutes the unlabeled, CD11b- fraction. - Remove the column from the magnetic separator and place it onto a clean, labeled 5 mL polystyrene tube designated for the CD11b+ fraction.
- Pipette 1 mL (small-volume column) or 2 mL (large-volume column) of 1x separation buffer onto the top of the column and immediately flush the labeled cells into the collection tube by firmly depressing the plunger supplied with the column.
- Place a magnetic separation column into the magnetic separator and equilibrate it by rinsing with 500 µL of 1x separation buffer for a small-volume column or 1 mL of 1x separation buffer for a large-volume column; discard the rinse effluent.
- Quantification and downstream processing of the CD11b+ fractions
- Count cells from both the fractions (CD11b+ and CD11b-) and store the CD11b- aliquot by snap-freezing at -80 °C after cryopreserving the remaining cells in a cryo-mixture (90% FBS + 10% DMSO) for 24 h in an isopropanol-based freezing medium and then transfer the sample into liquid nitrogen.
- Use CD11b+ cells for downstream experiments.
Results
The optimized workflow described in this protocol enables the reproducible isolation of viable, highly enriched T cells and BrMCs/microglia from post-mortem HIV-infected human brain tissues. Successful execution of the protocol is confirmed through a series of quality checkpoints, including cell viability assessment, yield quantification, and immunophenotypic characterization at key stages. Representative outcomes from a successful experiment are described below.
Tissue dissociation and cell recovery
As outlined in Figure 1A, following mechanical dissociation and density gradient centrifugation, a well-processed sample should yield a visually clear pellet with minimal residual myelin debris after Percoll centrifugation. In representative experiments using rapid autopsy brain tissues from PWH, total cell yields before immunomagnetic selection typically range from 8.0 × 10⁴ to 1.0 × 10⁶ cells per gram of brain tissues, which is substantially lower than yields from spleen tissues (~5 × 10⁷ cells/g) (Table 1), reflecting inherent biological differences between these tissues.
Lower yields or reduced viability are often associated with prolonged postmortem intervals (>24 h), suboptimal tissue storage conditions, or excessive mechanical force during homogenization. In such cases, the myelin layer following Percoll centrifugation appears thicker and more diffuse, and the interphase containing CNS cells is less clearly defined. Incomplete removal of the myelin layer (protocol step 4.4) may lead to contamination with myelin debris, which may be misidentified as dead cells during trypan blue exclusion counting. This contamination can also impair downstream antibody labeling, thereby compromising the efficiency of magnetic separation. If myelin carryover is suspected, an additional Percoll gradient centrifugation step is recommended before immunomagnetic selection.
CD3+ T fraction
The CD3⁺ T cell positive selection step serves a dual purpose: enriching the T cell fraction for parallel CNS cell analyses while depleting infiltrating T lymphocytes from the myeloid-enriched fraction to exclude potential T cell contamination in isolated myeloid cells. In representative experiments, the CD3⁺ fraction accounted for approximately 2–8% of total isolated cells (approximately 1 × 10⁴ cells/g of tissue) (Table 1), consistent with prior reports indicating limited and low levels of T cell infiltration in HIV-infected CNS tissues.
CD11b⁺ BrMC enrichment, characterization, and ex vivo culture
Following CD3⁺ depletion, the CD3⁻ fraction was subjected to CD11b⁺ selection using magnetic microbeads. As reported previously(12), this procedure enabled us to enrich CD11b⁺ BrMCs to 95.2%, compared to 28.4% in the pre-selection fraction. Highly sensitive RT-qPCR for the T cell marker CD3E (capable of detecting one T cell in one million BrMCs) showed no detectable T cells in the isolated BrMCs/microglia(12), confirming its high purity and ruling out any contamination of T cells.
Purified CD11b⁺ BrMCs were then cultured in microglial cell medium for up to 2 weeks to allow cell recovery and attachment to initiate cell growth. As shown in Figure 1B, isolated human BrMCs formed a monolayer as early as day 5 post-isolation and exhibited bipolar morphology. These cells are now ready for ex vivo measurements, characterization, and downstream functional assays. Representative flow cytometry–based purity analysis of the CD11b⁺ fraction isolated from NHP brain is shown in Figure 2A, demonstrating that 97.3% of the cells co-expressed CD11b and TMEM119. The purity of both human and other NHP BrMC preparations has been described previously12. In those analyses, the CD11b⁺ fraction was enriched from 28.4% to 95.5%, with TMEM119⁺ cells comprising up to 95.9% of the isolated population from human samples. We refer to these cells as microglia, although a small proportion may represent other brain-resident myeloid cell populations.
A similar procedure can also be applied to isolate spleen CD3⁺ T cells and CD11b⁺ myeloid cells (SMCs) (Table 1). Purity assessment demonstrated ~98.9% of CD3+ cells and 99.3% of CD11b+ cells (Figure 2B,C). These viable cell populations (Figure 2E,F) could be maintained in culture, enabling paired comparative analyses with isolated CNS cells (Figure 2D).
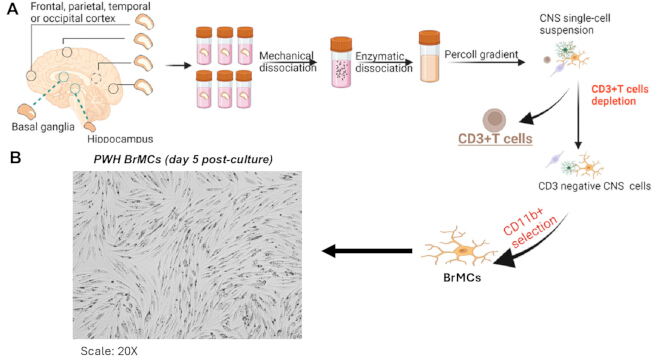
Figure 1. A two-step sequential isolation procedure to purify BrMCs. (A) Schematic of the two-step CNS cell isolation procedure to purify CD11b⁺ BrMCs. (B) The morphology of BrMCs (100x magnification) after 5 days in culture shows successful attachment of MG to the dish. Abbreviations: BrMCs = brain myeloid cells; CNS = central nervous system; MG = microglia. Please click here to view a larger version of this figure.
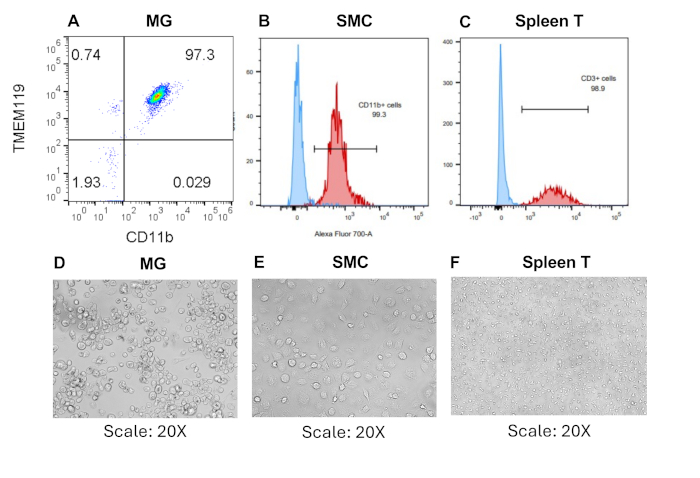
Figure 2. Successful isolation of spleen T and myeloid cells. (A-C) Flow cytometry analysis of CD3⁺ and CD11b⁺ fractions using the indicated antibodies. (D-F) Representative images (bottom) show microglia, CD3⁺ T cells, and splenic myeloid cells 7 days after culture following isolation from the brain and spleen (Scale: 20x). Abbreviations: SMCs = spleen myeloid cells; MG = microglia. Please click here to view a larger version of this figure.
| Region | Tissue weight (g) | Pre-isolation | CD3+ T cells | CD11b+ BrMCs/SMC | |||
| PWH | live cells | cells/g tissue | live cells | cells/g tissue | live cells | cells/g tissue | |
| FCP | 18.25 | 8.82E+06 | 4.83E+05 | 7.30E+05 | 1.33E+04 | 2.82E+06 | 1.55E+05 |
| PCT | 4.1 | 3.53E+05 | 8.61E+04 | 1.20E+05 | 2.93E+04 | ||
| TCX | 16 | 4.15E+06 | 2.59E+05 | 2.79E+06 | 1.74E+05 | ||
| OCC | 4.24 | 1.75E+06 | 4.13E+05 | 4.50E+05 | 1.06E+05 | ||
| CRB | 11.4 | 4.15E+06 | 3.64E+05 | 2.64E+06 | 2.32E+05 | ||
| H | 1 | 1.23E+06 | 1.23E+06 | 6.00E+04 | 6.00E+04 | ||
| SPL | 5.25 | 2.82E+08 | 5.37E+07 | 2.98E+07 | 5.68E+06 | 9.60E+06 | 1.83E+06 |
Table 1: The yield of each cell type following the two-step isolation of CNS cells.
Discussion
To collect reproducible data with this protocol, it is important to follow each step carefully. Missing or rushing any part can lower cell yield, viability, and purity. The most critical factor before analysis is how quickly tissues are processed after death42. Human brain tissue should be handled as soon as possible, ideally within 6–12 h. Waiting longer causes microglia surface antigens such as TMEM119 and P2RY12 to break down and reduces cell viability20. To avoid this, it is critical to ensure that tissues are promptly transferred and immediately stored at 4 °C in HBSS with DNase I.
Mechanical dissociation must be adjusted carefully43. Over-homogenizing breaks cells and releases DNA, which causes clumping and lowers both yield and column efficiency44. If tissues are not homogenized sufficiently, live cells will remain trapped within tissue fragments. Adding DNase I to the dissociation medium helps prevent clumping45. Using three to four grinding cycles with rinses in between usually works well. For the Percoll density gradient centrifugation, it is important to follow the centrifuge settings exactly and not use the brake, as this will mix the layers and ruin the separation of the cells45. When adding HBSS to the Percoll suspension, HBSS should be poured slowly along the tube wall to keep the layers separate. If experimenters are new to this, it is advisable to practice with colored solutions before using valuable tissue. During CD11b+ magnetic column separation, cells and all buffers should be kept at 4–8 °C. If the temperature rises above this during microbead incubation, it can cause nonspecific labeling, antibody capping, and bead uptake, all of which will significantly reduce purity and selection efficiency33.
This protocol can be adjusted to fit different tissue types or lab setups. If the tissue contains many red blood cells, such as when cardiac perfusion is incomplete, an ACK lysis step can be added before Percoll gradient centrifugation to remove them and improve separation46. ACK incubation should not be carried out for long periods, as this can compromise leukocyte viability47. If yields remain low, the debris left on the strainer should be checked under a dissecting microscope. If there is a lot of viable tissue, the number of grinding cycles can be increased, or tissue pieces can be cut smaller than 0.5 g per strainer. When recovering from the Percoll gradient, it is ideal to leave a small amount of Percoll above the pellet rather than risk losing the interphase. If the column clogs during MACS separation, it usually indicates that too many cells were loaded or that debris remains in the suspension.
While this protocol is designed for HIV-infected human brain tissues, there are some important limitations to consider when interpreting results. Mechanical dissociation always induces cellular stress, which could temporarily alter microglial gene expression and activate inflammatory pathways33,48. Another limitation is the use of CD11b as the primary selection marker. CD11b is found on many CNS myeloid cells, not just microglia, and is also present on infiltrating monocytes and macrophages, which are more common in HIV-infected tissue due to neuroinflammation49. To distinguish resident microglia from infiltrating cells, further analysis using microglia-specific markers such as TMEM119, P2RY12, and SALL1 is needed20,50. A third limitation is the tissue availability and donor differences. Postmortem human brain samples cannot be replaced, making it extremely challenging to optimize the protocol using technical replicates from the same donor. There are also variations between tissues in yield, viability, and microglia activation, especially in PWH, where neurocognitive status, ART history, and other health issues vary widely. These differences must be carefully recorded and controlled in experiments.
Compared with other methods, FACS-based isolation using antibodies against CD11b, CD45, TMEM119, or P2RY12 achieves high purity but requires expensive equipment, is time-consuming, and increases cellular stress33,51. It also results in lower cell recovery than magnetic bead-based methods52. Immunopanning is very specific but time-consuming too, requires specialized substrate preparation, and does not scale well for processing tissue from multiple regions53. Commercial enzymatic dissociation kits can improve single cell yield and reduce mechanical stress, but they are more expensive and may alter cell surface markers via protease activity, thereby reducing labeling efficiency for subsequent immunomagnetic or flow cytometry steps54,55. Thus, this protocol includes mild enzymatic digestion during the main dissociation step to preserve surface antigens, which is especially important for sensitive markers such as CD11b, CD68, and TMEM119. The stepwise immunomagnetic depletion-enrichment approach used here, with CD3+ T cell depletion followed by CD11b+ positive selection, offers a real workflow advantage over single-step protocols. It enables T cell recovery for parallel immunological studies while maximizing myeloid fraction purity. This dual recovery is especially useful in HIV reservoir research, where both T cells and myeloid cells in the CNS are important to study.
The isolated CD11b+ cells can be used for a variety of research applications. For studying viral reservoirs, this fraction is suitable for measuring HIV p24 antigen, HIV DNA/RNA copy number by droplet digital PCR, and ex vivo viral outgrowth assays56,57. All of these require viable, enriched myeloid cells and are important for understanding the CNS reservoir that persists despite ART58. For transcriptomic studies, cells prepared with this protocol are suitable for both bulk and single-cell RNA sequencing59,60. This enables researchers to study microglia activation, disease-related microglia signatures, and microglia responses to HIV infection at the single-cell level61. With small changes, such as using different selection kits and adjusting gradient volumes, this workflow can be applied to other neurological diseases, including Alzheimer's, multiple sclerosis, long COVID19, and traumatic brain injury, for which microglial analysis of post-mortem tissue is also needed49,62.
In summary, this protocol provides a reliable, scalable, flexible, and reproducible method for isolating myeloid cells/microglia from human and animal brain tissues. Since it works with many downstream platforms and enables recovery of multiple immune cell types from a single tissue sample, it is a valuable tool for researchers in neuroimmunology, virology, and neuropathology.
Disclosures
The authors have no conflicts of interest to declare.
Acknowledgements
We thank Dr. Sara Gianella from the “Last Gift” cohort at UC San Diego for collecting human tissues. We also thank Dr. Ann Chahroudi at the Emory National Primate Research Center, Dr. Afam Okoye at Oregon Health & Science University, and Dr. Satya Dandekar at the University of California, Davis, for providing rhesus macaque tissues. This work was supported by R21MH128034, R01MH136852, R21AI167709, R01MH139446, and R01AI186609. The funders had no role in study design, data collection and analysis, decision to publish, or preparation of the manuscript.
Materials
| Name | Company | Catalog Number | Comments |
|---|---|---|---|
| 10 mL syringes | VWR | Cat# 76837-040 | |
| 25 mL serological pipettes | VWR | Cat# 76201-710 | |
| ACK lysis buffer | Thermo Fisher Scientific | Cat# A1049201 | |
| Antibiotic-Antimycotic (100x) | Thermo Fisher Scientific | Cat# 15240112 | |
| autoMACS Rinsing Solution | Miltenyi Biotec | Cat# 130-091-222 | |
| Biosafety cabinet (BSL-2) | |||
| CD11b MicroBeads, human and mouse – lyophilized | Miltenyi Biotec | Cat# 130-097-142 | |
| CD11b MicroBeads, non-human primate | Miltenyi Biotec | Cat# 130-091-100 | |
| CD3 MicroBead Kit, non-human primate | Miltenyi Biotec | Cat# 130-092-012 | |
| Cell counting slides | Thermo Fisher Countess | Cat# C10312 | Alternative VWR, Cat# 10228-0050 |
| Clorox germicidal bleach | Essendant | Cat# 50371500 | |
| Corning Untreated Culture Dishes | Thermo Fisher Scientific | Cat# 08-772-32 | |
| Cynomolgus Monkey M-CSF | Kingfisher Biotech | Cat# RP1612Y-100 | |
| Disposable syringes with Luer-Lok tips | BD | Cat# 14-829-45 | |
| DMEM/F-12 | Thermo Fisher Scientific | Cat# 11320082 | |
| DNase I, recombinant, RNase-free | Roche | Cat# 4716728001 | |
| EasySep Buffer | STEMCELL Technologies | Cat# 20144 | |
| EasySep FITC Positive Selection Kit II | STEMCELL Technologies | Cat# 17682 | |
| EasySep Release Human CD3 Positive Selection Kit | STEMCELL Technologies | Cat# 17751 | |
| Falcon Cell Strainers, 70 µm and 100 µm | Corning | Cat# 21008-950 | |
| Fetal bovine serum (FBS) | VWR | Cat#97068-091 | |
| Fine curved forceps | VWR | Cat# 82027-410 | |
| Gentamicin | Thermo Fisher Scientific | Cat# 15750060 | |
| Gibco RPMI 1640 | Thermo Fisher Scientific | Cat# 11875-119 | |
| HBSS, 1x without calcium, magnesium, and phenol red | Thermo Fisher Scientific | Cat# 14175103 | |
| HBSS, 10x with calcium, magnesium, phenol red | Thermo Fisher Scientific | Cat# 14060040 | |
| Hemocytometer or automated cell counter | |||
| Human M-CSF | PeproTech | Cat# 300-25 | alternative Cat# 78057 |
| Isotonic rinsing/dilution solution for magnetic separation | Miltenyi Biotec | 130-091-222 | |
| L-Glutamine (200 mM) | Thermo Fisher Scientific | Cat# 25030-061 | |
| MACS BSA Stock Solution(20x) | Miltenyi Biotec | Cat# 130-091-376 | |
| Magnetic separation system | EasySep or MACS | ||
| MS Columns | Miltenyi Biotec | Cat# 130-042-201 | |
| Penicillin-Streptomycin | hermo Fisher Scientific | Cat# 15140122 | |
| Percoll | Cytiva/GE Healthcare, | Cat# GE17-0891-01 | |
| Protective gowns | Kappler ProVent | Cat# 17-988-497B | |
| Refrigerated centrifuge | |||
| Sodium Pyruvate (100 mM) | Thermo Fisher Scientific | Cat# 11360070 | |
| Specimen forceps | VWR | Cat# 82027-440 | Alternative Cat# 82027-438 |
| Sterile disposable scalpels | Cardinal Health | Cat# 11213-237 | VWR-alternative Cat# 89140-800 |
| TrypLE Express Enzyme (1x), phenol red | ThermoFisher | Cat# 1250510 |
References
- Prinz M, Masuda T, Wheeler MA, Quintana FJ. Microglia and central nervous system-associated macrophages: from origin to disease modulation. Annu Rev Immunol. 2021;39:251-77.
- Labzin LI, Heneka MT, Latz E. Innate immunity and neurodegeneration. Annu Rev Med. 2018;69:437-49.
- Thompson KK, Tsirka SE. The diverse roles of microglia in the neurodegenerative aspects of central nervous system (CNS) autoimmunity. Int J Mol Sci. 2017;18(3):504.
- Cornell J, Salinas S, Huang HY, Zhou M. Microglia regulation of synaptic plasticity and learning and memory. Neural Regen Res. 2022;17(4):705-16.
- Konishi H, Kiyama H, Ueno M. Dual functions of microglia in the formation and refinement of neural circuits during development. Int J Dev Neurosci. 2019;77:18-25.
- Fujita Y, Yamashita T. Neuroprotective function of microglia in the developing brain. Neuronal Signal. 2021;5(1):NS20200024.
- Gao C, Jiang J, Tan Y, Chen S. Microglia in neurodegenerative diseases: mechanism and potential therapeutic targets. Signal Transduct Target Ther. 2023;8(1):359.
- Leng F, Edison P. Neuroinflammation and microglial activation in Alzheimer disease: where do we go from here? Nat Rev Neurol. 2021;17(3):157-72.
- Hickman S, et al. Microglia in neurodegeneration. Nat Neurosci. 2018;21(10):1359-69.
- Donoso M, et al. Identification, quantification, and characterization of HIV-1 reservoirs in the human brain. Cells. 2022;11(15):2379.
- Asahchop EL, et al. Reduced antiretroviral drug efficacy and concentration in HIV-infected microglia contributes to viral persistence in brain. Retrovirology. 2017;14(1):47.
- Tang Y, et al. Brain microglia serve as a persistent HIV reservoir despite durable antiretroviral therapy. J Clin Invest. 2023;133(12):e167417.
- Thompson LJP, et al. HIV-associated neurocognitive disorder: a look into cellular and molecular pathology. Int J Mol Sci. 2024;25(9):4697.
- Olivier IS, Cacabelos R, Naidoo V. Risk factors and pathogenesis of HIV-associated neurocognitive disorder: the role of host genetics. Int J Mol Sci. 2018;19(11):3594.
- Eggers C, et al. HIV-1-associated neurocognitive disorder: epidemiology, pathogenesis, diagnosis, and treatment. J Neurol. 2017;264(8):1715-27.
- Prates GS, et al. HIV expression persists in the cerebrospinal fluid of HIV-associated neurocognitive disorders despite effective ART. Emerg Microbes Infect. 2026;15(1):2616945.
- Ash MK, Al-Harthi L, Schneider JR. HIV in the brain: identifying viral reservoirs and addressing the challenges of an HIV cure. Vaccines (Basel). 2021;9(8):867.
- Andersen ND, Srinivas S, Piñero G, Monje PV. A rapid and versatile method for the isolation, purification and cryogenic storage of Schwann cells from adult rodent nerves. Sci Rep. 2016;6(1):31781.
- Flores-Obando RE, Freidin MM, Abrams CK. Rapid and specific immunomagnetic isolation of mouse primary oligodendrocytes. J Vis Exp. 2018;(135):e57543.
- Van Wageningen TA, et al. Regulation of microglial TMEM119 and P2RY12 immunoreactivity in multiple sclerosis white and grey matter lesions is dependent on their inflammatory environment. Acta Neuropathol Commun. 2019;7(1):206.
- Honarpisheh P, et al. Potential caveats of putative microglia-specific markers for assessment of age-related cerebrovascular neuroinflammation. J Neuroinflammation. 2020;17(1):366.
- Rai MA, et al. Comparative analysis of human microglial models for studies of HIV replication and pathogenesis. Retrovirology. 2020;17(1):35.
- Gumbs SB, et al. Human microglial models to study HIV infection and neuropathogenesis: a literature overview and comparative analyses. J Neurovirol. 2022;28(1):64-91.
- Ma Z, Zhou Y, Collins DJ, Ai Y. Fluorescence activated cell sorting via a focused traveling surface acoustic beam. Lab Chip. 2017;17(18):3176-85.
- Sutermaster BA, Darling EM. Considerations for high-yield, high-throughput cell enrichment: fluorescence versus magnetic sorting. Sci Rep. 2019;9(1):227.
- Simon M, et al. Loss of perivascular aquaporin-4 localization impairs glymphatic exchange and promotes amyloid β plaque formation in mice. Alzheimers Res Ther. 2022;14(1):59.
- Olah M, et al. A transcriptomic atlas of aged human microglia. Nat Commun. 2018;9(1):539.
- Nühn MM, et al. Shock and kill within the CNS: a promising HIV eradication approach? J Leukoc Biol. 2022;112(5):1297-315.
- Donlin LT, et al. Methods for high-dimensional analysis of cells dissociated from cryopreserved synovial tissue. Arthritis Res Ther. 2018;20(1):139.
- Montanari M, et al. Automated-mechanical procedure compared to gentle enzymatic tissue dissociation in cell function studies. Biomolecules. 2022;12(5):701.
- Galatro TF, et al. Isolation of microglia and immune infiltrates from mouse and primate central nervous system. In: Clausen BE, Laman JD, editors. Inflammation: Methods and Protocols. New York: Humana Press; 2017. p. 333-42.
- Grabert K, McColl BW. Isolation and phenotyping of adult mouse microglial cells. In: Rousselet G, editor. Macrophages: Methods and Protocols. New York: Humana Press; 2018. p. 77-86.
- Ocañas SR, et al. Minimizing the ex vivo confounds of cell-isolation techniques on transcriptomic and translatomic profiles of purified microglia. eNeuro. 2022;9(2):ENEURO.0348-21.2022.
- Subra C, Trautmann L. Role of T lymphocytes in HIV neuropathogenesis. Curr HIV/AIDS Rep. 2019;16(3):236-43.
- Farhadian SF, et al. HIV viral transcription and immune perturbations in the CNS of people with HIV despite ART. JCI Insight. 2022;7(13):e160267.
- Marsh SE, et al. Dissection of artifactual and confounding glial signatures by single-cell sequencing of mouse and human brain. Nat Neurosci. 2022;25(3):306-16.
- Jolly S, et al. Single-cell quantification of mRNA expression in the human brain. Sci Rep. 2019;9(1):12353.
- Schroeter CB, et al. One brain-all cells: a comprehensive protocol to isolate all principal CNS-resident cell types from brain and spinal cord of adult healthy and EAE mice. Cells. 2021;10(3):651.
- Swartzlander DB, et al. Concurrent cell type-specific isolation and profiling of mouse brains in inflammation and Alzheimer's disease. JCI Insight. 2018;3(13):e121109.
- Zhao J, et al. Single-cell RNA sequencing reveals the heterogeneity of liver-resident immune cells in human. Cell Discov. 2020;6(1):22.
- Li X, et al. Histone decrotonylation plays a distinct role in HIV latency. Sci Adv. 2026;12(15):eaec0149.
- Heng Y, et al. The effects of postmortem delay on mouse and human microglia gene expression. Glia. 2021;69(4):1053-60.
- Trujillo M, et al. Combined mechanical and enzymatic dissociation of mouse brain hippocampal tissue. J Vis Exp. 2021;(176):e63007.
- Herron S, Delpech JC, Madore C, Ikezu T. Using mechanical homogenization to isolate microglia from mouse brain tissue to preserve transcriptomic integrity. STAR Protoc. 2022;3(4):101670.
- STEMCELL Technologies. How to prepare a single cell suspension from a frozen cell sample. protocols.io. 2019. doi:10.17504/protocols.io.4umgwu6.
- Volovitz I, et al. A non-aggressive, highly efficient, enzymatic method for dissociation of human brain tumors and brain tissues to viable single cells. BMC Neurosci. 2016;17(1):30.
- Manglani M, Gossa S, McGavern DB. Leukocyte isolation from brain, spinal cord, and meninges for flow cytometric analysis. Curr Protoc Immunol. 2018;121(1):e44.
- Bakina O, et al. In situ Patch-seq analysis of microglia reveals a lack of stress genes as found in FACS-isolated microglia. PLoS One. 2024;19(7):e0302376.
- Narasipura SD, et al. Inflammatory responses revealed through HIV infection of microglia-containing cerebral organoids. J Neuroinflammation. 2025;22(1):36.
- Haage V, et al. Comprehensive gene expression meta-analysis identifies signature genes that distinguish microglia from peripheral monocytes/macrophages in health and glioma. Acta Neuropathol Commun. 2019;7(1):20.
- Pan J, Wan J. Methodological comparison of FACS and MACS isolation of enriched microglia and astrocytes from mouse brain. J Immunol Methods. 2020;486:112834.
- Bordt EA, et al. Isolation of microglia from mouse or human tissue. STAR Protoc. 2020;1(1):100035.
- Bohlen CJ, Bennett FC, Bennett ML. Isolation and culture of microglia. Curr Protoc Immunol. 2019;125(1):e70.
- MacMullan MA, et al. An enzyme-free, cold-process acoustic method for gentle and effective tissue dissociation. bioRxiv. 2023:2023.10.03.560704. doi:10.1101/2023.10.03.560704.
- Mattei D, et al. Enzymatic dissociation induces transcriptional and proteotype bias in brain cell populations. Int J Mol Sci. 2020;21(21):7944.
- Kuzmichev YV, et al. Application of ultrasensitive digital ELISA for p24 enables improved evaluation of HIV-1 reservoir diversity and growth kinetics in viral outgrowth assays. Sci Rep. 2023;13(1):10958.
- Ferreira EA, Clements JE, Veenhuis RT. HIV-1 myeloid reservoirs: contributors to viral persistence and pathogenesis. Curr HIV/AIDS Rep. 2024;21(2):62-74.
- León-Rivera R, et al. Central nervous system viral seeding by mature monocytes and potential therapies to reduce CNS viral reservoirs in the cART era. mBio. 2021;12(2):e03633-20.
- Alyaqoobi Z, He Y, Wang X. Single-cell and bulk transcriptome analysis reveals the impact of inflammatory microglia on prognosis and immunotherapy response in primary glioblastoma. Clin Transl Oncol. 2026;28(6):2314-34.
- Farhadian SF, et al. Single-cell RNA sequencing reveals microglia-like cells in cerebrospinal fluid during virologically suppressed HIV. JCI Insight. 2018;3(18):e121718.
- Spurgat MS, Tang SJ. Single-cell RNA-sequencing: astrocyte and microglial heterogeneity in health and disease. Cells. 2022;11(13):2021.
- Marsh SE, et al. Multi-modal analysis and modeling of human neurodegenerative disease to reveal disease mechanisms and biomarkers. Alzheimers Dement. 2022;18:e061905.