This study identified the core targets and pathways of shikonin against RCC via multimethod analysis and in vitro validation, providing a framework for further mechanistic studies.
Research Article
Screening the Mechanism of Shikonin Against Renal Cell Carcinoma via Network Pharmacology, Molecular Docking, and Cellular Experimental Verification
Opens in a new tab
In This Article
Summary
Loading...
$$\rightleftharpoonup{xx}$$
$$\longleftharp{xx}$$,
$$\longrightharp{xx}$$,
Abstract
Loading...
$$\rightleftharpoonup{xx}$$
$$\longleftharp{xx}$$,
$$\longrightharp{xx}$$,
Renal cell carcinoma (RCC) is one of the most common tumors in the urinary system and has the highest mortality rate. Previous investigations have demonstrated that shikonin can treat renal cell carcinoma, but the mechanism remains unclear. Therefore, our study aimed to elucidate the mechanism of shikonin in the treatment of renal cell carcinoma using network pharmacology, molecular docking, and in vitro functional assays, including cell proliferation, migration, and apoptosis, with western blot (WB) validation. Shikonin targets were screened using PharmMapper, SwissTargetPrediction, and other databases, and identified RCC-related targets from Online Mendelian Inheritance in Man (OMIM), GeneCards, and other databases; the potential therapeutic targets were obtained by intersection analysis. A protein-protein interaction (PPI) network was constructed, and Cytoscape was used to screen core targets, while molecular docking was applied to analyze the binding affinity between shikonin and key targets. A total of 374 shikonin targets and 1,087 RCC-related targets were collected, and 98 overlapping target genes were identified. Six core targets (SRC, PIK3CA, PIK3CB, PIK3CD, PTPN11, and PIK3R1) were identified. Gene Ontology (GO) and Kyoto Encyclopedia of Genes and Genomes (KEGG) analyses showed that shikonin exerted anti-RCC effects mainly by regulating protein kinase activity, HIF-1, and IL-17 signaling pathways. Molecular docking confirmed that shikonin had a strong binding affinity with these core targets. In vitro studies using human RCC Caki‑1 and 786‑O cells demonstrated that shikonin significantly inhibited cell proliferation and migration in a dose‑dependent manner, promoted cell apoptosis, and upregulated caspase‑3 and caspase‑8 activities. Western blot experiments further verified that shikonin modulated the expression of core target proteins and suppressed the HIF-1 signaling pathway. This study systematically elucidates the pharmacological mechanism of shikonin against renal cell carcinoma, providing a theoretical basis for the development and application of shikonin as a novel anti-RCC agent.
Introduction
Loading...
$$\rightleftharpoonup{xx}$$
$$\longleftharp{xx}$$,
$$\longrightharp{xx}$$,
Renal cell carcinoma (RCC) is the most common malignant tumor of the urinary system, accounting for approximately 90% of all renal malignant tumors and 2%–3% of adult malignant tumors worldwide. According to the GLOBOCAN 2022 data, there were about 434,800 new cases and 155,953 deaths of renal cell carcinoma globally in 2022, with the incidence and mortality of RCC showing a continuous upward trend. The American Cancer Society estimated 80,980 new cases and 14,510 deaths of renal cell carcinoma in the United States alone in 2025. Renal cell carcinoma has the highest mortality rate among urinary system malignant tumors, and patients with metastatic or drug-resistant RCC still exhibit a poor prognosis. With the widespread application of targeted therapy and immunotherapy, remarkable progress has been made in the clinical treatment of RCC. The first-line standard treatment for advanced or metastatic renal cell carcinoma mainly adopts combination regimens of immune checkpoint inhibitors, or regimens combining immune checkpoint inhibitors with anti-angiogenic tyrosine kinase inhibitors. Despite the continuous advancement of therapeutic approaches, a large number of patients still experience disease progression, drug resistance, or treatment intolerance. Therefore, the development of novel anti-RCC drugs with clear mechanisms, safety, and efficacy remains an urgent clinical need1,2,3.
Shikonin is the principal bioactive constituent extracted from Radix Arnebiae, and its derivative acetylshikonin has exhibited prominent anti-RCC pharmacological effects. Existing evidence has demonstrated that shikonin exerts anti-RCC activity through multitarget and multipathway regulatory mechanisms. Mechanistically, shikonin can upregulate the expression of the tumor suppressor gene TEK and inhibit the phosphorylation of the AKT/mTOR signaling cascade, thereby suppressing the proliferation, migration, and invasion of RCC cells4; In addition, shikonin induces intracellular reactive oxygen species (ROS) accumulation to trigger mitochondrial dysfunction, further initiating multiple programmed cell death patterns including apoptosis, necroptosis, and autophagy in RCC cells5. It also modulates the expression of microRNAs such as miR-15b and miR-99b and regulates apoptosis-associated target genes, including FOXO1 and PDCD4, via the MAPK/ERK pathway, with these regulatory effects showing evident cell line specificity6. Notably, shikonin retains potent antitumor activity against sunitinib-resistant RCC cell lines, wherein it elicits therapeutic effects by activating necrosome complexes, inhibiting the AKT/mTOR pathway, and inducing G2/M cell cycle arrest7. Although the anti-RCC effects of shikonin have been partially validated by existing experimental studies, the core therapeutic targets, key signaling networks, and the underlying molecular regulatory mechanisms of shikonin against RCC remain unclear; moreover, systematic prediction, molecular verification, and experimental confirmation of its hub targets are still lacking, forming an important research gap in current studies.
Network pharmacology and molecular docking serve as complementary technical approaches in modern natural drug research and pharmacological mechanism exploration. From a systematic perspective, network pharmacology can systematically decode the multitarget, multipathway holistic interaction characteristics between bioactive compounds and disease-related targets. In contrast, molecular docking enables molecular-level verification of the binding affinity and stable interaction pattern between small-molecule compounds and core target proteins. The combination of these two methodologies constructs a systematic research closed-loop of holistic target prediction followed by molecular verification. Combining experimental validation with network pharmacology and molecular docking is a mainstream approach for natural drug research, which facilitates the clarification of disease pathogenesis and the elucidation of compound pharmacological mechanisms, and provides a theoretical framework for basic research and translational application of drugs8,9.
In this study, network pharmacology was applied to predict the candidate targets of shikonin in the treatment of renal cell carcinoma. Molecular docking was used to theoretically verify potential targets, and the key action targets were finally determined through in vitro experiments and further confirmed by Western Blot (WB) experiments. The whole process of this study is shown in Figure 1.
Protocol
Loading...
$$\rightleftharpoonup{xx}$$
$$\longleftharp{xx}$$,
$$\longrightharp{xx}$$,
All human cell lines used in this study were purchased from authenticated commercial cell banks, and no fresh human tissues or patient samples were collected. Ethical approval was therefore not required for this in vitro cell-based study.
Obtaining and predicting shikonin targets
The keyword "shikonin" was searched in the PubChem database. The SDF structure of shikonin was downloaded, and its simplified molecular-input line-entry system (SMILES) notation was obtained. According to the requirements of the respective target databases, potential shikonin targets were predicted and collected from the PharmMapper, SwissTargetPrediction, HERB, and SEA Search Server databases on March 3, 202610,11,12.
Obtaining renal cell carcinoma targets
Using renal cell carcinoma as the keyword, human-derived disease targets were retrieved from the Therapeutic Target Database (TTD), OMIM, and GeneCards, with species limited to Homo sapiens and Relevance Score > 50. A total of 1148 targets were initially obtained, and after summarizing and deduplicating, 1087 unique renal cell carcinoma-related targets were finally acquired13,14,15.
Identification of intersection targets of shikonin for the treatment of renal cell carcinoma
The predicted gene targets of shikonin and renal cell carcinoma targets were input into Venny 2.1, an online analysis tool. Overlapping targets were identified by intersection analysis and visualized in a Venn diagram.
Establishment of the component-target-disease network
Using shikonin as the core research starting point, we integrated physiological association information between these core targets and RCC, and constructed a molecular interaction network of the "component-target-disease" ternary system using Cytoscape visualization software.
Construction of protein interaction network and core target acquisition of shikonin in the treatment of renal cell carcinoma
Protein interaction database STRING is the core tool to construct protein-protein interaction (PPI) networks, which enables mining and visualization of the interaction relationship between proteins. In this study, the overlapping targets between shikonin and renal cell carcinoma were submitted to the STRING database, with the species set to Homo sapiens for further retrieval. Click the Continue button for subsequent analysis. In the Settings module at the bottom of the analysis results page, the minimum required interaction score was set to a high confidence level of 0.900. At the same time, unrelated proteins and disconnected nodes in the network were hidden to obtain the optimized PPI network mutual mapping. The data were stored in TSV format and imported into Cytoscape software. Corresponding parameters were adjusted so that node size and color shade reflected the corresponding values, and the edge thickness reflected the binding rate score. The PPI network map was established16,17.
Based on the above PPI network, core targets were accurately screened. The cytohubba plug-in was opened in the Apps module of Cytoscape, and the Calculate button was clicked to start the calculation program. The MCC algorithm was selected from the Top 6 node(s) ranked by option, and the Submit button was clicked to complete the calculation. The top six core targets were screened out for beautification and data download.
GO enrichment analysis and KEGG pathway analysis of shikonin in the treatment of renal cell carcinoma
The Metascape database was used for GO enrichment analysis. In this study, the shikonin-targeted intersections with renal cell carcinoma were imported into the database. First, the selected species was Homo sapiens (human), and then the Custom Analysis mode was selected. Enrichment Analysis was performed for the three dimensions of GO functional enrichment: molecular functions, cellular components, and biological processes. The p-value cut off was set to 0.01, and the enrichment analysis button was clicked to perform analysis using the microcredit platform to construct a GO enrichment analysis visualization of shikonin in the treatment of renal cell carcinoma18,19.
KOBAS 3.0 database was employed to perform KEGG signaling pathway enrichment analysis on the overlapping targets between shikonin and renal cell carcinoma, and this database can realize pathway annotation and enrichment statistical analysis of genes. The screened intersection targets were imported into the KOBAS 3.0 database; the source of the selected species was H. sapiens (human), the screening type was limited to KEGG signaling pathway, and the p-value threshold for enrichment analysis was set to <0.01. After analysis, the enrichment results of the KEGG pathway were obtained. Based on the enrichment analysis results, the p-value was used as the basis for sorting, and the top 10 KEGG signal pathways were screened out. The visualization processing was completed with the help of a microsignaling platform, and finally, the KEGG enrichment Sankey diagram bubble chart was drawn and saved20,21.
Molecular docking verification
The three-dimensional (3D) structure of shikonin was retrieved from the PubChem database, and Open Babel software was applied to transform the 3D structure into standard PDB format. The three-dimensional protein structures of the core targets identified by network pharmacology analysis were downloaded in PDB format from the RCSB protein database and AlphaFold database. The crystal structures of the target proteins included PIK3CA (PDB ID: 9B4T), PIK3CD (PDB ID: 8BCY), PIK3R1 (PDB ID: 7CIO), PTPN11 (PDB ID: 9R16), SRC (PDB ID: 9NS1), PIK3CB (AlphaFold-predicted structure, AF-Q8BTI9-F1-model_v6). Water molecules and heteroatoms were removed, polar hydrogens were added, and Gasteiger charges were assigned using AutoDock Tools. The AutoDock Tools software was used to select the docking box of an appropriate size to cover the entire target protein for molecular docking. Finally, visualization of target-active component pairs with optimal binding energy was obtained. PyMol software was used to analyze the binding sites, the type and distance of binding interaction, and to generate a three-dimensional conformational visualization image22,23.
Cytotoxicity test
Caki-1 cells were inoculated into 96-well culture plates at a density of 5,000 cells per well and treated with shikonin at concentrations of 12.5, 25, 50, and 100 µmol/L for 12 h and 24 h, respectively. For 786-O cells, only24 h treatment was performed with the same concentration gradient. The cytotoxic effect of shikonin on both cell lines was evaluated using the MTT assay. All experiments were performed in biological triplicates with three technical replicates for each condition. Results are expressed as IC50 values. Although the overall inhibitory trend was consistent between the two cell lines, shikonin exhibited stronger cytotoxicity towards Caki-1 cells. Therefore, Caki-1 cells were selected for subsequent functional experiments.
Effect of shikonin on Caki-1 cell migration as determined by scratch-wound assay
Caki-1 cells and 786-O cells in logarithmic phase were seeded into 6-well plates. Parallel scratch lines were created at the bottom of each well using a sterile 200 µL pipette tip. After overnight attachment, PBS was utilized to wash the cultured cells. Cells were treated with different concentrations of shikonin (12.5, 25, 50, and 100 µmol/L) for 12 h. After 12 h, the change in the scratch area at the same site was observed under a microscope.
The formula for calculating the effect of shikonin on the growth activity of Caki-1 cells was as follows: mobility = [(0 h scratch area − 12 h scratch area)/0 h scratch area] × 100%.
Determination of Caspase-3 and Caspase- 8 activities
Caki-1 cells at the logarithmic growth phase were harvested, and the cell concentration was adjusted to 5 × 10⁶ cells/mL, followed by incubation for 12 h. After Caki-1 cells were treated with different concentrations of shikonin (12.5, 25, 50, and 100 µmol/L) and incubated for 24 h, cell detection was performed as described in the Caspase test kit.
Effects of shikonin on the apoptosis rate of Caki-1 cells
Logarithmically growing Caki-1 cells were seeded into 6-well culture plates. Cells were treated with shikonin at concentrations of 12.5, 25, 50, and 100 µmol/L for 24 h in the absence of a control group. Cells were gently resuspended in PBS, collected, and counted. A total of 1 × 10⁵ resuspended cells were centrifuged at 300 × g for 5 min. The supernatant was discarded, and the cell pellet was gently resuspended in 195 µL of Annexin V-FITC binding buffer. Then, 5 µL of Annexin V-FITC was added, followed by 10 µL of propidium iodide staining solution, both with gentle mixing. Cells were incubated at room temperature (20–25 °C) in the dark for 15 min prior to analysis.
Cell signaling pathway analysis
The Caki-1 cells were treated with 12.5, 25, 50, and 100 µmol/L shikonin. After 24 h, the cells were harvested in cold PBS, lysed with cell lysis buffer containing protease inhibitor, and the protein concentration was measured. Protein was isolated on a 10% Sodium dodecyl sulfate (SDS)-polyacrylamide gel. After transfer to PVDF membranes, the membranes were blocked with 5% BSA for 3 h, then incubated overnight at 4 °C with a different primary antibody. Subsequently, the membranes were incubated with the secondary antibody at a dilution of 1:3000. Protein bands were detected with the ECL detection system and analyzed quantitatively using ImageJ software.
Statistical analysis
Experimental results were presented as the mean ± standard deviation (x ± s, n = 3). Before parametric statistical analysis, normality was verified using the Shapiro-Wilk test, and homogeneity of variance was assessed by Levene’s test. One‑way analysis of variance (ANOVA) combined with Tukey's post hoc test was performed using SPSS software. Statistical graphs were constructed with GraphPad Prism software. The independent‑samples t-test was used for pairwise comparisons between groups, and p < 0.05 indicated statistically significant differences.
Results
Loading...
$$\rightleftharpoonup{xx}$$
$$\longleftharp{xx}$$,
$$\longrightharp{xx}$$,
Obtaining and predicting shikonin targets
Using the four aforementioned databases, potential shikonin targets were predicted, and 426 targets were identified after integration and summarization. The summarized targets were deduplicated, resulting in 374 targets, as shown in Figure 2A.
Obtaining renal cell carcinoma targets
A total of 1,147 targets were obtained after summarizing the data related to the three databases, and a total of 1,087 renal cell carcinoma targets were obtained after summarizing and deduplicating.
Identification of intersection targets of shikonin for the treatment of renal cell carcinoma
By intersecting the predicted targets of shikonin with those related to renal cell carcinoma, 98 overlapping targets were identified, representing the key targets of shikonin in the treatment of renal cell carcinoma, as shown in Figure 2B.
Establishment of the component-target-disease network
To systematically analyze the molecular regulatory mechanism of shikonin in the treatment of renal cell carcinoma, we first conducted systematic integration screening and verification of potential action targets of shikonin, and ultimately identified 98 core targets intimately associated with the therapeutic effects of shikonin against renal cell carcinoma. Using shikonin as the core research starting point, in combination with the information about the physiological correlation between the 98 targets and renal cell carcinoma, a molecular interaction network was established using Cytoscape visualization software for the "component‑target‑disease” network trinity, as illustrated in Figure 2C.
Establishment of the PPI network and core target screening
The intersecting targets were imported into the online database STRING for analysis to obtain a protein-protein interaction (PPI) network diagram, and the corresponding interaction data were imported into the Cytoscape software. Visual optimization of node parameters was performed based on the Degree value, and a visualized PPI network was constructed. In the generated network, node size and color intensity were positively associated with Degree in descending order, as shown in Figure 2D and Table 1. The MCC algorithm of CytoHubba, a Cytoscape plug-in, was used for analysis, and finally identified the core targets of shikonin employed in the therapy of renal cell carcinoma. As shown in Figure 2E, six core targets of SRC, PIK3CA, PIK3CB, PIK3CD, PTPN11, and PIK3R1 were finally obtained.
GO and KEGG enrichment analysis
The Metascape database was used for enrichment analysis of the common action targets of shikonin and renal cell carcinoma. The analysis results showed that there were 1,396 biological processes (BP), 77 cellular components (CC), and 126 molecular functions (MF) in which shikonin was mainly involved. Based on the microcredit platform, the GO chord diagram was drawn. The analysis indicated that shikonin was mainly associated with protein kinase activity, cell surface receptor protein tyrosine kinase signaling pathway, and phosphotransferase activity, as shown in Figure 2F and Table 2. KEGG enrichment analysis was performed on 98 intersecting targets. The results showed that there were 224 signaling pathways involved in these 98 targets, among which 19 targets, such as PIK3CA/PIK3CB/HMOX1/PIK3CD, were able to regulate the HIF-1 signaling pathway, and 13 targets, such as PTGS2/CASP3/LCN2/CASP8, were able to regulate the IL-17 signaling pathway, etc., as shown in Figure 2G.
Molecular docking analysis
The core targets SRC, PIK3CA, PIK3CB, PIK3CD, PTPN11 and PIK3R1 were selected as receptors, and the screened component Shikonin was used as a ligand for molecular docking, respectively, as shown in Table 3 and Figure 3. The binding energy between the receptor and ligand was not higher than 0 kcal/mol, demonstrating stable binding interactions. The lower the binding energy, the stronger the binding ability of the ligand and receptor. Among them, the core targets SRC and PIK3CB had the best binding energy with Shikonin of −6.7 kcal/mol, indicating that the screened active components had strong binding ability to the selected core targets and good binding activity.
Shikonin Regulates Morphology and Proliferation of 786-O Renal Cancer Cells
Microscopic examination of 786-O cells showed that the control group cells were uniform in size and regular in shape with minimal pleomorphism. In contrast, 786-O cells treated with shikonin presented obvious morphological abnormalities, including irregular cell shape and reduced adhesion to the culture dish surface. After 24 h of treatment with shikonin, the morphology of 786-O cells changed significantly: the originally spindle-shaped cells gradually transformed into round cells, and the cell surface swelled, accompanied by the formation of apoptotic bodies. Some cells showed vacuolation and fragmentation, which was consistent with the apoptotic characteristics (Figure 4A-E). In terms of cell viability, MTT assay results showed that shikonin could significantly inhibit the proliferation of 786-O cells in a dose-dependent and time-dependent manner. The 24-h IC₅₀ value of shikonin on 786-O cells was (86.13 ± 1.26) µmol/L. With the increase of shikonin concentration, the inhibitory effect was gradually enhanced, and the cell viability was significantly reduced. These results indicated that shikonin could effectively inhibit the proliferation of 786-O renal cancer cells and induce their apoptosis, which was consistent with the anti-tumor effect of shikonin in renal cancer (Figure 4F). To assess shikonin‑mediated migration inhibition in 786‑O cells, a wound‑healing assay was used. After 24 h treatment, 12.5 µmol/L shikonin markedly suppressed 786-O cell migration in a dose‑dependent manner (P <0.0001) (Figure 4G-L). The experimental trend was consistent with that observed in Caki-1 cells, yet both sets of results demonstrated that shikonin exerted a stronger inhibitory effect on Caki-1 cells. Therefore, Caki-1 cells were selected for all subsequent experiments.
Cell inhibitory activity of shikonin
Microscopic examination of cellular morphology indicated that cells in the control group were uniform in size and regular in shape, with minimal pleomorphism, whereas shikonin-treated cells showed marked pleomorphism and morphological abnormalities and adhered to the surface of Petri dishes. After 24 h of exposure to elevated concentrations of shikonin, the morphology of Caki-1 cells gradually transformed from spindle to round. The cell surface gradually swelled, accompanied by the formation of apoptotic bodies. Some cells became vacuolated, fragmented, and lysed. In particular, after 24 h of exposure to 100 µmol/L shikonin, severe vacuolation and fragmentation were observed in a dose-dependent manner. It indicated that shikonin could inhibit the proliferation of renal cell carcinoma and promote cellular apoptosis (Figure 5A–E).
MTT assay
To analyze the effect of shikonin on Caki-1 cells, the cell viability was assessed by using the MTT assay. Caki-1 cells were treated with 12.5, 25, 50, and 100 µmol/L shikonin for 12 h and 24 h, respectively, to observe its anticancer activity. The results showed that shikonin with different concentrations hindered the proliferative capacity of Caki-1 cells to different extents as compared with the control group. At 50 µmol/L, the inhibition was significant (p < 0.001). The IC50 values of the inhibitory effect of shikonin on Caki-1 cells at 12 h and 24 h are (45.13 ± 1.26) µmol/L and (23.18 ± 2.03) µmol/L, respectively. Shikonin showed significant inhibition on renal cancer cells, and the inhibition at 24 h was significantly higher than that at 12 h, showing a time-dependent and dose-dependent manner (Figure 5F,G). Meanwhile, relative to the control group, the viability of the cells was significantly decreased within 12–24 h. Subsequently, as the treatment time of Caki-1 cells increased, the results showed that Caki-1 cells showed the best antiproliferative effects after 24 h under different concentrations of shikonin.
Detection of the effect of shikonin on the migration of Caki-1 cells by scratch-wound assay
To evaluate the effect of shikonin on Caki-1 cell migration, a wound-healing assay was conducted using cells treated with various concentrations of shikonin. After 24 h of culture, Caki-1 cells treated with a low dose of 12.5 µmol/L shikonin showed significantly reduced migration compared to the control group. This indicated that even low doses of shikonin could effectively inhibit the migration of Caki-1 cells. Cell mobility decreased in a dose-related manner with the increase in shikonin concentration (p < 0.0001) (Figure 5H–M).
Effects of shikonin on Caspase-3 and Caspase-8
Compared with the control group, the secretion levels of Caspase-3 and Caspase-8 in the shikonin concentration range of 12.5–100 µmol/L were significantly or extremely significantly increased (p < 0.01 or p < 0.05). When the shikonin concentration was 100 µmol/L, the Caspase-3 and Caspase-8 levels reached 6.375 and 19.102 pmol/L, respectively, indicating that shikonin enhanced the activities of Caspase-3 and Caspase-8 in Caki-1 cells in a dose-dependent manner (Figure 6).
Effects of shikonin on the apoptosis rate of Caki-1 cells
Flow cytometric analysis was performed following Annexin V‑PI double staining. Region Q1 represented annexin V‑negative and PI‑positive necrotic cells, Q2 indicated double‑positive late apoptotic cells, Q3 stood for annexin V‑positive and PI‑negative early apoptotic cells, and Q4 corresponded to double‑negative viable cells. Our data revealed that the ratio of apoptotic and dead cells in Caki‑1 cells gradually increased with increasing shikonin concentration. In the CK group, the early apoptotic cells accounted for 14.6%, and the dead cells accounted for 1.42%, accounting for 16.02% of all cells in total. In contrast, treatment of Caki-1 cells with 100 µmol/L shikonin increased the proportion of early apoptotic and necrotic cells to 70.31% (Figure 7). These findings suggested that shikonin might exert its effects on renal cell carcinoma via triggering apoptosis and necrosis in tumor cells.
Western blotting validation experiment
To study the effect of shikonin on the key regulatory proteins PIK3CA, PIK3CB, and PIK3CD in the HIF-1 signaling pathway, a western blot was used to detect the protein expression levels of shikonin at different concentrations in Caki-1 cells. The expression level of PTPN11 was also detected. Western blot results showed that shikonin treatment dose-dependently downregulated PIK3CB protein expression in Caki-1 cells. In contrast, PIK3CA, PIK3CD, and PTPN11 were significantly upregulated in a dose-dependent manner. Notably, key downstream effector molecules, including p-AKT, p-mTOR, and HIF-1α, were markedly reduced with increasing shikonin concentration, demonstrating that the PI3K/AKT/mTOR/HIF-1 signaling axis was functionally inhibited despite the compensatory upregulation of certain catalytic subunits. These observations indicate that the elevated expression of PIK3CA, PIK3CD, and PTPN11 likely represents a compensatory feedback response to the functional suppression of the oncogenic signaling pathway, rather than pathway activation. It was speculated that shikonin might inhibit the HIF-1 signaling pathway and cell growth by regulating the expressions of PIK3CA, PIK3CB, PIK3CD, and PTPN11 proteins(Figure 8 and Figure 9).
DATA AVAILABILITY:
All raw data, analytical datasets, and computational results generated during this study are available on https://doi.org/10.6084/m9.figshare.32335233.v1.
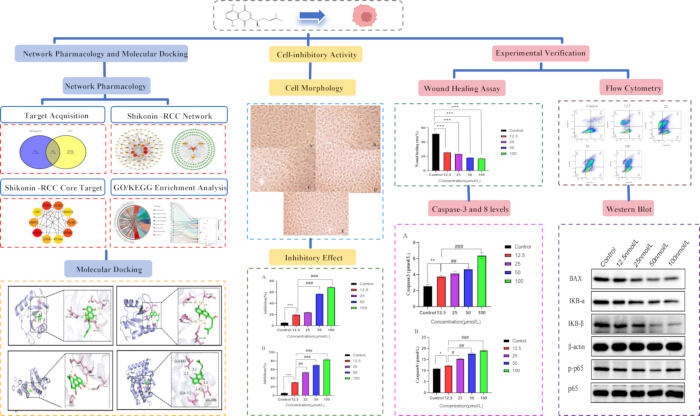
Figure 1. Flow chart of the effect of shikonin on renal cell carcinoma. The overall research workflow includes target screening via network pharmacology, construction of PPI networks, GO/KEGG enrichment analysis, molecular docking, and in vitro experimental validation (MTT assay, scratch wound healing assay, apoptosis assay, and Western blotting). Please click here to view a larger version of this figure.
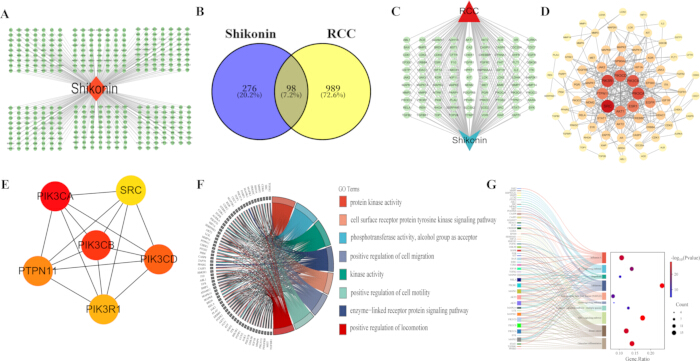
Figure 2. Network pharmacology analysis of shikonin in renal cell carcinoma. (A) PPI network of shikonin-predicted targets. (B) A Venn diagram showing the 98 intersecting targets between shikonin and renal cell carcinoma. (C) Component-target-disease interaction network. (D) PPI network of overlapping targets. (E) Top 6 core targets screened by the MCC algorithm. (F) GO enrichment analysis of intersecting targets. (G) KEGG pathway enrichment analysis. Please click here to view a larger version of this figure.
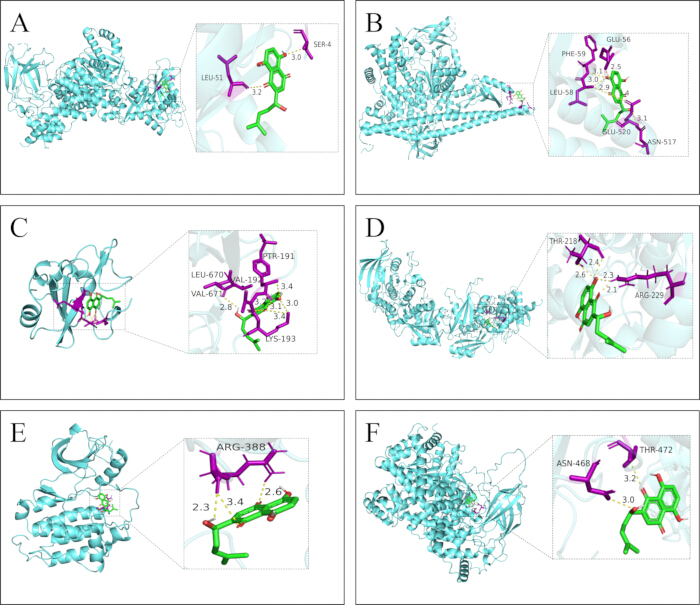
Figure 3. Molecular docking of shikonin with core targets. (A) Molecular docking diagram of shikonin-PIK3CA. (B) Molecular docking diagram of shikonin-PIK3CD. (C) Molecular docking diagram of shikonin-PIK3R1. (D) Molecular docking diagram of shikonin-PTPN11. (E) Molecular docking diagram of shikonin-SRC. (F) Molecular docking diagram of shikonin-PIK3CB. A binding energy ≤0 kcal/mol indicates stable binding. Please click here to view a larger version of this figure.
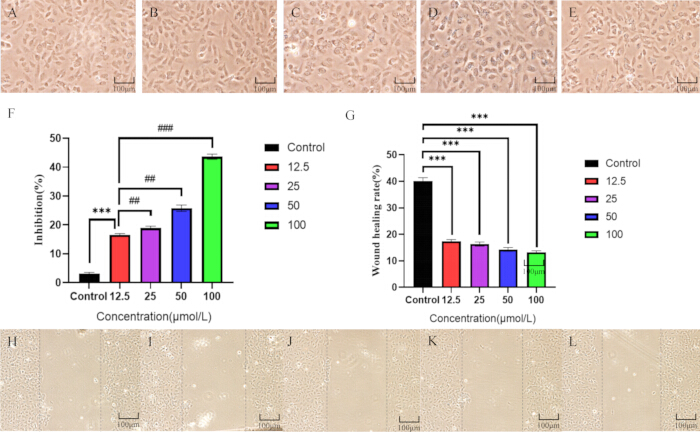
Figure 4. Effects of shikonin on 786-O cells. (A–E) Morphological changes of 786-O cells treated with shikonin. Scale bar: 100 µm. (F) Inhibitory effect of shikonin on 786-O cells at 24 hours. (G) Effect of shikonin on the migration ability of 786-O cells. (H–L) Representative images of scratch wound healing assay of 786-O cells treated with shikonin at different time points or concentrations. Scale bar: 100 µm. *, ** and *** indicate significant differences compared with the control group. #, ## and ### indicate significant differences compared with the 12.5 µmol/L treatment group. *p < 0.05; **p < 0.01; ***p < 0.001, #p < 0.05; ##p < 0.01; ###p < 0.001. n = 3. Please click here to view a larger version of this figure.
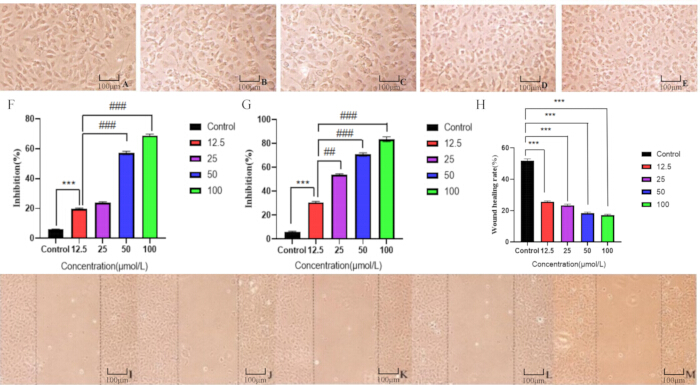
Figure 5. Effects of shikonin on Caki-1 cells. (A–E) Cell morphology affected by shikonin. Scale bar: 100 µm. (F) 12-hour inhibitory effect of shikonin on renal cancer cells. (G) The inhibitory effect of shikonin on 24-hour renal cancer cells. (H) Effects of shikonin on the migration of Caki-1 cells. (I–M) Effects of shikonin on the scratch of Caki-1 cells. Scale bar: 100 µm. *, **, and *** indicate significant differences compared with the control group. #, ## and ### indicate significant differences compared with the 12.5 µmol/L treatment group. *p < 0.05; **p < 0.01; ***p < 0.001. #p < 0.05; ##p < 0.01; ###p < 0.001. n = 3. Please click here to view a larger version of this figure.
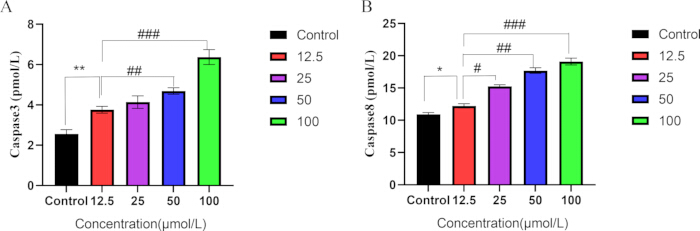
Figure 6. Effects of shikonin on caspase-3 and caspase-8 activities in Caki-1 cells. (A) Caspase-3 activity. (B) Caspase-8 activity. Data are presented as mean ± SD. *, **, and *** indicate significant differences compared with the control group. #, ## and ### indicate significant differences compared with the 12.5 µmol/L treatment group. *p < 0.05; **p < 0.01; ***p < 0.001. #p < 0.05; ##p < 0.01; ###p < 0.001. n = 3. Please click here to view a larger version of this figure.
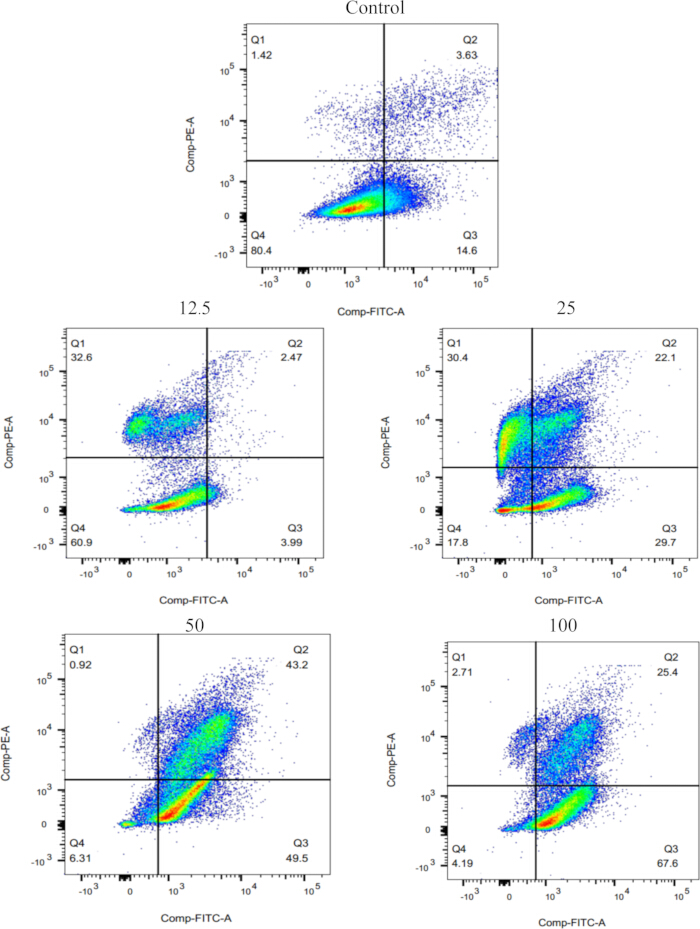
Figure 7. Regulation of shikonin on the apoptosis level of Caki-1 cells. Apoptosis was detected by Annexin V-FITC/PI staining and flow cytometry. The proportion of apoptotic cells increases in a dose-dependent manner. Please click here to view a larger version of this figure.
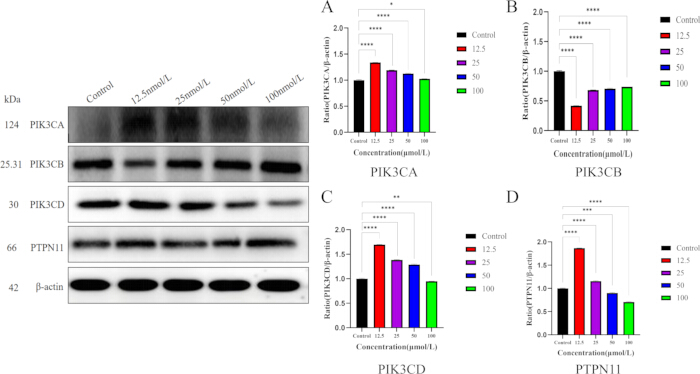
Figure 8. Results of Western blot. (A–D) The protein expression levels of PIK3CA, PIK3CB, PIK3CD, and PTPN11 in Caki-1 cells of each treatment group were detected by Western blot. *, ** ,*** and **** indicate significant differences compared with the control group *p < 0.05; **p < 0.01; ***p < 0.001; ****p < 0.0001. Please click here to view a larger version of this figure.
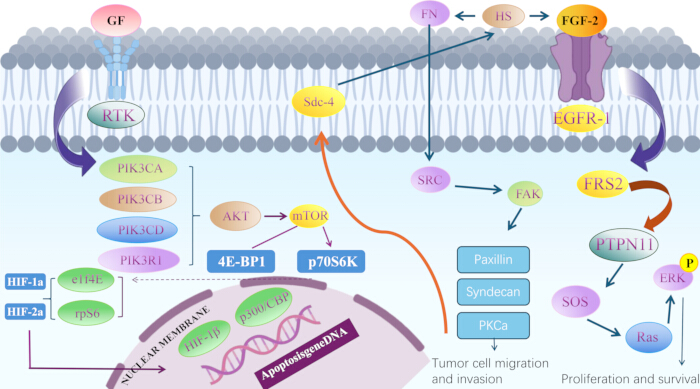
Figure 9. Possible mechanism of shikonin inhibiting the malignant phenotype of human RCC. Shikonin targets SRC, PIK3CA, PIK3CB, PIK3CD, PTPN11, and PIK3R1 to inhibit the HIF-1 signaling pathway, thereby suppressing proliferation, migration, and inducing apoptosis of RCC cells. Please click here to view a larger version of this figure.
Table 1: Information about PPI targets of shikonin in the treatment of renal cell carcinoma. Degree, betweenness, and other topological parameters of core targets in the PPI network. Please click here to download this Table.
Table 2: GO enrichment analysis of shikonin target genes in the treatment of renal cell carcinoma. Top biological processes, cellular components, and molecular functions with p < 0.01. Please click here to download this Table.
Table 3: Minimum binding energy between shikonin and protein. Minimum binding energy (kcal/mol) from molecular docking; lower value indicates stronger binding. Please click here to download this Table.
Discussion
Loading...
$$\rightleftharpoonup{xx}$$
$$\longleftharp{xx}$$,
$$\longrightharp{xx}$$,
PIK3CA is formally known as phosphatidylinositol 4,5-bisphosphate 3-kinase catalytic subunit alpha isoform. PIK3CA, a central component of the PI3K/AKT/mTOR pathway, plays an essential role in the occurrence, development, and treatment of renal cell carcinoma (RCC). Studies have shown that PIK3CA is a high-frequency mutant gene of this subtype (6/57, 11%), and its mutation is directly related to the abnormal activation of the PI3K/AKT pathway. Moreover, such patients respond well to the therapeutic regimen of an immune checkpoint inhibitor combined with a tyrosine kinase inhibitor (ICI/TKI), and the objective remission rate and disease control rate are significantly superior to those of traditional therapy24. Studies have shown that PIK3CA is one of the most frequently changed genes in RCC, and it has mutations in major subtypes such as clear cell carcinoma. Its abnormal activation can drive tumor angiogenesis and proliferation, and is also an important mechanism of tyrosine kinase inhibitor (TKI) treatment resistance25. In addition, PIK3CA, a key gene that activates the mTOR pathway, promotes tumor proliferation by regulating cell growth and metabolism. This gene mutation is associated with therapeutic resistance to mTOR inhibitors and is an independent poor prognostic factor, providing a potential target for targeted therapy for renal cell carcinoma26. In summary, PIK3CA is not only a core driver of RCC, but also its mutation state can guide the selection of clinical treatment options, provide the basis for the sensitivity prediction of ICI/TKI combination therapy, and become an important target for the accurate treatment of RCC.
PIK3CD, also called phosphatidylinositol 4,5-bisphosphonate 3-kinase catalytic subunit delta isoform, is a key member of the PI3K family and plays a core role in the occurrence and development of renal cell carcinoma (RCC). Its targeted therapeutic potential has been confirmed by many studies. It has been discovered in the study that PIK3CD is one of the 13 candidate susceptible genes significantly enriched with rare harmful mutations, the mutations of which are strongly associated with the activation of the PI3K/mTOR signaling pathway, whose abnormal activation occurs at a high frequency in patients with co-occurrence of RCC and melanoma, renal cell carcinoma (RCC) frequently presents comorbidly with melanoma in clinical practice, with shared dysregulated oncogenic signaling pathways driving their co‑occurrence, suggesting that PIK3CD can be used as a potential target for screening and early intervention for RCC high-risk population27. The prognosis risk model of KIRC (clear cell renal carcinoma) was constructed by LASSO regression analysis, and it was confirmed that PIK3CD was one of the 12 core genes. When compared with normal renal tissues, the expression of PIK3CD protein in KIRC tissues was obviously upregulated, and its expression level was related to the tumor stage, classification, and metastatic status28. It has been further verified in the research on patients with ccRCC that PIK3CD mRNA is significantly up-regulated in tumor tissues, which promotes the phosphorylation of 4E-BP1 by activating the PI3K pathway, relieves the inhibition on eIF4E, enhances the translational expression of oncogenic genes such as VEGFC, and finally promotes tumor progression29. In summary, PIK3CD participates in the development of RCC by regulating the PI3K/mTOR pathway and the downstream translation initiation process, and its expression level and genetic variation can provide a basis for prognosis assessment of RCC.
PIK3CB, also known as phosphatidylinositol 4,5-bisphosphonate 3-kinase catalytic subunit beta isoform, is a key component of the PI3K/AKT/mTOR signaling pathway and has significant potential as a targeted therapy for renal cell carcinoma. Studies have shown that the mRNA and protein levels of PIK3CB in KIRC tissues are significantly down-regulated, and the low expression is closely related to the worse overall survival, progression-free survival, and disease-free survival of patients, suggesting that PIK3CB can be used as an independent prognostic biomarker30. Further analysis by databases such as GEPIA and K-M plotter has confirmed that high expression of PIK3CB is positively correlated with good prognosis of ccRCC patients, and its mRNA expression level is negatively correlated with tumor staging, all of which can predict favorable survival outcomes for patients in stages I–IV31. In addition, PIK3CB is associated with resistance to 30 small-molecule drugs, providing a potential direction for drug screening. In addition, lncRNA ADAMTS9-AS2 exerted an inhibitory effect on the PI3K/AKT/mTOR pathway by downregulating PIK3CB, providing new ideas for joint targeting strategies32. In summary, PIK3CB is not only an important indicator for prognosis assessment of renal cell carcinoma, but also its regulatory signal network and immune infiltration-related characteristics make it a promising targeted therapeutic target, providing a new academic basis and practical direction for improving the therapeutic effect of renal cell carcinoma.
PIK3R1 is fully known as phosphatidylinositol 3-kinase regulator subunit alpha. Studies have shown that PIK3R1 exerts tumor inhibition through the AKT/gsk3b/ctnb1 pathway. Knockdown can enhance the RCC cell growth, motility, and epithelial‑mesenchymal transition transformation capacity and induce cancer stem cell-like phenotype. Knockdown of Akt or ctnb1 can reverse this effect. In addition, PIK3R1 can stabilize the PI3K complex, and its deletion will release the negative regulation of the PI3K/AKT pathway, leading to pathway overactivation33. In Caki-1 cells, miR-455 negatively regulates the expression of PIK3R1, while PIK3R1 overexpression significantly inhibits cell proliferation and migration, and downregulation promotes tumor malignant phenotype34. In summary, PIK3R1 participates in RCC development by regulating key pathways and tumor cell characteristics, and restoring its expression or targeting related pathways may offer new ideas for RCC treatment.
PTPN11 is also called tyrosine-protein phosphatase non-receptor type 11, and its functional regulation is closely related to the progression of RCC. Accumulating evidence indicates that PTPN11 is upregulated in KIRC tissues. Notably, although its high expression is significantly correlated with prolonged overall survival and disease-free survival in patients (suggesting a potential tumor-suppressive clinical phenotype), functional assays reveal that PTPN11 exerts pro-tumor effects in renal cell carcinoma progression. In addition, PTPN11 is involved in the remodeling of the tumor immune microenvironment by regulating M2-type macrophage infiltration and CD8+T cell activation35. PTPN11 is a direct target gene of miR-124 and is simultaneously regulated by MEG3 and p53. miR-124 can directly bind to its 3'UTR to inhibit expression, while MEG3 indirectly down-regulates its level by activating the p53 pathway. Abnormal activation of PTPN11 reverses the inhibition of miR-124 and MEG3 on RCC cell proliferation, migration, and epithelial-mesenchymal transformation, and the down-regulation of its expression significantly inhibits the malignant phenotype of tumor cells36. In summary, targeted regulation of PTPN11 or its upstream miR-124/MEG3 pathway can provide a new direction for RCC treatment, especially for advanced patients, with clinical value.
SRC, also known as proto‑oncogene tyrosine‑protein kinase Src, acts as a non‑receptor tyrosine kinase and is an important potential target for targeted therapy of renal cell carcinoma (RCC). Muriel D Brada et al. pointed out that SRC was highly expressed in clear cell renal carcinoma (ccRCC), and the strong positive expression was significantly correlated with high tumor stage, high histological grade, and short survival period (p < 0.001). Multivariate Cox analysis confirmed that SRC was an independent prognostic factor (p < 0.05), and its gene mutation was extremely rare in ccRCC and papillary RCC (pRCC) (<2%), suggesting that its carcinogenic effect mainly depended on abnormal expression rather than gene mutation37. SRC is one of the action targets of sunitinib. Sunitinib dose-dependently inhibits the phosphorylation of SRC (p-SRC). Moreover, high expression of SRC substrate Sam68 can enhance the apoptosis of RCC cells induced by sunitinib. However, low expression weakens the drug sensitivity, revealing the key role of the SRC signaling pathway in the regulation of targeted therapeutic response38. SRC and FAK form a double kinase complex and phosphorylate paxillin to activate the downstream signal. The positive expression rate of SRC in RCC of stage T3 is markedly increased in comparison with that in stage T1 (p < 0.005). Multifactor analysis shows that patients with T3-stage renal cell carcinoma exhibited a 13.6-fold higher risk of SRC occurrence compared with T1-stage patients (p < 0.005)39. In summary, SRC participates in the development of RCC by regulating cell proliferation, migration, and treatment sensitivity, and targets the inhibition of SRC or the combination of sunitinib and other drugs, which may offer novel and more efficient therapeutic strategies for patients with advanced renal cell carcinoma.
In summary, network pharmacology analysis revealed that shikonin exerts its therapeutic effects against renal cell carcinoma by targeting the core genes, including SRC, PIK3CA, PIK3CB, PIK3CD, PTPN11, and PIK3R1. Notably, although Western blot revealed increased protein levels of PIK3CA, PIK3CD, and PTPN11 following shikonin treatment, this upregulation is interpreted as a tumor-cell compensatory feedback response upon HIF-1 pathway suppression by shikonin. Tumor cells attempt to counteract pathway inhibition by elevating these key proteins, which does not reverse the overall anti‑tumor effect of shikonin. Meanwhile, molecular docking analysis verified that shikonin can form stable interactions with these key target proteins, with the best binding affinity observed for SRC and PIK3CB. In vitro experiments confirmed that shikonin could inhibit the activity of the HIF-1 signaling pathway, suppress cell proliferation and migration, while promoting apoptosis induction of Caki-1 cells by regulating the expressions of PIK3CA, PIK3CB, PIK3CD, and PTPN11 proteins. This study clarified that shikonin may exert the anticancer effect on renal cell carcinoma by acting on the above core targets and regulating the HIF-1 signaling pathway, revealing its potential mechanism. This study has several limitations. First, all functional validation was performed only at the cellular level without in vivo animal verification. Second, we did not evaluate off-target effects or systemic toxicity of shikonin. Future research will focus on animal models and clinical sample validation to further confirm the anti-tumor mechanism and translational potential of shikonin, providing a theoretical basis for its clinical application and new-drug development against renal cell carcinoma.
Disclosures
Loading...
$$\rightleftharpoonup{xx}$$
$$\longleftharp{xx}$$,
$$\longrightharp{xx}$$,
The authors have nothing to disclose.
Acknowledgements
Loading...
$$\rightleftharpoonup{xx}$$
$$\longleftharp{xx}$$,
$$\longrightharp{xx}$$,
This research was funded by Guizhou Provincial Health Commission science and Technology (gzwkj2024-516); National and Provincial Science and Technology Innovation Talent Team Cultivation Program of Guizhou University of Traditional Chinese Medicine, Guizhou University of Traditional Chinese Medicine TD Hopes [2023] 005; Guizhou Provincial Natural Science Foundation [grant numbers: ZK [2024] 404]; Chuanxiong protein-polysaccharide complex based on the characteristics of long-circulating Pickering milk to promote the treatment of headache with Chuanxiong (82360779).
Materials
| Name | Company | Catalog Number | Comments |
|---|---|---|---|
| 786-O | American Type Culture Collection (ATCC) | RRID: CVCL_1051 (ATCC CRL-1932) | Human clear cell renal cell carcinoma cell line |
| AlphaFold database | European Molecular Biology Laboratory (EMBL) - EBI | AlphaFold Protein Structure Database | Protein structure prediction database (AlphaFold Protein Structure Database) |
| AutoDock Tools software | Scripps Research Institute | 1.5.7 | Molecular docking software for ligand-protein binding prediction |
| Caki-1 | American Type Culture Collection (ATCC) | RRID: CVCL_0234 (ATCC HTB-46) | Human clear cell renal cell carcinoma cell line |
| Caki-1 cells | Mudanjiang Normal University | HTB-46 (RRID: CVCL_0234) | Human clear cell renal cell carcinoma cell line |
| Caspase 3 and caspase 8 detection kits | Credit Suisse Biotechnology Co Ltd (QUANZHOU, China) | Caspase-3 Activity Assay Kit, Cat. No. RX302848M, Caspase-8 Activity Assay Kit, Cat. No. RX302849M | Used for detecting caspase activity to assess cell apoptosis |
| Cytoscape software | Cytoscape Consortium | 3.9.1 | Used for biological network construction and visualization |
| DMEM medium | Hyclone | SH30022.01 | Cell culture medium for Caki-1 and 786-O cell culture |
| Fetal bovine serum | Gbico | 10099-141 | Cell culture supplement for Caki-1 and 786-O cell growth |
| GeneCards | Weizmann Institute of Science | https://www.genecards.org/ | Comprehensive human gene database for target gene annotation |
| GraphPad Prism | GraphPad, San Diego, CA, USA | version 8.3.0 | For statistical graphs construction |
| HERB database | Chinese Academy of Sciences | http://herb.ac.cn | Traditional Chinese medicine component-target database |
| ImageJ software | National Institutes of Health (NIH) | Fiji | Image analysis software for cell morphology and Western blot band quantification |
| inverted microscope | Olympus, IX73, Japan | 100× magnification. | Used for observing cellular morphology changes after shikonin treatment |
| KOBAS 3.0 database | Peking University | http://bioinfo.org/kobas/ | Gene ontology and pathway enrichment analysis tool |
| Metascape database | Memorial Sloan Kettering Cancer Center | https://metascape.org/gp/index.html) | Gene function enrichment and network analysis tool |
| Microcredit platform | National Center for Bioinformation (China) | http://www.bioinformatics.com.cn/ | Online bioinformatics analysis platform for data processing |
| MTT assay kit | Solarbio Science & Technology Co., Ltd. (Beijing, China) | Cat. No. M8180 | Used for detecting cell viability (antiproliferation assay) |
| OMIM | Johns Hopkins University School of Medicine | https://www.omim.org/ | Online Mendelian Inheritance in Man (human genetic disease database) |
| PharmMapper database | East China University of Science and Technology | https://www.lilab-ecust.cn/pharmmapper/ | Small molecule drug target prediction database |
| PIK3CA, PIK3CB, PIK3CD, and PTPN11 | Santa Cruz Biotechnology, Inc. (Dallas, TX, USA) | Santa Cruz Biotechnology, Inc. (Dallas, TX, USA) | Primary antibodies for Western blot analysis of target proteins |
| PyMol software | Schrödinger, Inc. | 2.2.0 | Molecular visualization software for protein structure analysis |
| RCSB protein database | RCSB Protein Data Bank (Rutgers University) | https://www.rcsb.org/ | Protein structure database (PDB) for molecular modeling |
| SEA Search Server database | University of California, San Francisco | https://sea.bkslab.org | Similarity Ensemble Approach for target prediction |
| Shikonin (purity 98% | leaf organisms originating in China | Y0001439 | Small molecule compound used for renal cell carcinoma (RCC) treatment in this study |
| SPSS | IBM, Armonk, NY, USA | version 20.0 | For statistical analysis |
| STRING | European Molecular Biology Laboratory (EMBL) | https://stringdb.org/ | Protein-protein interaction network database |
| SwissTargetPrediction database | Swiss Institute of Bioinformatics | https://www.swisstargetprediction.ch/ | Small molecule target prediction tool for drug discovery |
| Therapeutic Target Database | Shanghai Institute of Materia Medica | https://ttd.idrbrab.cn | Database of therapeutic targets and drugs |
| Venny 2.1 | Spanish National Center for Biotechnology (CNB-CSIC) | https://bioinfogp.cnb.csic.es/tools/venny/index.html) | Venn diagram tool for data intersection analysis |
Reprints and Permissions
Request permission to reuse the text or figures of this JoVE article
Request Permission