This protocol provides an image-based, live-cell imaging protocol to quantify tumor-infiltrating lymphocyte (TIL)-mediated cytotoxicity against patient-derived tumor organoids, enabling real-time kinetic analysis of apoptosis for functional immune profiling and evaluation of immunomodulatory therapies.
Method Article
A Real-Time Image-Based Co-Culture Assay to Quantify Tumor-Infiltrating Lymphocyte-Mediated Apoptotic Killing of Patient-Derived Tumor Organoids
In This Article
Summary
Abstract
Understanding the functional capacity of tumor-infiltrating lymphocytes (TILs) to recognize and eliminate autologous tumor cells is central to advancing personalized immunotherapy. The goal of this method is to provide an image-based, live-cell imaging protocol that measures TIL-mediated, caspase-3-dependent apoptotic killing against patient-derived tumor organoids (PDTOs) in real time. This method integrates established procedures for isolation and expansion of PDTOs and TILs with a standardized three-dimensional co-culture system and automated fluorescence-based apoptosis detection.
Tumor organoids are plated in imaging-compatible 96-well plates and labeled with a red tumor marker, while expanded TILs are added at defined effector-to-target ratios in the presence of a caspase-3 activated green fluorescent substrate. Co-cultures are imaged every 4 h using a live-cell analysis system to capture phase-contrast and dual-fluorescence channels. Quantitative image analysis identifies red-positive tumor structures and calculates the proportion of red/green double-positive apoptotic tumor objects over time. Appropriate technical and biological replicates are incorporated, along with baseline, spontaneous apoptosis, negative and positive killing controls to ensure assay rigor.
By preserving tumor heterogeneity within the PDTOs' three-dimensional architecture while enabling longitudinal quantification, this protocol provides a physiologically relevant system for functionally profiling patient-specific tumor-TIL interactions and investigating immunomodulatory agents that augment anti-tumor immunity.
Introduction
Cancer immunotherapy has been transformed by the development of immune checkpoint inhibitors (ICIs) targeting the programmed cell death protein 1/programmed death-ligand 1 (PD-1/PD-L1) and cytotoxic T-lymphocyte-associated protein 4 (CTLA-4) pathways, which reinvigorate endogenous T-cell-mediated antitumor responses across multiple solid tumor types1,2,3. Despite durable responses in a subset of patients, most do not achieve meaningful clinical benefit, and validated predictive biomarkers to prospectively identify responders remain an unmet need. Functional assays that directly measure T-cell-mediated tumor killing are therefore critical tools for biomarker discovery and preclinical evaluation of therapeutic combinations designed to enhance cytotoxic immune responses.
Conventional cytotoxicity assays, including chromium-51 release, lactate dehydrogenase (LDH) quantification, and luminescence-based ATP viability assays such as CellTiter-Glo, have been widely used to quantify immune-mediated killing but generate single-timepoint, bulk measurements that lack spatial and temporal resolution4,5,6. Similarly, endpoint flow cytometry-based killing assays quantify cell death at a fixed time point and are poorly suited to three-dimensional culture formats. Additionally, two-dimensional tumor cell lines, which are widely used in these assays, do not fully recapitulate the tumor-intrinsic heterogeneity of primary patient tumors.
Patient-derived tumor organoids (PDTOs) have emerged as a clinically relevant ex vivo platform that more faithfully preserves the genomic alterations, cellular heterogeneity, and drug-response phenotypes of the original tumor than conventional cell line models7,8,9,10,11,12. Recent studies have demonstrated that PDTOs can be co-cultured with autologous immune cells to model antitumor immune responses ex vivo; however, most published approaches rely on endpoint viability measurements or labor-intensive confocal imaging analyses, which limit experimental throughput and preclude dynamic monitoring of the killing response13,14,15,16.
Here, we describe a real-time, image-based co-culture assay for the quantitative, image-derived readout of T-cell-mediated cytotoxicity against fluorescently labeled PDTOs. The method employs time-lapse fluorescence microscopy combined with a caspase-3-activated fluorescent substrate to generate kinetic apoptosis curves at single-organoid resolution over a 12–36 h observation window. Compared to conventional cytotoxicity assays, this platform offers several technical advantages: it preserves three-dimensional tumor architecture throughout the assay, resolves the temporal dynamics of apoptotic induction, accommodates defined effector-to-target ratios, and has potential future application to medium-throughput drug screening formats, including immune checkpoint inhibitors and targeted agents tested alone or in combination. This protocol is intended for investigators working in immuno-oncology, functional precision medicine, and T-cell biology, and can be implemented in laboratories equipped with standard tissue culture infrastructure and a live-cell fluorescence imaging system.
Isolation and culture of patient-derived tumor organoids (PDTOs) and matched tumor-infiltrating lymphocytes (TILs) from human tumor specimens are well-established and widely published methodologies. Robust protocols describing mechanical and enzymatic tumor dissociation, 3D embedding in basement membrane matrix, long-term organoid expansion, and parallel isolation and ex vivo expansion of TILs have been extensively validated across multiple tumor types. These methods reliably preserve tumor cell heterogeneity, architecture, and immune specificity, and have been adapted in co-culture systems to evaluate tumor-immune interactions. Therefore, in this study, organoid and TIL isolation and expansion were performed according to previously published and validated protocols, with no substantive modifications unless otherwise noted.
Protocol
We performed all procedures involving human tumor tissue and tumor-infiltrating lymphocytes (TILs) in accordance with Institutional Review Board (IRB#1305013903) approval and institutional biosafety regulations and obtained written informed consent prior to tissue acquisition. The approving body was the Weill Cornell Medicine Institutional Review Board (listed as the Institutional Review Board (IRB), Weill Cornell Medicine, New York, NY), under protocol #1305013903. Specimens covered under this protocol include leftover tumor tissue obtained from standard-of-care surgeries or research procedures after routine pathologic assessment; existing archival frozen or formalin-fixed paraffin-embedded (FFPE) tissue from Weill Cornell Medical College or other institutions; blood, from which peripheral blood mononuclear cells (PBMCs), serum, and plasma are isolated and stored; buccal swabs, saliva, urine, or benign tissue used as controls in some cases; and, for participants enrolled in the Rapid Autopsy Program, tissue collected at autopsy performed within 6 h (up to 24 h) of death. TILs used in this study were expanded from the tumor tissue specimens described above. Personal identifiers were removed from all biospecimens, which were linked to participant identity only through a unique patient identification number in accordance with HIPAA and institutional standards; data were re-identified only at the time of report generation. All experiments were conducted under Biosafety Level 2 (BSL-2) conditions in a certified Class II biological safety cabinet. Biohazardous materials were disposed of according to institutional policy. See the Table of Materials and Supplemental File 1 for materials and preparation of buffers and media used in this work.
1. Fluorescent labeling and reconstitution of patient-derived tumor organoids (PDTOs) (Figure 1)
- Remove old Matrigel and initiate cell dissociation.
- Place the culture plate in the BSC. Carefully aspirate the media from the wells without disturbing the Matrigel droplets.
- Add 1–2 mL of room temperature cell dissociation enzyme per well. Pipette up and down repeatedly with a P1000 and a sterile cell scraper to completely break up Matrigel droplets.
- Transfer the cell mixture into the labeled 15 mL conical tube. Add an additional 1 mL of the cell dissociation enzyme to each well to wash residual cells and transfer to the same tube. Adjust the volume to ensure that at least 5 mL of enzyme per well is collected. Cap the tube and manually agitate to mix thoroughly.
- Enzymatic dissociation
- Place the tube in a 37 °C water bath. Incubate for 10 min and agitate the tube manually every 2–3 min to promote dissociation. Monitor visually for complete disaggregation.
- Once dissociated, centrifuge at 300 × g for 3 min at 4 °C. Inspect the tube after centrifugation.
- If no pellet forms and the Matrigel cloud remains, add additional cell dissociation enzyme. Shake and return to the water bath for 3–5 min. If the pellet still does not form, place the tube on ice for 3 min to allow the matrix to settle.
- Cell counting and viability assessment
- Aspirate the supernatant without disturbing the pellet. Add 10 mL of the +++ washing media.
- Centrifuge at 300 × g for 3 min at 4 °C. Resuspend the pellet in 1 mL of PBS. Triturate gently to obtain a single-cell suspension.
- Mix 15 µL of the cell suspension with 15 µL of 0.4% Trypan Blue. Load 10 µL per chamber of a counting slide. Count viable cells using an automated counter or hemocytometer.
- Maintain cells on ice during counting. Add a 6-well non-tissue, treated plate at 37 °C to warm up for later seeding.
- Fluorescent labeling of tumor cells
- Adjust cell concentration to 1 × 10⁶ viable cells/mL in PBS.
- Reconstitute CellTrace Far Red dye with 20 µL of DMSO to prepare a 1 mM stock solution. Vortex and centrifuge briefly.
- Add 1 µL of the 1 mM stock solution per 1 mL of cell suspension (1 × 10⁶ cells/mL), yielding a final staining concentration of 1 µM. Gently invert to mix. Incubate 30 min at 37 °C protected from light.
- Add 5 volumes of PBS to wash the dye. Centrifuge at 300 × g for 5 min. Wash twice with PBS.
- Assess labeling efficiency. A visibly colored cell pellet serves as the qualitative acceptance criterion.
- Determine poststaining viability by Trypan Blue exclusion and record the observed viability (80%).
NOTE: Advance cells to embedding only if the cell pellet demonstrates uniform coloration and poststaining viability is ≥80%.
- Creation of 3D cellular matrix suspension
- Resuspend the pellet in an appropriate volume of culture-specific media based on the pellet size (e.g., for 900,000 cells, add 500 µL of media; for 1.8 million cells, add 1,000 µL of media).
- Add chilled Matrigel at a 1:2 ratio (media:matrix) for a final of 67% Matrigel. Mix thoroughly but gently to avoid bubble formation (typical target: 300,000 cells per well of a 6-well plate).
- Plating 3D matrix droplets
- Using a 200 µL pipette, plate 100 µL droplets: 5 droplets per well in 6-well plates. Place plates in a 37 °C incubator for 5 min.
- Flip the plates upside down and incubate an additional 40 min for complete polymerization. Confirm the presence of embedded cells by microscopy.
- Add 4 mL of media per well (6-well plate) and return the plates to the incubator. Culture for 72 h to allow 100–300 µm organoid formation.
2. Preparation of organoids for killing assay
- Dissolve basement membrane matrix while preserving 3D organoid structure.
- Remove organoid plates from the incubator and transfer to a biosafety cabinet. Carefully aspirate the culture medium from each well without disturbing the Matrigel domes.
NOTE: Designate and leave one well untouched for full dissociation and tumor cell counting (see section 2.2). - Add 1 mL of ice-cold Cell Recovery Solution directly to each well to dissolve the basement membrane matrix. Mechanically disrupt the domes using a P1000 pipette and sterile cell scraper until the matrix is fully detached from the plate surface.
- Transfer the suspension from up to three wells into a prelabeled 15 mL conical tube kept on ice. Add an additional 8 mL of ice-cold Cell Recovery Solution to the tube. Place the tube horizontally on a rocker at 4 °C for 30 min to ensure complete matrix dissolution.
NOTE: Protect samples from light if fluorescent labeling has been performed. - After incubation, centrifuge at 300 × g for 3 min at 4 °C. Carefully aspirate the supernatant completely without disturbing the organoid pellet.
- Gently resuspend the pellet in complete PDTO medium using slow, wide-bore pipetting to maintain intact 3D organoid architecture.
CRITICAL: Avoid excessive pipetting or vertexing, which disrupts 3D structure.
If the residual matrix is visible after centrifugation, repeat incubation in cold Cell Recovery Solution for an additional 10–15 min. Re-centrifuge and reassess.
- Remove organoid plates from the incubator and transfer to a biosafety cabinet. Carefully aspirate the culture medium from each well without disturbing the Matrigel domes.
- Determine viable tumor cell number and adjust organoid suspension concentration.
- Fully dissociate the reserved well using the cell dissociation enzyme as described in Section 1. Incubate at 37 °C for 5–7 min with intermittent trituration.
- Neutralize with complete PDTO medium. Centrifuge at 300 × g for 5 min. Resuspend in 1 mL of medium.
- Mix 15 µL of cell suspension with 15 µL of 0.4% Trypan Blue. Count viable cells using a hemocytometer or an automated counter.
- Based on the viable cell count, calculate the required dilution to achieve 200,000 viable cells/mL in complete PDTO medium
NOTE: Example calculation: For a target of 20,000 tumor cells per well in 100 µL, 200,000 cells/mL working concentration is required. If seeding a full 96-well imaging plate (inner 60 wells), the required assay volume is 6 mL total (100 µL × 60 wells), but with 20% dead volume, prepare 7.2 mL. Therefore, the required number of cells is 6 mL × 200,000 cells/mL = 1.2 × 10⁶ cells and 7.2 mL × 200,000 cells/mL = 1.44 × 10⁶ cells.
- Plate organoids for killing assay
NOTE: Use black-walled, clear-bottom 96-well imaging plates. Plate each condition in at least three technical replicates.- Using a multichannel pipette, dispense 100 µL of organoid suspension per well to achieve 20,000 viable tumor cells per well.
- Fill the outermost wells of the plate with 200 µL of sterile PBS to minimize evaporation and edge effects.
- Visually confirm uniform distribution under the microscope.
- Allow organoids to settle at 37 °C for 10–30 min before T cell addition.
- Maintain continuous organoid expansion.
- Take the single-cell suspension generated during counting. Resuspend cells in culture-specific medium. Add chilled Matrigel to a final concentration of 67%.
- Plate into prewarmed 6-well suspension plates at 100,000 cells per well. Polymerize and overlay with media as described in Section 1. Return to the incubator for continued expansion.
3. Preparation of tumor-reactive T cells
- Expansion and collection of tumor-infiltrating lymphocytes (TILs)
- Isolate and expand TILs from tumor specimens using previously established protocols13,14.
- Record the following characteristics for each TIL preparation: postexpansion viability: ≥80% (Trypan Blue exclusion); CD3⁺ purity: ≥85%; CD4⁺/CD8⁺ distribution: ≥30% CD8⁺ T cells, with the CD4:CD8 ratio documented; expansion duration and culture conditions: 10–14 days in complete RPMI-1640 supplemented with 10% human AB serum and recombinant human IL-2 (600 IU/mL) under feeder-free conditions; activation/exhaustion phenotype: PD-1 ≤ 50%, TIM-3 ≤ 30%, and LAG-3 ≤ 20% of CD3⁺ cells at the time of assay; activation markers (e.g., CD69 or CD25) detectable following stimulation; evidence of tumor reactivity: measurable antigen-specific activity by at least one functional assay (e.g., increased IFN-γ production, CD137/4-1BB upregulation, CD107a degranulation, or cytotoxicity against autologous tumor cells).
- Confirm that each PDTO was co-cultured exclusively with its autologous TIL preparation.
NOTE: Prefer feeder-free expansion strategies to preserve CD8+ cytotoxic populations. Protocols using irradiated feeder PBMCs may skew expansion toward CD4+ T cells. Feeder-free systems better preserve CD8+ T cells.
Limit TIL expansion to a maximum of 14 days to avoid exhaustion phenotypes and loss of cytotoxic function. - On the day of the assay, collect T cells from culture flasks. Transfer cells to 15 mL conical tubes. Centrifuge at 300 × g for 3 min at room temperature. Aspirate supernatant completely.
- Prepare T cells for functional assay.
- Resuspend the pellet from step 3.1.4 in 1 mL of basic T-cell medium (RPMI 1640 + 10% FBS + 1% Pen/Strep).
NOTE: Ensure the media does not contain IL-2, IL-15, cytokines, anti-CD3/CD28 beads, or feeder cells.
CRITICAL: Residual cytokines or activation beads will artificially enhance cytotoxicity and confound assay interpretation. - Determine cell concentration and viability using Trypan Blue. Proceed only if viability ≥ 80%.
- Resuspend the pellet from step 3.1.4 in 1 mL of basic T-cell medium (RPMI 1640 + 10% FBS + 1% Pen/Strep).
- Prepare effector-to-target (E:T) ratios.
- Define E:T ratio as T cells:tumor cells.
NOTE: The tumor cell number used to calculate the E:T ratio is estimated from a fully dissociated reference well processed in parallel (Section 2.2). Because organoids are seeded as intact three-dimensional structures, tumor cell numbers cannot be determined directly within individual co-culture wells without disrupting the assay. The estimated tumor cell concentration obtained from the reference well is applied uniformly to all wells prepared from the same pooled organoid suspension.- For a 2:1 E:T ratio with 20,000 tumor cells per well, add 40,000 T cells per well. Prepare T cells at 400,000 cells/mL to deliver 100 µL per well; hence, 400,000 cells/mL × 0.1 mL = 40,000 cells.
- If seeding a full 96-well imaging plate (inner 60 wells), the required T-cell volume is 6 mL, and with 20% dead volume, the T-cell volume is 7.2 mL.
Required T cells:6 mL × 400,000 cells/mL = 2.4 × 10⁶ cells
7.2 mL × 400,000 cells/mL = 2.88 × 10⁶ cells
NOTE: The estimated E:T ratio is subject to inherent variability associated with three-dimensional organoid culture, including variation in organoid size (typically 100–300 µm in diameter), cell loss during Matrigel dissolution and washing (Section 2.1), and minor pipetting and cell-settling variation during plate preparation.
To minimize variability, plate a minimum of three technical replicates per condition, use wide-bore pipette tips and gentle resuspension to preserve organoid integrity, and visually confirm uniform organoid distribution across wells before addition of T cells (Section 2.3).
- Define E:T ratio as T cells:tumor cells.
- Prepare caspase-3 detection reagent.
- Use Caspase-3 substrate; stock concentration: 200 µM to prepare a working solution by adding the substrate directly to the T-cell suspension to achieve a 2 µM final concentration in the T-cell suspension. Mix gently.
NOTE: Protect from light at all times.
- Use Caspase-3 substrate; stock concentration: 200 µM to prepare a working solution by adding the substrate directly to the T-cell suspension to achieve a 2 µM final concentration in the T-cell suspension. Mix gently.
- Optional: Drug screening or immune modulation studies
NOTE: This assay may be adapted to evaluate small molecule inhibitors (e.g., kinase inhibitors, metabolic modulators), immune checkpoint inhibitors (e.g., anti-PD-1, anti-PD-L1), and combination therapies.- Pre-incubate the drugs with the organoids for 24–72 h prior to matrix dissociation and T cell addition, or add them simultaneously with T cells.
- Include vehicle-only controls for each condition.
- If testing immune checkpoint inhibitors, confirm expression of target (e.g., PD-L1) on organoids and PD-1 on T cells prior to assay.
4. Establish co-culture and experimental controls.
- Co-culture setup
- Remove the plated organoid 96-well imaging plate from the incubator and transfer it to the biosafety cabinet. Gently resuspend the prepared T-cell suspension (Section 3) immediately prior to plating to ensure homogeneous distribution (Figure 2A).
- Using a multichannel pipette, add 100 µL of T-cell suspension (containing the caspase substrate at 2 µM) to each well containing 100 µL of organoids. After addition, gently tap the plate 2–3 times to ensure even cell distribution.
NOTE: Avoid touching the bottom of the well to prevent disruption of organoids. Do not pipette up and down inside wells. Excessive agitation disrupts organoid integrity and alters T-cell infiltration kinetics. - Immediately transfer the plate to a live-cell imaging system to minimize temperature fluctuation.
NOTE: Final in-well concentrations after 1:1 mixing: combining 100 µL of organoid suspension (in Complete Organoid medium) with 100 µL of T-cell suspension (in basic T-cell medium) halves the concentration of every component. Final concentrations are: B27 Supplement 0.5X; Nicotinamide 5 mM; glutamine substitute 0.5X; Penicillin/Streptomycin 50 U/mL / 50 µg/mL; HEPES 5 mM; N-Acetylcysteine 0.625 mM; Primocin 50 µg/mL; FGF-Basic (FGF-2) 0.5 ng/mL; FGF-10 10 ng/mL; PGE2 0.5 µM; SB202190 5 µM; EGF 25 ng/mL; Y-27632 5 µM; A-83-01 250 nM; NRG1 5 ng/mL; Noggin and R-Spondin 5% v/v each; FBS (from T-cell medium) 5%; caspase-3 substrate 1 µM final in-well.- Configure kinetic acquisition in the live-cell imaging software by selecting Scan on Schedule to enable repeated imaging over the full assay duration (Figure 3B), choose Standard scan type for phase and fluorescence compatibility (Figure 3C), and specify Phase, Green, and Red channels at 10× with optimized per-channel acquisition times (Figure 3D).
- Set the per-channel fluorescence acquisition (exposure) time to approximately 300–400 ms for both the Green and Red channels, and confirm that the 10× objective is selected (image calibration 1.24 µm/px at 10×).
NOTE: The representative dataset was acquired on the referenced live-cell analysis system (see the Table of Materials). Image analysis was performed using the Basic Analyzer with a saved Analysis Definition (named red-green-overlap-Bladder). - Set the wells to acquire four images per inner well of the 96-well plate, with scans repeated every 2 h for up to 36 h (Figure 3A,E).
- Initiate image analysis by creating a new Analysis Definition and enabling Phase, Green, and Red channels (Figure 4A,B).
- Optimize red channel segmentation parameters, including area thresholds and edge exclusion filters, to isolate tumor objects from debris and doublets (Figure 4C).
- For the Red (tumor, CellTrace Far Red) channel, set Segmentation Type to Surface Fit with a Threshold of 2.0 RCU; enable Edge Split with Edge Sensitivity = 0; set Hole Fill = 0 µm2 and Adjust Size = 0 pixels; and apply a minimum object Area filter of 50 µm2 (no maximum-area, eccentricity, or intensity filters).
- For the Green (NucView 488 caspase-3/7) channel, create the green segmentation with Segmentation Type set to Surface Fit and a Threshold of 2.0 GCU; enable Edge Split with Edge Sensitivity = 0; set Hole Fill = 0 µm2 and Adjust Size = 0 pixels; and do not apply area or intensity filters.
- Define the apoptotic-tumor readout as Green + Red double-positive objects. Apply no additional area or intensity filters to the overlap. Validate the overlap criteria against the spontaneous-apoptosis and positive-killing control wells, then apply the analysis definition uniformly to all wells.
- Configure analysis metrics for both channels to quantify the proportion of red/green double-positive apoptotic objects; review the segmentation overlays to verify accurate tumor-object identification (Figure 4D).
- Select scan times and wells to cover all experimental timepoints (Figure 4E), and confirm that completed analyses are accessible for review and tabular or graphical data export (Figure 4F,G).
- Export the object-level and per-well analysis data (per timepoint) for downstream quantification.
Results
Tumor organoid cultures used for the results shown here were established and expanded beyond passage 5 and banked in more than 6 cryovials at 1 × 10⁶ cells per vial, with cultures re-expanded from thaw for each assay. Malignant epithelial identity and freedom from normal epithelial or stromal overgrowth were confirmed by targeted sequencing, which demonstrated retention of the somatic mutations present in the parental tumor, and by histological embedding, which showed organoid morphology concordant with the pathology of the original tumor; all lines were confirmed mycoplasma-negative prior to use. Cultures displaying normal epithelial morphology or failing to retain the parental tumor's molecular features were identified and excluded, thereby minimizing non-tumor contamination in the assay.
All results shown (Figure 1, Figure 2, Figure 3, Figure 4, and Figure 5) were generated from a single matched organoid-TIL pair derived from one patient with lung adenocarcinoma. The tumor specimen was obtained from a surgical resection performed without prior neoadjuvant treatment, and organoids were used at passage 21. Organoids were maintained in culture for approximately 12 weeks from initial isolation to the assay shown (passage 21). The date of tumor resection is considered protected health information and is therefore not reported.
Following re-expansion, PDTOs are recovered, counted, and plated in 96-well imaging plates. TILs are prepared in parallel at a 2:1 effector-to-target ratio with NucView 488 caspase-3 substrate added immediately before co-culture setup (Figure 2A). Representative images from a single well at an intermediate timepoint demonstrate the expected four-channel output: phase contrast confirms organoid and immune cell presence (Figure 2B); green fluorescence identifies caspase-3-activated apoptotic signal (Figure 2C); red fluorescence selectively marks CellTrace Far Red-labeled tumor organoids (Figure 2D); and the merged overlay reveals red/green double-positive apoptotic tumor objects, the primary assay readout (Figure 2E). Minimal spontaneous green signal within red-positive structures is expected in the absence of TIL-mediated killing. For quantification, red/green double-positive (apoptotic) organoids are expressed as the percent apoptotic PDTOs and plotted over time as mean ± SEM, with segmentation overlays confirming accurate tumor-structure identification (Figure 4D).
In a representative experiment testing six small molecules at 1 µM, Drug 4 and Drug 5 show elevated apoptosis relative to vehicle from approximately 24 h onward (Figure 5A; ** p < 0.01, *** p < 0.001, **** p < 0.0001); comparison within a single representative experiment. Violin plots at the 36 h endpoint provide a complementary view of the response distribution across replicates, showing that Drug 4 and Drug 5 produce the largest increases in apoptotic PDTOs in this representative experiment, whereas Drug 3 shows a nominally reduced killing response, consistent with possible immunosuppressive activity (Figure 5B).
To confirm that the measured apoptosis reflects tumor-infiltrating lymphocyte (TIL)-dependent killing rather than direct drug cytotoxicity or effector-cell-derived signal, a representative compound (Drug 5) was evaluated in three parallel arms, co-culture (TIL + organoid), organoid-only (no-TIL), and T-cell-only, over a 36 h time course (Figure 5C).
The co-culture arm showed progressive, time-dependent accumulation of apoptotic PDTOs, reaching 19.2 ± 1.0% by 36 h (mean ± SEM, n = 6 wells), whereas the organoid-only (no-TIL) arm remained low throughout, rising to only 4.0 ± 0.3% at 36 h (n = 3 wells), a 4.8-fold lower signal. The T-cell-only control remained at baseline across the entire time course (0.0%; n = 3 wells), consistent with only tumor organoids being fluorescently labeled and confirming that the readout does not originate from effector cells. Together, these arms isolate net, TIL-dependent apoptotic killing above the tumor-alone baseline. Because the organoid-only arm was acquired in the presence of the drug, it also serves as the drug-plus-tumor (no-TIL) control: with the drug present but no TILs, apoptosis remained low (4.0 ± 0.3% at 36 h), indicating that the elevated killing in the matched co-culture arm cannot be explained by direct organoid cytotoxicity for this compound. A matched drug-alone arm was generated for Drug 5 only; for the remaining compounds, the elevated apoptosis is therefore described as a combined effect that cannot yet be attributed specifically to immune enhancement, and a per-compound drug-alone control is identified as a required validation step.
All data supporting the findings of this study are available without restriction. The raw time-lapse image series, object-level export files, Incucyte Analysis Definition files, segmentation parameter settings, metadata, and the statistical source data underlying Figure 5 have been deposited in a public repository and are freely accessible under an open license doi: 10.5281/zenodo.21676769. The object-level source data, plate maps, segmentation settings, and analysis-definition file used to generate Figure 5 are provided in Supplemental File 2.
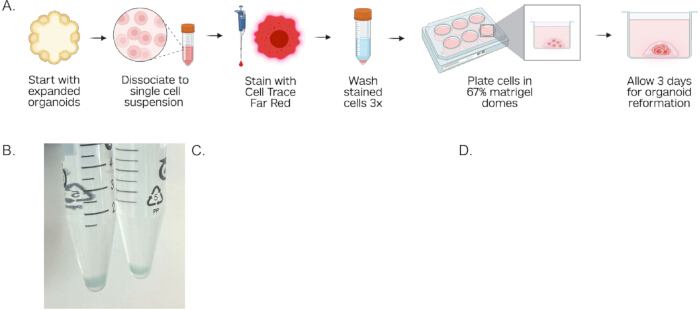
Figure 1: Fluorescent labeling and three-dimensional reconstitution of patient-derived tumor organoids. (A) Schematic overview of the PDTO preparation workflow: organoids are dissociated from Matrigel, dissociated to a single-cell suspension, labeled with CellTrace Far Red dye, resuspended in a Matrigel matrix, and plated as 3D droplets for 72 h re-expansion prior to the co-culture assay. (B) Representative photograph of labeled cell pellets in 15 mL tubes demonstrating visible coloration indicative of successful CellTrace Far Red staining. (C) Phase contrast image showing a Matrigel droplet containing re-expanded tumor organoids following 72 h culture. (D) Fluorescence overlay image showing red-labeled tumor organoids (CellTrace Far Red), confirming intact 3D organoid morphology and uniform fluorescent labeling prior to co-culture assay setup. Images were acquired at 10× magnification. Scale bars = 800 µm (C) and 400 µm (D). Abbreviation: PDTO = patient-derived tumor organoid. Please click here to view a larger version of this figure.
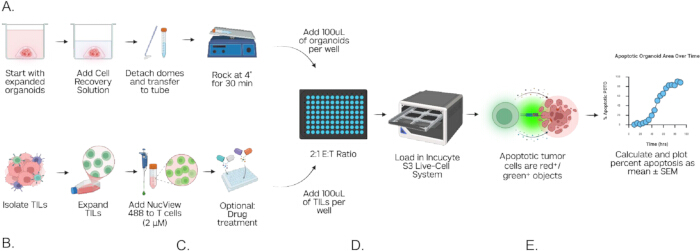
Figure 2. Co-culture assay workflow and representative fluorescence imaging of TIL-mediated tumor organoid killing. (A) Schematic of the full co-culture assay workflow depicting two parallel preparation streams: (upper path) organoid recovery from Matrigel, counting, and plating in 96-well imaging plates; (lower path) TIL expansion, resuspension, and addition with the caspase-3 substrate. Both streams converge at a co-culture setup in a 96-well plate loaded into the live-cell imaging system for kinetic acquisition and automated analysis. Representative images from a co-culture well at a single timepoint: (B) phase contrast, (C) green fluorescence channel showing caspase-3-activated NucView 488 signal in apoptotic cells, (D) red fluorescence channel showing CellTrace Far Red-labeled tumor organoids, and (E) merged fluorescence overlay demonstrating red/green double-positive apoptotic tumor objects. Images were acquired at 10× magnification. Scale bar = 400 µm. Abbreviation: TIL = tumor-infiltrating lymphocyte. Please click here to view a larger version of this figure.
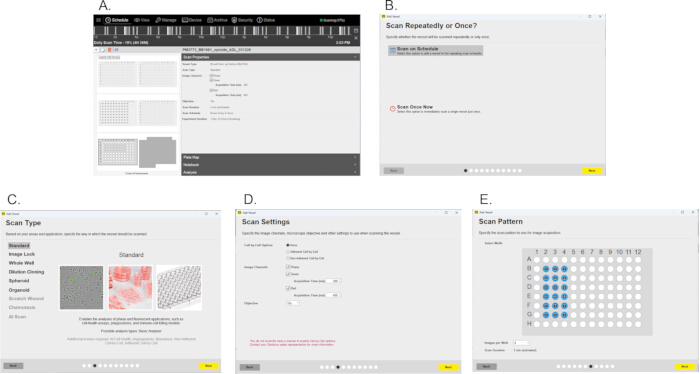
Figure 3. Instrument scanning setup and acquisition parameter configuration for live-cell imaging. (A) Instrument scheduling dashboard showing an active scan with plate map and scan properties including vessel type, image channels, objective, scan duration, and acquisition schedule. (B) Scan Repeatedly or Once? dialog with Scan on Schedule selected to enable longitudinal kinetic imaging over the full assay duration. (C) Scan type selection panel with Standard mode chosen, supporting phase contrast and fluorescence-based analysis applications. (D) Scan settings panel specifying image channels (Phase, Green, Red), per-channel acquisition times, and 10× objective selection. (E) Scan pattern panel showing well selection for the inner wells of a 96-well plate configured for four images per well with an estimated scan duration. Please click here to view a larger version of this figure.
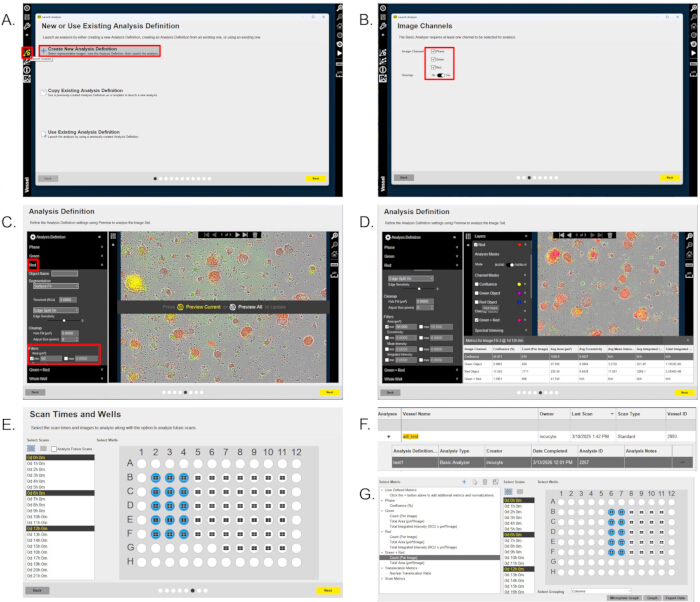
Figure 4. Live-cell imaging instrument setup and image analysis workflow using integrated software. (A) Analysis launch interface showing selection of Create New Analysis Definition to initiate a new analysis pipeline. (B) Image channel selection panel with Phase, Green, and Red channels enabled for dual-fluorescence acquisition. (C) Analysis Definition interface displaying red channel segmentation parameters, including minimum and maximum area thresholds, edge exclusion, and debris filters used to identify tumor objects. (D) Analysis Definition interface showing configured analysis metrics for both green and red channels with a representative segmentation overlay confirming accurate identification of red/green double-positive apoptotic tumor structures. (E) Scan time and well selection interface used to schedule repeated image acquisition across the inner wells of the 96-well imaging plate. (F) Select completed analysis definition under image file. (G) Completed analysis summary view displaying vessel information, analysis type, available metrics, and data export options, including microplate graph, graph, and tabular export. Please click here to view a larger version of this figure.
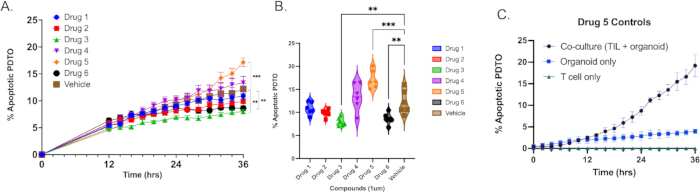
Figure 5. Representative analysis of small molecule drug effects on TIL-mediated tumor organoid killing. (A) Kinetic killing curves showing percent apoptotic PDTOs over time compared across multiple small molecule treatment conditions and vehicle control, presented as mean ± SEM. (B) Violin plots illustrating endpoint analysis at 36 hours as an alternative graphical approach to visualize the distribution of apoptotic responses across treatment conditions, enabling descriptive comparison between drug-treated and vehicle control co-cultures within this representative experiment. (C) TIL-dependence controls for a representative compound (Drug 5): percent apoptotic PDTOs over a 36 h time course for the co-culture (TIL + organoid), organoid-only (no-TIL), and T-cell-only arms, confirming that the apoptotic signal is TIL-dependent and does not arise from effector cells (co-culture n = 6 wells; organoid-only and T-cell-only n = 3 wells; mean ± SEM). Abbreviations: PDTO = patient-derived tumor organoid; TIL = tumor-infiltrating lymphocyte; SEM = standard error of the mean. Please click here to view a larger version of this figure.
Supplemental File 1: Preparation of media and buffers. Please click here to download this file.
Supplemental File 2. Source data and analysis files for Figure 5. This ZIP folder contains the object-level source data, plate maps, segmentation settings, and analysis-definition file used to generate the Figure 5 compound-screen and Drug 5 control analyses. Please click here to download this file.
Discussion
This protocol describes an image-based live-cell imaging protocol to evaluate cytotoxic interactions between patient-derived tumor organoids (PDTOs) and matched tumor-infiltrating lymphocytes (TILs). By integrating three-dimensional tumor architecture, autologous immune effectors, and real-time caspase-3 activation measurements, this system enables dynamic assessment of tumor cell apoptosis under physiologically relevant conditions. The workflow combines established organoid and TIL expansion methods with controlled co-culture conditions and automated image-based quantification, providing an image-based approach for immune functional studies. Because the upstream PDTO and TIL isolation and expansion steps are performed according to previously published protocols rather than described in full here, complete reproduction of this workflow requires consulting those source references in addition to this protocol.
A key strength of this approach is the preservation of tumor-intrinsic heterogeneity within organoids. Unlike two-dimensional monolayer systems, organoids maintain three-dimensional structure and tumor cell-cell interactions. When co-cultured with matched TILs, this permits the evaluation of T cell infiltration, contact-dependent killing, and kinetic responses over time. The use of a caspase-3 activated fluorescent substrate enables direct measurement of apoptosis rather than relying on indirect surrogates such as confluence loss or ATP-based endpoint viability assays.
Several critical parameters determine experimental success. Organoid integrity at plating is essential; over-digestion during initial tumor dissociation or excessive mechanical disruption during co-culture setup may fragment organoids, artificially increasing red object counts and altering apoptosis calculations. Consistent organoid size distribution improves segmentation accuracy and reduces well-to-well variability. Accurate effector-to-target (E:T) ratios must likewise be maintained across replicates, as inaccurate T-cell counting or clumping introduces variability in killing kinetics. Gentle resuspension immediately prior to plating minimizes this issue. Only a single E:T ratio (2:1) was evaluated in the representative dataset shown, consistent with the standard operating parameter established in our laboratory's protocol. Higher E:T ratios are generally expected to increase tumor killing based on established T-cell cytotoxicity literature, and formal titration of this parameter remains a direction for future validation of this platform. The selection and validation of segmentation parameters represent another crucial step. Thresholds for minimum and maximum object size must exclude debris while capturing intact tumor structures; overly permissive thresholds inflate tumor counts, whereas overly restrictive thresholds underestimate tumor burden. Overlap criteria for red and green signals must be validated using both spontaneous apoptosis controls and positive killing controls, and must be applied consistently across all wells to avoid bias in percent apoptosis calculations.
The inclusion of appropriate controls strengthens interpretability. Tumor-only wells establish baseline red fluorescence stability, while tumor-plus-substrate controls quantify spontaneous apoptosis independent of immune activity. T-cell-only controls determine the background caspase signal arising from dying lymphocytes. Positive apoptosis controls confirm substrate functionality and validate segmentation thresholds. These controls are particularly important when comparing independent tumor-TIL pairs, as baseline apoptotic rates can vary between organoid lines.
This imaging-based platform offers several advantages over traditional cytotoxicity assays, such as chromium release or endpoint ATP-based viability measurements. Real-time imaging enables continuous, non-destructive monitoring of tumor-immune interactions, allowing precise kinetic resolution of immune-mediated killing. Unlike endpoint assays, which provide only a single cumulative measurement and may obscure transient or sequential cytotoxic events, longitudinal imaging distinguishes rapid early cytotoxic responses from delayed or progressive apoptosis. This temporal resolution permits identification of lag phases associated with T-cell activation or infiltration, peak killing intervals, and plateau phases that may reflect T-cell exhaustion or target-cell resistance. Repeated measurements from the same well reduce inter-sample variability and eliminate the need for parallel plates at multiple time points. Because tumor burden and apoptotic conversion are quantified simultaneously at each interval, dynamic normalization is possible, improving accuracy compared to bulk lysis assays that cannot discriminate immune killing from spontaneous cell death. Collectively, this approach provides a more physiologically informative and mechanistically interpretable assessment of cytotoxic function than traditional single-timepoint assays.
However, several limitations should be considered. Although patient-derived tumor organoids more closely recapitulate native tumor architecture than conventional two-dimensional cultures, they do not fully model the stromal, vascular, or myeloid components of the tumor microenvironment. In addition, imaging at 10× magnification provides sufficient throughput for longitudinal analysis but may not resolve single-cell interactions within densely packed organoids. Higher-magnification imaging can improve spatial resolution but reduces the field of view and assay throughput. This assay specifically quantifies caspase-3-dependent apoptotic death of tumor cells. T-cell-mediated cytotoxicity occurring through caspase-independent mechanisms, including necrosis or necroptosis, is not detected by this readout and should therefore be interpreted within the scope of the assay. In addition, single-cell dissociation, labeling, and 72 h re-expansion could, in principle, select for subpopulations; the 100–300 µm structures that re-form over this period nonetheless retain the multicellular three-dimensional architecture of the parental organoids, and no overt morphological change was observed relative to the parental cultures, although a formal comparison of clonal composition before and after re-expansion was not performed. The present study does not include a pharmacologic positive-control benchmark, such as an immune checkpoint inhibitor (e.g., anti-PD-1) in a PD-L1⁺/PD-1⁺ organoid–TIL pair, with the expected enhancement of killing, to formally calibrate the assay's dynamic range; inclusion of such a reference immune-enhancing agent is an important next validation step, and the comparative compound results reported here should be interpreted accordingly. A matched drug-alone (no-TIL) control was performed only for Drug 5 in these examples; relative enhancement in cell death cannot be ascribed to the other compounds, which lack a per-compound drug-alone control. Orthogonal, same-sample validation of this image-based readout against an independent gold-standard measure of cell death, such as flow-cytometric Annexin V staining or confocal single-cell confirmation, was not performed here and is identified as a key next step to further establish the specificity of the red/green double-positive readout17.
An additional consideration is that CellTrace Far Red fluorescence is progressively diluted with each round of tumor cell division. Consequently, proliferation during the 72 h organoid recovery period and subsequent imaging window may reduce fluorescence intensity at later time points, potentially decreasing the number of detectable CellTrace-positive tumor objects and modestly increasing the calculated percentage of apoptosis through a reduced denominator. To monitor this potential confounder, the number of CellTrace Far Red-positive objects was tracked longitudinally throughout the imaging period, and wells were evaluated for substantial declines in red-positive signal independent of apoptosis-associated caspase-3/7 activation. No significant unexplained loss of CellTrace-positive objects was observed over the imaging window, suggesting that dye dilution was unlikely to be a major contributor to the observed changes in apoptotic measurements. However, this remains an inherent limitation of fluorescence dilution-based tumor cell tracking and should be considered when interpreting late time-point measurements.
Biological variability between patient-derived samples represents both the strength and a challenge of this assay platform. While this variability reflects clinically relevant tumor heterogeneity, appropriate experimental design should account for biological variation when defining study size and replication requirements. Each unique tumor–TIL pair should be considered an independent biological replicate, whereas technical replicates are used to assess within-sample assay variability. The representative dataset shown in Figure 5 reflects a single organoid–TIL pair analyzed in technical triplicate; therefore, the two-way repeated-measures ANOVA presented describes assay variability within that individual sample and should not be interpreted as an assessment of inter-patient biological variability. The number of independent organoid–TIL pairs required for each study should be determined using prospective power calculations based on the expected effect size, biological variability, and experimental objectives. Technical replicates should be included to quantify assay precision, but should not be considered substitutes for independent biological replicates
Future modifications of this protocol may incorporate immune checkpoint blockade, cytokine modulation, small-molecule inhibitors, or genetic perturbations to dissect the mechanisms that regulate T-cell-mediated cytotoxicity. Integration with single-cell transcriptomics or spatial imaging could further enhance mechanistic insight. Additionally, adaptation to high-throughput 384-well formats may enable drug screening applications. This platform is also readily adaptable for evaluating chimeric antigen receptor T-cell (CAR-T) therapies in place of polyclonal TILs, requiring only confirmation of target antigen expression on PDTOs prior to co-culture and appropriate inclusion of antigen-negative organoid controls to confirm on-target specificity18,19,20.
In summary, this protocol provides a quantitative, image-based method to measure TIL-mediated cytotoxicity against autologous tumor organoids in real time. Careful attention to organoid integrity, consistent effector ratios, validated segmentation thresholds, and appropriate controls ensures reliable quantification. This system is broadly applicable to studies of tumor immunology, immune checkpoint modulation, adoptive cell therapy optimization, and personalized functional immune profiling.
Disclosures
B.D.H. is Co-Founder of and consultant for Faeth Therapeutics. O.E. owns equity in Volastra Therapeutics and Owkin, but this has no relation to this project. Neither Faeth Therapeutics, Volastra Therapeutics, nor Owkin provided funding, materials, equipment, software, intellectual property, or study-design input for this work. The remaining authors declare no competing interests.
AI-USE DISCLOSURE:
During the preparation of this work, the author(s) used Claude for language editing. After using this tool/service, the author(s) reviewed and edited the content as needed and take(s) full responsibility for the content of the published article.
Acknowledgements
We gratefully acknowledge the Englander Institute for Precision Medicine at Weill Cornell Medicine, for their generous support and access to institutional resources. This work was also supported by MERIT Program Gift / The Medical Excellence Foundation, Inc. (award# 61500857), awarded to Olivier Elemento and Benjamin D. Hopkins. The funder had no role in study design, data collection, analysis, or manuscript preparation. The Noggin- and R-Spondin-secreting HEK293T producer lines were a kind gift from the laboratory of Yu Chen (Memorial Sloan Kettering Cancer Center) and were generated as described previously21.
Materials
| Name | Company | Catalog Number | Comments |
|---|---|---|---|
| 15 mL Conical Tubes | Corning | 430791 | Cell collection and centrifugation |
| 6-Well Non-Tissue Culture Treated Plates | Greiner Bio-One | 657185 | 3D organoid plating and expansion |
| A-83-01 (TGF-beta inhibitor) | Tocris Bioscience | 2939 | Complete Organoid Medium |
| Advanced DMEM/F12 | Thermo Fisher Scientific | 12634010 | Media Component |
| B27 Supplement (50X), serum-free | Thermo Fisher Scientific | 17504044 | Complete Organoid Medium |
| Black-Walled, 96-Well Optical-Bottom Microplate, black, TC surface | Nunc | 165305 | Live-cell imaging plate for killing assay |
| Cell Recovery Solution | Corning | 354253 | Cold dissolution of Matrigel while preserving 3D organoid structure |
| CellTrace Far Red Cell Proliferation Kit | Thermo Fisher Scientific | C34564 | Fluorescent labeling of tumor cells (red channel) |
| Class II Biosafety Cabinet | Thermo Fisher Scientific | 1375 (1300 Series A2, 4 ft) | Aseptic handling under BSL-2 |
| CO2 Incubator (37 °C, 5% CO2, humidified) | Thermo Fisher Scientific | 51030400 (Heracell VIOS 160i) | Organoid expansion and co-culture incubation |
| Countess 3 Automated Cell Counter | Thermo Fisher Scientific (Invitrogen) | AMQAX2000 | Automated cell counting/viability (used with Countess slides, C10312) |
| Countess Counting Slides (or hemocytometer) | Thermo Fisher Scientific | C10312 | Automated cell counting |
| Dimethyl Sulfoxide (DMSO), sterile | Sigma-Aldrich | D2650 | Reconstitution of CellTrace Far Red dye |
| Dulbecco's Phosphate-Buffered Saline (PBS), 1X, without Ca2+/Mg2+ | Corning | 21-040-CVR | Cell resuspension for counting and dye labeling |
| Fetal Bovine Serum (FBS), heat-inactivated | Thermo Fisher Scientific | 16140071 | Media Component |
| GlutaMAX-I Supplement (100X) | Thermo Fisher Scientific | 35050061 | Media Component |
| GraphPad Prism (v10.6.1) | GraphPad Software / Dotmatics | Version 10.6.1 | Statistical analysis (two-way RM ANOVA) and plotting |
| HEK293T Producer Cell Lines (Noggin- and R-Spondin-secreting) | Yu Chen Lab, Memorial Sloan Kettering Cancer Center (MSKCC) | Gift (see Gao et al., Cell 2014) | Conditioned-medium production (Section 0.2); kind gift from the Yu Chen Lab (MSKCC); generated as in Gao et al., Cell 2014, DOI: 10.1016/j.cell.2014.08.016 |
| HEPES (1 M solution) | Thermo Fisher Scientific | 15630080 | Media Component |
| Human Recombinant FGF-10 | Thermo Fisher Scientific | PHG0204 | Complete Organoid Medium |
| Human Recombinant FGF-Basic (FGF-2) | Thermo Fisher Scientific | PHG0261 | Complete Organoid Medium |
| Incucyte Base Software (v2024B) | Sartorius | Integrated software v2024B | Image acquisition scheduling and automated segmentation/analysis |
| Incucyte S3 Live-Cell Analysis System | Sartorius | 4647 | Live-cell imaging instrument (37 °C, 5% CO2); phase + dual-fluorescence acquisition |
| Inverted Phase-Contrast / Fluorescence Microscope | Nikon | Eclipse Ts2-FL | Organoid QC and visual segmentation confirmation |
| Laboratory Freezer (−20 °C / −80 °C) | Thermo Fisher Scientific | TSX40086A (TSX Series −86 °C) | Storage of growth-factor and conditioned-media aliquots |
| Laboratory Rocker / Rocking Platform (4 °C compatible) | Benchmark Scientific | B3D2300 (BenchRocker 3D) | Matrix dissolution in cold Cell Recovery Solution (Section 2.1) |
| Matrigel Basement Membrane Matrix, Growth Factor Reduced | Corning | 356231 | 3D matrix for organoid embedding and expansion |
| Mouse Recombinant EGF | PeproTech | 315-09 | Complete Organoid Medium |
| N-Acetylcysteine | Sigma-Aldrich | A9165 | Complete Organoid Medium |
| Nicotinamide | Sigma-Aldrich | N0636 | Complete Organoid Medium |
| Noggin (conditioned media or recombinant) | Lab-prepared aliquot | — | Complete Organoid Medium |
| NRG1 (Neuregulin-1 / Heregulin) | R&D Systems | 396-HB | Complete Organoid Medium |
| NucView 488 Caspase-3 Substrate (200 µM stock) | Biotium | 30029 | Real-time detection of caspase-3 activation (apoptosis readout, green channel) |
| Penicillin-Streptomycin Solution (100X) | Thermo Fisher Scientific | 15140122 | Media Component |
| PGE2 (Prostaglandin E2) | Sigma-Aldrich | P0409 | Complete Organoid Medium |
| Primocin | InvivoGen | ant-pm-1 | Complete Organoid Medium |
| Refrigerated Centrifuge (swinging-bucket, 300 × g, 4 °C) | Eppendorf | 022628187 (Centrifuge 5810 R, A-4-62 rotor) | Dissociation and wash centrifugation steps |
| RPMI 1640 Medium | Thermo Fisher Scientific | 11875093 | Base medium for T-cell resuspension |
| R-Spondin (conditioned media or recombinant) | Lab-prepared aliquot | — | Complete Organoid Medium |
| SB202190 (p38 MAPK inhibitor) | Sigma-Aldrich | S7076 | Complete Organoid Medium |
| Staurosporine | Sigma-Aldrich | S4400 | Positive killing control; pro-apoptotic agent to confirm caspase substrate functionality |
| Stericup Sterile Vacuum Filtration System (0.22 µm) | MilliporeSigma (Merck) | S2GPU05RE | Filtration/production of Noggin and R-Spondin conditioned media (Section 0.2) |
| Sterile Cell Scraper | Corning | 3008 | Mechanical disruption of Matrigel domes |
| Trypan Blue Solution, 0.4% | Thermo Fisher Scientific | 15250061 | Viability assessment via dye exclusion |
| TrypLE Express Enzyme (1X) | Thermo Fisher Scientific | 12604021 | Enzymatic dissociation of Matrigel and organoids |
| Water Bath (37 °C) | Thermo Fisher Scientific | TSGP05 (Precision GP 05) | Enzymatic dissociation and media warming |
| Y-27632 (ROCK Inhibitor) | Sigma-Aldrich | Y0503 | Complete Organoid Medium |
References
- Reck M, et al. Pembrolizumab versus chemotherapy for PD-L1-positive non-small-cell lung cancer. N Engl J Med. 2016;375(19):1823-33.
- Larkin J, et al. Overall survival in patients with advanced melanoma who received nivolumab versus investigator’s choice chemotherapy in CheckMate 037: a randomized, controlled, open-label phase III trial. J Clin Oncol. 2018;36(4):383-90.
- Weber J, et al. Adjuvant nivolumab versus ipilimumab in resected stage III or IV melanoma. N Engl J Med. 2017;377(19):1824-35.
- Karimi MA, et al. Measuring cytotoxicity by bioluminescence imaging outperforms the standard chromium-51 release assay. PLoS One. 2014;9(2):e89357.
- Kaja S, Payne AJ, Naumchuk Y, Koulen P. Quantification of lactate dehydrogenase for cell viability testing using cell lines and primary cultured astrocytes. Curr Protoc Toxicol. 2017;72:2.26.1-2.26.10.
- Crouch SPM, Kozlowski R, Slater KJ, Fletcher J. The use of ATP bioluminescence as a measure of cell proliferation and cytotoxicity. J Immunol Methods. 1993;160(1):81-8.
- Pauli C, et al. Personalized in vitro and in vivo cancer models to guide precision medicine. Cancer Discov. 2017;7(5):462-77.
- Lee SH, et al. Tumor evolution and drug response in patient-derived organoid models of bladder cancer. Cell. 2018;173(2):515-28.e17.
- Dijkstra KK, et al. Challenges in establishing pure lung cancer organoids limit their utility for personalized medicine. Cell Rep. 2020;31(5):107588.
- Veninga V, Voest EE. Tumor organoids: opportunities and challenges to guide precision medicine. Cancer Cell. 2021;39(9):1190-201.
- Wang HM, et al. Using patient-derived organoids to predict locally advanced or metastatic lung cancer tumor response: a real-world study. Cell Rep Med. 2023;4(2):100911.
- Betge J, et al. The drug-induced phenotypic landscape of colorectal cancer organoids. Nat Commun. 2022;13(1):3135.
- Dijkstra KK, et al. Generation of tumor-reactive T cells by co-culture of peripheral blood lymphocytes and tumor organoids. Cell. 2018;174(6):1586-98.e12.
- Cattaneo CM, et al. Tumor organoid-T-cell coculture systems. Nat Protoc. 2020;15(1):15-39.
- Votanopoulos KI, et al. Model of patient-specific immune-enhanced organoids for immunotherapy screening: feasibility study. Ann Surg Oncol. 2020;27(6):1956-67.
- Harter MF, et al. Analysis of off-tumour toxicities of T-cell-engaging bispecific antibodies via donor-matched intestinal organoids and tumouroids. Nat Biomed Eng. 2024;8(4):345-60.
- Gelles JD, Chipuk JE. Robust high-throughput kinetic analysis of apoptosis with real-time high-content live-cell imaging. Cell Death Dis. 2016;7(12):e2493.
- Schnalzger TE, et al. 3D model for CAR-mediated cytotoxicity using patient-derived colorectal cancer organoids. EMBO J. 2019;38(12):e100928.
- Ehlen L, et al. Lung tumouroids as a testing platform for precision CAR T cell therapy. Nat Biomed Eng. 2026;10:815-31.
- Logun M, et al. Patient-derived glioblastoma organoids as real-time avatars for assessing responses to clinical CAR-T cell therapy. Cell Stem Cell. 2025;32(2):181-90.e4.
- Gao D, et al. Organoid cultures derived from patients with advanced prostate cancer. Cell. 2014;159(1):176-87.
Reprints and Permissions
This article has been published
Video Coming Soon