This study integrates network pharmacology, molecular docking, and molecular dynamics (MD) simulation to elucidate core active components and therapeutic targets of Kongsheng Zhenzhong Dan (KSZZD) in autism spectrum disorder (ASD), identifies key binding residues via alanine scanning, and validates effects in a valproic acid-induced ASD rat model.
Research Article
Mechanism of Kongsheng Zhenzhong Dan In Autism-Related Pathways: A Study Based On Network Pharmacology, Molecular Docking, And Experimental Validation
Opens in a new tab
In This Article
Summary
Loading...
$$\rightleftharpoonup{xx}$$
$$\longleftharp{xx}$$,
$$\longrightharp{xx}$$,
Abstract
Loading...
$$\rightleftharpoonup{xx}$$
$$\longleftharp{xx}$$,
$$\longrightharp{xx}$$,
Autism spectrum disorder (ASD) is a complex neurodevelopmental disorder, and its pathogenesis is closely associated with chronic neuroinflammation. As a classic traditional Chinese medicine (TCM) formula, Kongsheng Zhenzhong Dan (KSZZD) is used for neurodevelopmental and memory disorders because of its reported neuroprotective effects, but its specific molecular mechanism in ASD remains unclear. This study integrates network pharmacology, molecular docking analysis, and MD simulation to systematically elucidate the core active components and candidate therapeutic targets of KSZZD for ASD at both the systemic and atomic levels. Subsequently, key binding residues are identified by alanine flexible scanning, and the biological effects are assessed using a valproic acid (VPA)-induced ASD rat model. Network pharmacology analysis revealed that quercetin, a key component in KSZZD, may act partly by regulating the TNF-α-mediated inflammatory signaling pathway. Molecular docking results showed that the binding energies of the core components of KSZZD to their targets were all lower than -5.0 kcal/mol, among which quercetin exhibited the strongest binding affinity to TNF (-8.52 kcal/mol). MD simulation suggested that quercetin could maintain stable binding to the active pocket of TNF-α, and alanine scanning further identified GLU104 and GLN102 as key amino acid residues for maintaining the structural stability of the complex. In vivo experiments demonstrated that quercetin intervention significantly improved locomotor and exploratory behaviors in VPA-induced ASD rats, and effectively reduced TNF-α expression levels in serum and brain tissue. These findings suggest that quercetin may contribute to the predicted effects of KSZZD, at least in part, through inhibition of the TNF-α signaling pathway.
Introduction
Loading...
$$\rightleftharpoonup{xx}$$
$$\longleftharp{xx}$$,
$$\longrightharp{xx}$$,
Autism Spectrum Disorder (ASD) is a complex neurodevelopmental disorder characterized by impaired social communication, restricted interests, and repetitive stereotyped behaviors1. The pathological mechanism of ASD is highly complex, involving the interplay of genetic variations, epigenetic regulation, and environmental factors, which ultimately leads to impaired synaptic plasticity and abnormal neural circuit connectivity2,3. Chronic inflammation in the central nervous system (CNS) plays a central role in the pathogenesis of ASD, and interventions targeting neuroinflammation have emerged as promising therapeutic strategies.
Kongsheng Zhenzhong Dan (KSZZD), a classic TCM formula, was first recorded in Essential Prescriptions Worth a Thousand Gold for Emergencies. It consists of four medicinal herbs: Tortoise Carapace, Os Draconis, Polygalae Radix, and Acori Tatarinowii Rhizoma. KSZZD is traditionally used to tonify the heart and kidney, tranquilize the mind, and stabilize the spirit. Clinically, it is commonly used to treat intellectual developmental delay and memory impairment4. Modern pharmacological studies have suggested that KSZZD and its active components exert neuroprotective, anti-inflammatory, and antioxidant effects, and may improve learning, memory, and anxiety-like behaviors in neurodevelopmental disorder models5. Our phytochemical analysis revealed that quercetin and other flavonoids are the key active components of this formula, which can penetrate the blood-brain barrier and exhibit significant anti-inflammatory activity6. However, the mechanism by which these active components mediate the therapeutic effects of KSZZD in ASD remains poorly understood.
With the rapid development of computational biology, techniques such as network pharmacology, molecular docking, molecular dynamics simulation, and quantum chemistry calculation have provided powerful tools for elucidating the interactions between active components of traditional Chinese medicine and disease targets at the atomic level7,8,9,10,11. By integrating heterogeneous data sources, network pharmacology enables the construction of a complex, interactive "component-target-pathway" network from a systems biology perspective, thereby preliminarily identifying key biological nodes for traditional Chinese medicine intervention in diseases.
On this basis, molecular docking can be further used to simulate the geometric matching and energy fitting between components and target proteins, and predict their binding modes and potential activities. Subsequently, a molecular dynamics (MD) simulation is performed to investigate the structural fluctuation and binding stability of the complex under aqueous and physiological conditions. Combined with alanine scanning, site‑directed mutagenesis simulation is applied to accurately locate the core hot‑spot residues responsible for maintaining binding affinity, and to clarify the contribution weight of the pharmacophore at the amino acid level. Finally, verification based on well‑designed pharmacological experiments can effectively reveal the molecular mechanism underlying the therapeutic effects of traditional Chinese medicine compounds on specific diseases.
Accordingly, this study first aims to screen the core components and targets of KSZZD in the treatment of ASD via network pharmacology. Subsequently, combined with molecular docking, molecular dynamics simulation, and alanine flexible scanning, the “hot‑spot residues” maintaining complex stability will be identified, and the dynamic interaction pattern between quercetin and TNF‑α will be evaluated. Finally, the computational results will be experimentally verified in a VPA‑induced ASD rat model using assessments of animal behavior, brain histopathology, and inflammatory factor expression levels. This study aims to explore potential mechanisms by which KSZZD-derived components may affect autism-related inflammatory pathways from a multi-scale perspective, providing a basis for further investigation of traditional Chinese medicine interventions in neurodevelopmental disorders.
Protocol
Loading...
$$\rightleftharpoonup{xx}$$
$$\longleftharp{xx}$$,
$$\longrightharp{xx}$$,
Network pharmacology analysis
"Autism" was used as the keyword to search the GeneCards database (https://www.genecards.org/) for autism-related targets12,13,14. Targets retrieved from the databases were merged after duplicate entries were removed. Known targets of active components not captured by database predictions were supplemented based on literature reports15. The disease targets and potential targets of drug components were uniformly standardized to Gene Symbols using the UniProt protein database (https://www.uniprot.org/), and these two target sets were mapped to identify the potential therapeutic targets of KSZZD for autism16.
Based on the Traditional Chinese Medicine Systems Pharmacology Database and Analysis Platform (TCMSP, http://lsp.nwu.edu.cn/tcmsp.php), the potential bioactive compounds in KSZZD and their corresponding targets were screened out in accordance with the criteria of oral bioavailability (OB ≥ 0.30) and drug-likeness index (DL ≥ 0.18)17. The SMILES identifiers of the compounds were retrieved from the PubChem database (https://pubchem.ncbi.nlm.nih.gov/), and Swiss Target Prediction (http://swisstargetprediction.ch/) was further employed to explore the potential targets not included in the TCMSP platform18. Subsequently, the HERB database (http://herb.ac.cn) was used for supplementary screening in accordance with the Lipinski's Rule of Five, with the criteria as follows: molecular weight (MW ≤ 500 Da), octanol-water partition coefficient (AlogP ≤ 5), number of hydrogen bond donors (Hdon ≤ 5), number of hydrogen bond acceptors (Hacc ≤ 10), and number of rotatable bonds (RBN ≤ 10). Then, target screening was performed using the BATMAN-TCM database (http://bionet.ncpsb.org.cn/batman-tcm/) with the following criteria: score cut-off (≥0.84), druggability score (≥0.10), and P value (≤0.05). Finally, the UniProt database (https://www.uniprot.org) was employed to convert the selected target names into standard Gene Symbols.
The overlapping targets between the drug targets and autism targets were identified using the online Draw Venn Diagram tool (http://bioinformatics.psb.ugent.be). These overlapping targets were imported into the STRING database (https://string-db.org/) to construct a protein-protein interaction (PPI) network19. The species was set to Homo sapiens, and protein-protein interactions with confidence scores below 0.40 were filtered out. The resulting network was imported into Cytoscape 3.10.0 software for visual analysis16, where drugs, compounds, and targets were represented by red diamonds, blue circles, and green triangles, respectively, and the edge weights reflected the degree centrality of the nodes. The CytoNCA plugin was then used to calculate degree centrality values, rank the core compounds, and identify the main core compounds. Bioinformatics enrichment analysis of the target genes was performed using the Metascape platform20, including GO analysis (biological process, BP; molecular function, MF; cellular component, CC) and KEGG pathway analysis.
Molecular docking
The autism-related receptor proteins identified above were preprocessed before docking by repairing missing residues, optimizing the protonation state, and removing crystal water molecules to maintain receptor structural integrity. The semi-flexible docking method in the CDOCKER module21 was then employed. Residues within 10 Å of the co-crystal ligand were defined as the active pocket, and ligand-receptor binding was simulated within this region.
Docking results were assessed using CDOCKER Interaction Energy as the key index, with lower energy values indicating more stable predicted binding between the ligand and receptor. The reliability of the docking mode was evaluated by comparing the spatial binding conformation of the core component with that of the co-crystal ligand in the active pocket. The complex with the optimal binding energy and strongest interaction was selected as the initial conformation for the subsequent molecular dynamics simulation.
Molecular dynamics simulation
Based on the molecular docking findings, a molecular dynamics simulation was performed to explore the binding mechanism between the quercetin complex and TNF-α. This approach simulates molecular motion and interactions at the atomic level and analyzes dynamic changes in proteins, ligands, and the surrounding environment, thereby providing information on molecular conformational change, binding stability, and protein-ligand dynamics. The receptor-ligand complex was solvated using the TIP3P water model, with a buffer distance of at least 12 Å between the complex and the system boundary to ensure full solvation and reduce boundary effects. The ionic concentration was set to 0.154 M, and Na⁺ and Cl⁻ ions were added to neutralize the system charge. To improve simulation accuracy, the Amber14SB protein force field22 was adopted, which effectively describes non-bonded intermolecular interactions and binding modes and is particularly suitable for protein-ligand complex studies23.
For initial energy minimization, the steepest descent method was run for 5000 steps to remove unreasonable contacts and high-energy conformations, using a convergence threshold of 10 kJ/mol/nm to ensure relaxation of the force field parameters. The conjugate gradient method was then run for 2,000 steps to further optimize the thermodynamic state and ensure system stability24.
During equilibration, NVT ensemble simulation was first performed for 100 ps with a 2 fs timestep. The system was gradually heated to 300 K to reduce the influence of the initial structure and reach thermodynamic equilibrium. The ensemble was then switched to NPT, and an additional 100 ps equilibration was performed at a constant pressure of 1 bar to stabilize density and pressure. This stage was used to bring the system to a stable thermodynamic state before production simulation25. The formal molecular dynamics simulation was performed for 20 ns, with the temperature maintained at 300 K, pressure at 1 bar, and a time step of 2 fs. The trajectory was saved every 10 ps. To ensure simulation stability and accuracy, physical parameters, including temperature, pressure, and volume, were monitored regularly to confirm that they remained within the expected ranges.
Alanine flexible scanning
Based on the stable conformation obtained from molecular dynamics simulation, alanine scanning was performed on all amino acid residues within a 3 Å radius of the ligand-binding interface. In this procedure, target residues are systematically replaced with alanine, thereby truncating the side chain while preserving the main-chain conformation and removing side-chain-mediated specific interactions. The contribution weight of each residue to binding affinity was quantified by calculating the change in binding free energy between the wild-type and mutant complexes. Unlike traditional static models, this study introduced a side-chain flexible relaxation mechanism, allowing the environment around the mutation site to undergo structural relaxation and more realistically simulate the dynamic response of the binding interface. This analysis aimed to identify candidate hotspot residues that maintain complex stability, providing an energetic fingerprint for lead compound optimization targeting autism-related proteins.
Animal experiments
Experimental animals
Healthy SPF-grade Sprague-Dawley (SD) rats (three males and three females, aged 3 months), born and reared under identical conditions, were selected. The room temperature was controlled at 18–22 °C, the relative humidity was maintained at 60%–70%, and the light cycle was 12 h: 12 h (light: dark). All animal experimental operations were approved by the Experimental Animal Ethics Committee of The First People's Hospital of Zunyi (Approval No.: LunShen (2025)-2-362).
Animal mating, pregnancy identification, and grouping
All rats were adaptively fed in an SPF environment for 1 week after purchase. One female rat and one male rat were caged together at 18:00 every afternoon. Vaginal plug examination was performed at 8:00 the next morning (12 h after caging). The presence of a vaginal plug was considered a successful mating, and the same day was designated as gestational day 0.5 (GD0.5). Pregnant rats were housed individually in separate cages. The body weight of pregnant rats was measured and recorded daily. The body weight of pregnant rats increased continuously, with an average daily gain of 2–5 g, and the total body weight could increase by about 30% before delivery. After approximately 10 days of pregnancy, a typical pear-shaped asymmetric bulge of the abdomen was visible, and hard masses of fetuses could be felt by palpation, which was distinguished from the uniform and soft abdominal circumference caused by obesity.
Model establishment and control group setting:
For the model group, two pregnant rats were randomly selected and intraperitoneally injected with VPA solution (600 mg/kg) once on gestational day 12.5 (GD12.5). VPA was administered via a single intraperitoneal injection at a dose of 600 mg/kg on gestational day 12.5. This regimen was selected based on the seminal work by Schneider and Przewłocki26, who established that VPA exposure at this specific gestational time point recapitulates both the neuroanatomical and behavioral features of human ASD. This protocol has since become the standard model and has been consistently validated in recent pharmacological studies using identical parameters27. For the blank control group, one pregnant rat was selected and intraperitoneally injected with an equal volume of 0.9% normal saline at the same time point. Pregnant rats delivered naturally, and the birth day of the offspring was recorded as postnatal day 0 (PND0). All offspring rats were weaned and housed separately by gender on PND21.
Offspring grouping and intervention
On PND28, 12 male pups were randomly selected from the offspring of VPA-exposed pregnant rats (6 in the model group and 6 in the quercetin intervention group), and 6 male pups were randomly selected from the offspring of normal saline-exposed pregnant rats (6 in the blank group). It was ensured that there was no significant difference in body weight among the pups of each group. Offspring born to pregnant rats treated with normal saline were assigned to the blank group, those born to pregnant rats treated with VPA to the model group, and those born to pregnant rats treated with VPA to the quercetin intervention group.
Continuous intervention was performed for 4 weeks starting from PND28. For the quercetin intervention group, quercetin suspension was intragastrically administered at a fixed time every day at a dose of 100 mg/kg/day. This dosage was selected based on the following integrated evidence: (i) a prior dose-ranging study identified 100 mg/kg as the optimal dose for alleviating anxiety-like behaviors and reducing pro-inflammatory cytokines in an LPS-induced neuroinflammation rat model28; (ii) quercetin at 50 mg/kg has been shown to prevent social interaction deficits and oxidative brain damage in a prenatal VPA-induced autism rat model29; and (iii) oral quercetin was recently demonstrated to reduce brain TNF-α levels and ameliorate autistic-like behaviors in a propionic acid-induced autism rat model30. Collectively, these independent validations support the selection of 100 mg/kg to ensure robust engagement of the TNF-α-mediated inflammatory pathway in the present postnatal VPA-induced ASD model. For the blank and model groups, an equal volume of 0.5% CMC-Na normal saline solution was intragastrically administered every day. All animals had free access to food and water during the intervention period, and their body weights were measured every week to adjust the administration volume according to their body weights.
Open field test
After 4 weeks of intervention (approximately PND56), the open field test was performed to evaluate spontaneous activity and anxiety levels. The open field test (OFT) is a classic behavioral experiment for evaluating anxiety-related behavior in experimental animals. The measured indicators were the spontaneous movement ability of rats in an open environment and the time spent in the center of the open field. The OFT apparatus for rats was 30 cm in height, 50 cm in length, and 50 cm in width at the bottom, with white inner walls, and was artificially divided into 16 small grids, including 4 grids in the inner area and 12 grids in the outer area. The experimental site was kept quiet to avoid sound stimulation that might affect the accuracy of the experimental results. Each rat was placed in the center of the bottom of the box, and video recording and timing were carried out simultaneously. The camera field of view covered the entire open field and recorded the spontaneous movement of the rats and the number of crossings between grids. Each test lasted 5 min, after which video recording was stopped. The inner wall and bottom of the open box were wiped with 75% alcohol to prevent feces and body odor left by one animal from affecting the test results of the next animal. The operation was repeated after replacing the rats until all rats completed the test.
Pathological detection method
After fixation with 4% paraformaldehyde, brain tissue was subjected to gradient dehydration using a fully automatic dehydrator: 75% ethanol for 2 h, 85% ethanol for 1 h, 95% ethanol for 1 h, and absolute ethanol I-IV for 20 min each. The tissues were then cleared with clearing agent I for 25 min and clearing agent II for 30 min, followed by paraffin embedding. Sections with a thickness of 5 µm were dewaxed with dewaxing solution I and II for 30 min each and rehydrated with gradient ethanol. The sections were stained with hematoxylin for 5–10 min, differentiated with hydrochloric acid alcohol for 3 s, and counterstained with alkaline water to turn blue. They were then counterstained with alcohol-soluble eosin for 3 min, dehydrated with gradient ethanol, cleared, coverslipped with neutral mounting medium, and observed under a microscope.
Detection of TNF-α levels in serum and brain tissue
After the last administration, abdominal aortic blood was collected from rats and centrifuged at 3,000 r/min at 4 °C for 15 min, and the serum supernatant was collected. Meanwhile, hippocampal and cortical tissues were dissected, and precooled PBS was added at a ratio of 1:9 for mechanical homogenization. The homogenate was then centrifuged at 12,000 r/min at 4 °C for 20 min to collect the supernatant. The BCA method was used for tissue protein quantification. Following the ELISA kit instructions, the samples to be tested and biotinylated antibodies were added to the microplate in sequence. After incubation and washing, the avidin-peroxidase complex was added and incubated. Following another wash, substrate solution was added for color development, the reaction was terminated with stop solution, and absorbance was measured at 450 nm using a microplate reader. The concentrations of TNF-α in serum (pg/mL) and brain tissue (pg/mg prot) were calculated using the standard curve.
Statistical analysis
The RANDBETWEEN function in Microsoft Excel was used to randomize the rats and generate random numbers for rat allocation. All experimental data in this study were expressed as mean ± standard deviation (SD). Before statistical analysis, normality test (Shapiro-Wilk test) and homogeneity of variance test (Levene test) were first performed on the data of each group. For data that conformed to normal distribution and homogeneity of variance, one-way analysis of variance (one-way ANOVA) was used. If the difference was statistically significant, LSD method was further used for multiple comparisons. A value of *p < 0.05, **p < 0.01, and ***p < 0.001 was considered statistically significant.
Results
Loading...
$$\rightleftharpoonup{xx}$$
$$\longleftharp{xx}$$,
$$\longrightharp{xx}$$,
Analysis of the results of network pharmacology study on KSZZD in the treatment of autism
A total of 15,770 autism-related targets were retrieved from the GeneCards database. Targets with a relevance score ≥ 4.21 were selected as potential targets for autism, resulting in 1014 disease targets. The 827 targets of KSZZD were intersected with the 1,014 autism targets, and 125 common targets were obtained. Visualization was performed using the SRplot platform31 (https://www.bioinformatics.com.cn/), and a Venn diagram was drawn, which is shown in Figure 1A. These 125 targets were considered potential sites through which KSZZD may exert autism-related effects.
The active components and targets of KSZZD Pill were imported into the referenced software (see the Table of Materials) for network visualization, and active component nodes with a degree of 0 were removed. In the global network of Figure 1B, diamond nodes represented drugs, square nodes represented intersection targets, and circular nodes represented drug active components. Analysis of Degree values showed that there was a high correlation between drug active components and targets. Among them, the predicted targets were analyzed according to Degree values, and the top 8 targets with the highest Degree values were obtained (Table 1). The larger the node area in the figure, the higher the Degree value, indicating a closer relationship with other targets; that is, the active component can play a key role in the entire network. In particular, the active component nodes of core medicinal materials such as Polygala tenuifolia and Os Draconis exhibited significantly high degree values, indicating that these components are in key hub positions in the entire network of the compound's efficacy, which is consistent with the pharmacological characteristic of TCM formulas acting through “multi-component, multi-target” mechanisms.
To further clarify the core targets, the 125 intersection targets were uploaded to the STRING 12.0 database to obtain protein-protein interaction (PPI) information, and three algorithms (MCC, Degree, and MNC) of the cytoHubba plug-in were used for cross-validation. Finally, 10 core hub targets including AKT1, IL6, TNF, BCL2, IL1B, TP53, STAT3, ESR1, CTNNB1, and PTEN were screened out (Figure 1C). These hub targets are widely involved in biological functions such as neuroinflammation regulation, apoptosis control, and neurodevelopmental signaling pathways such as Wnt. This suggests that KSZZD may exert autism-related therapeutic potential through multi-dimensional mechanisms such as reducing intracerebral inflammatory response, inhibiting abnormal neuronal apoptosis, and optimizing synaptic plasticity.
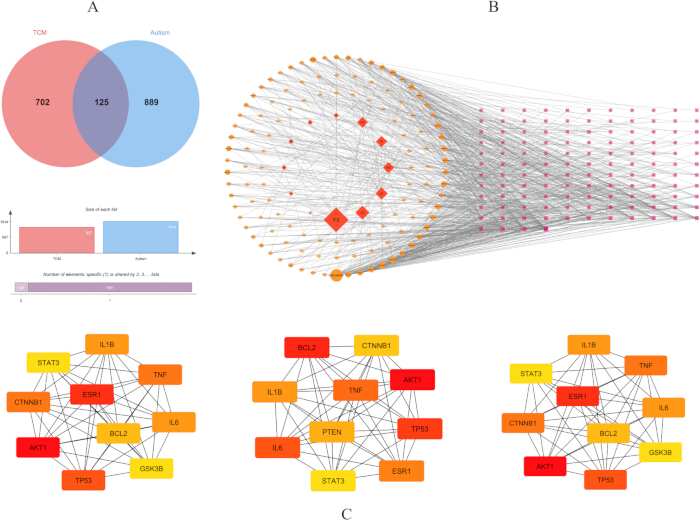
Figure 1. Identification of candidate targets and network pharmacology analysis of TCM for autism treatment. (A) Common targets for diseases and drugs. (B) KSZZD-active ingredients-target genes. (C) The PPI network for 10 overlapping genes (The size and color of the nodes are positively correlated with the degree of target association). Please click here to view a larger version of this figure.
Analysis of main active components of KSZZD in the treatment of autism
A total of 60 active components were retrieved from KSZZD Pill, among which 25 were from the TCMSP database and 35 were from the HERB database. The basic information of the active components in KSZZD Pill is shown in Table 1. The 3D structure SDF files of the 3D structures of 35 active components obtained from the HERB database were imported into the SwissTargetPrediction platform to predict the targets of the drug active components. After merging with the drug targets obtained from the TCMSP database and removing duplicates, 827 drug targets were obtained.
The active components and targets of KSZZD Pill were imported into the referenced software for network visualization, and active component nodes with a degree of 0 were removed. The larger the node area in the figure, the higher the Degree value, indicating a closer relationship with other targets, that is, the active component can play a key role in the entire network. These components with high Degree values occupy a core position in the network, suggesting that they may synergistically exert pharmacological effects in improving autism-related neuroinflammation and synaptic transmission function by acting on core targets in the protein-protein interaction (PPI) network such as AKT1, TNF, IL6, and TP53 (see Figure 2).
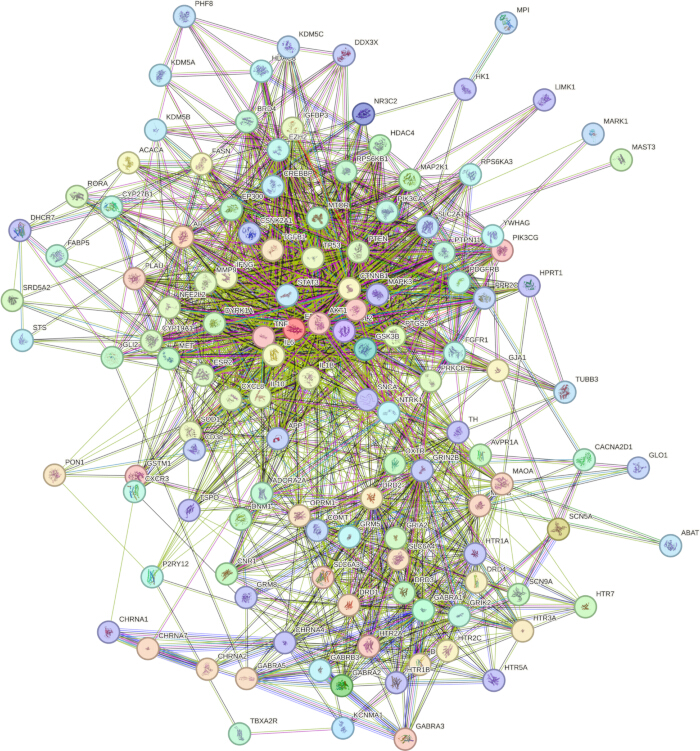
Figure 2. Target PPI network of KSZZD in the treatment of autism. Please click here to view a larger version of this figure.
The predicted targets were analyzed according to the Degree value, and the top 8 targets with the highest Degree values were obtained (Table 1). The top 6 active components with the highest Degree values were quercetin, beta-sitosterol, moupinamide, kaempferol, stigmasterol, and armepavine.
| Number | Component | CAS | MW | Degree |
| MOL000098 | Quercetin | 73123-10-1 | 302.25 | 525 |
| MOL000358 | Beta-sitosterol | 83-46-5 | 414.79 | 165 |
| MOL008647 | Moupinamide | 66648-43-9 | 313.38 | 164 |
| MOL000422 | Kaempferol | 520-18-3 | 286.25 | 142 |
| MOL000449 | Stigmasterol | 83-48-7 | 412.77 | 123 |
| HBIN016854 | Armepavine | 524-20-9 | 313.39 | 118 |
| HBIN048048 | Vitamin d | 40013-87-4 | 416.6 | 118 |
| HBIN002024 | 1,7-dimethoxyxanthone | 08-06-5042 | 256.25 | 117 |
Table 1: Key active components of KSZZD in the treatment of ASD.
Functional enrichment analysis of intersection targets of KSZZD and autism
The results of GO functional enrichment analysis showed that a total of 60 significantly enriched GO terms were screened out (P < 0.05), including 20 biological process (BP) terms, 20 cellular component (CC) terms, and 20 molecular function (MF) terms. The specific distribution is shown in Figure 3A.
In terms of KEGG pathway enrichment analysis, a total of 20 significantly related signaling pathways were screened out in the study (P < 0.05), and the detailed results are shown in Figure 3B. The analysis results suggested potential molecular mechanisms of KSZZD in autism: the intersection targets were significantly enriched in multiple pathways related to the nervous system and inflammation regulation, including neuroactive ligand-receptor interaction, dopaminergic synapse, PI3K-Akt signaling pathway, and MAPK signaling pathway. Among them, the neuroactive ligand-receptor interaction pathway had a high degree of enrichment, suggesting that this formula may affect behavioral abnormalities associated with autism by regulating the balance of neurotransmitters and their receptors.
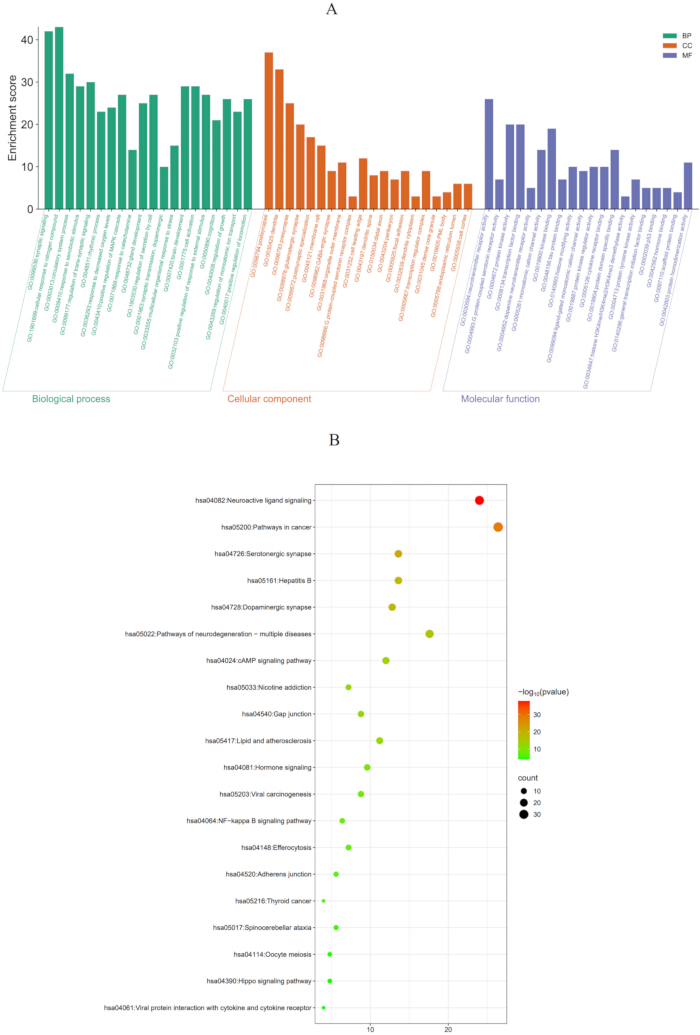
Figure 3. GO functional enrichment and KEGG pathway analysis of KSZZD-related target genes. (A) GO enrichment analysis. (B) KEGG pathway enrichment analysis of KSZZD targets for autism-related mechanisms. Please click here to view a larger version of this figure.
In summary, network pharmacology analysis suggested that KSZZD contains 60 active components with quercetin, beta-sitosterol, and kaempferol as the core, which collectively act on 125 targets highly related to autism, such as AKT1, TNF, IL6, and TP53. Its core pharmacological logic lies in effectively inhibiting neuroinflammation and promoting the survival and functional repair of neurons by regulating the above-mentioned key signaling pathways. In particular, quercetin, as a core component, may play a regulatory role in autism-related mechanisms through the synergistic effect of multiple targets and multiple pathways, providing a basis for further investigation of this compound.
Molecular docking results of core components and core targets of KSZZD
Molecular docking simulation was performed on the core active components and core targets of KSZZD, and the results are shown in the heat map (Figure 4). The binding energies of all component-target pairs exhibited binding energies ranging from -5.79 to -8.52 kcal/mol. According to the principle that the lower the binding energy, the stronger the affinity, the binding energies of all docking combinations were less than -5.0 kcal/mol, which suggests that the main chemical components in KSZZD have predicted binding activity with the screened core targets.
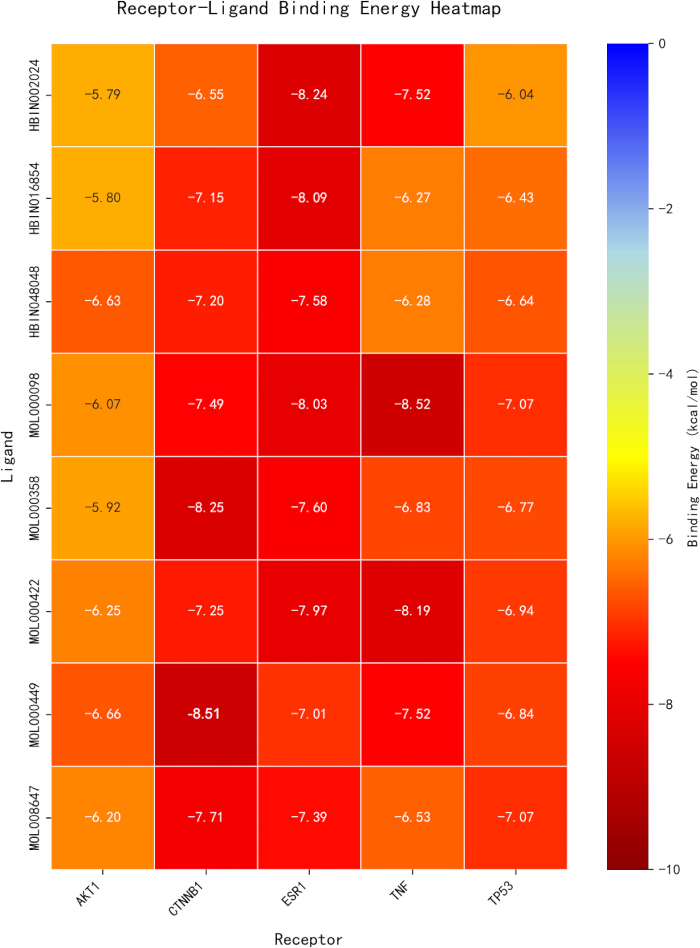
Figure 4. Heat map of molecular docking between core components and core targets of KSZZD. Please click here to view a larger version of this figure.
Among all core targets, tumor necrosis factor (TNF) showed significant binding potential. From the perspective of active components, quercetin exhibited the most favorable binding affinity toward TNF, yielding the lowest binding energy among all pairs (-8.52 kcal/mol).
To further observe its binding mode, this study visualized the docking results of quercetin and TNF (Figure 5). The results showed that quercetin was predicted to embed into the active pocket of TNF and interact with surrounding amino acid residues (such as GLN-102, GLU-104, TYR-115, etc.) through various chemical bonds. This result suggests that quercetin may contribute to KSZZD-related regulation of TNF-mediated inflammatory responses and potential neuroprotective effects.
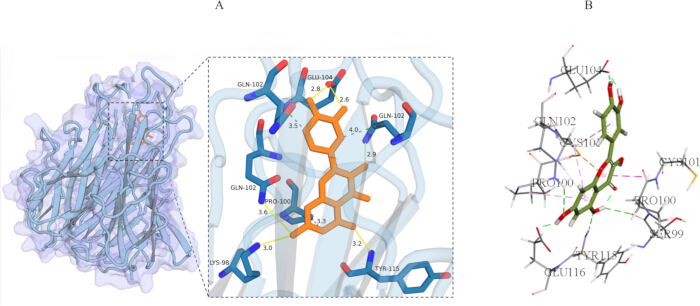
Figure 5. Results of quercetin and TNF-α. (A) Three-dimensional structural model of protein-ligand binding. (B) Diagram of intermolecular interaction forces. Please click here to view a larger version of this figure.
Molecular dynamics simulation results
The 20 ns molecular dynamics simulation was performed on the complex system to evaluate structural stability in a simulated physiological dynamic environment. The complex showed structural convergence and stability throughout the simulation process.
For structural stability evaluation, the root mean square deviation (RMSD) curve showed that the protein and its ligand-bound complex underwent initial adjustment during the first 5 ns of simulation and then converged to a stable state, with final fluctuations maintained between 0.2 and 0.25 nm. At the same time, the ligand RMSD remained at a very low level of approximately 0.05 nm, indicating that its position in the binding pocket was stable (Figure 6A). The radius of gyration remained within 2.14–2.18 nm (Figure 6B), and the stable solvent-accessible surface area indicated that the protein maintained a compact folded state during the simulation without obvious unfolding or conformational collapse (Figure 6C).
For local flexibility and intermolecular interactions, residue fluctuation analysis showed that most residue regions maintained low values (Figure 6D), with only a local fluctuation peak near residue index 100, consistent with the typical physical characteristics of a flexible protein loop region. Hydrogen-bond and contact-pair analysis further characterized the binding interaction (Figure 6E). A stable network of 3–6 hydrogen bonds was maintained between the ligand and the protein, and the number of contact pairs within 0.35 nm remained generally stable, with only minor fluctuations over time. This continuous hydrogen-bond network is an important factor in maintaining high-affinity binding between the ligand and receptor and supporting the structural integrity of the complex in a dynamic environment.
In addition, the free energy landscape constructed from RMSD and Rg (Figure 6F) showed that the conformational distribution of the system was highly concentrated during the simulation, forming a deep and narrow blue low-energy region. This pattern indicates that the complex reached a thermodynamically stable state within the simulation time and that conformational transition was limited to a small space. Together, these indicators support the reliability and structural stability of ligand-protein binding.
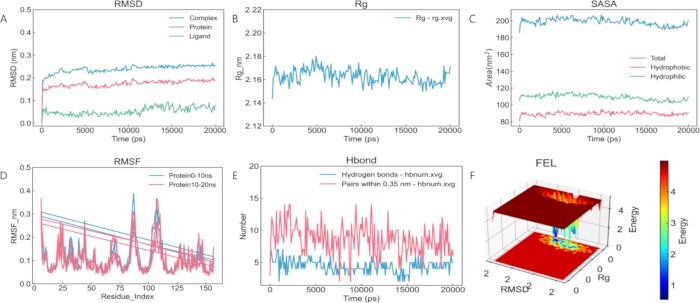
Figure 6. Dynamic evolution and interaction characteristics of the complex system. (A) RMSD curve. (B) Radius of gyration (Rg). (C) Solvent-accessible surface area (SASA). (D) Residue RMSF fluctuation. (E) Number of hydrogen bonds and contact pairs. (F) Free energy landscape (FEL) based on RMSD and Rg. Please click here to view a larger version of this figure.
Alanine flexibility scanning results
Based on the equilibrium trajectory of molecular dynamics simulation, this study performed alanine flexibility scanning on the key residues in the ligand-binding pocket, and conducted in-depth evaluation combined with PLIP interaction fingerprinting. The results showed that in 100 frames of the dynamic trajectory (Figure 7A), residues such as GLU116, GLU104, GLN102, and LYS98 exhibited extremely high binding frequency with the ligand, mainly maintaining the stability of the complex through continuous hydrogen bond (H-bond) interactions. Further energy contribution analysis indicated that GLU104 and GLN102 had the highest interaction frequencies, and energy calculation after alanine substitution supported their role as "hotspot residues" in molecular recognition (Figure 7B). In addition, PRO100 and GLN102 also provided important hydrophobic interaction compensation. In summary, these high-frequency contact residues constitute the energy core of the binding between the ligand and autism-related target proteins, providing a structural basis for subsequent optimization of lead compounds targeting specific residues.
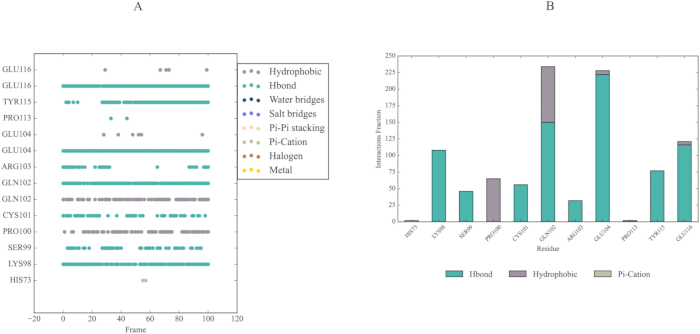
Figure 7. Molecular dynamics simulation analysis of the binding stability between quercetin and TNF-α. (A) Protein-ligand interaction profile across the simulation trajectory. (B) Protein-ligand interaction frequency histogram. Please click here to view a larger version of this figure.
Effects of quercetin on spontaneous locomotor activity and exploratory behavior of VPA-induced ASD model rats
The open field test revealed significant differences in spontaneous locomotor activity and exploratory behavior among rats in each group. Compared with the blank group, the model group showed obvious bradykinesia and exploration inhibition, with significantly decreased total moving distance, average speed, and grid-crossing times (P < 0.001), while the immobility time was significantly prolonged (P < 0.001). After quercetin intervention, locomotor and exploratory abnormalities in rats were ameliorated: compared with the model group, the total distance, average speed, and grid-crossing times of rats in the intervention group in the open field were significantly increased (P < 0.01), and the immobility time was significantly shortened compared with the model group (P < 0.01) (Figure 8A-D). Representative trajectory diagrams and heat maps intuitively reflected the characteristics of a wider exploration area and higher activity in the quercetin group (Figure 8E,F).
These results indicated that the spontaneous locomotor activity and exploratory behavior of rats in the model group were significantly impaired, which was manifested by a significant decrease in total distance and grid-crossing times, and a significant prolongation of immobility time; while quercetin intervention significantly reversed various motor parameters, partially reversing bradykinesia and exploration inhibition in the VPA-induced ASD model.
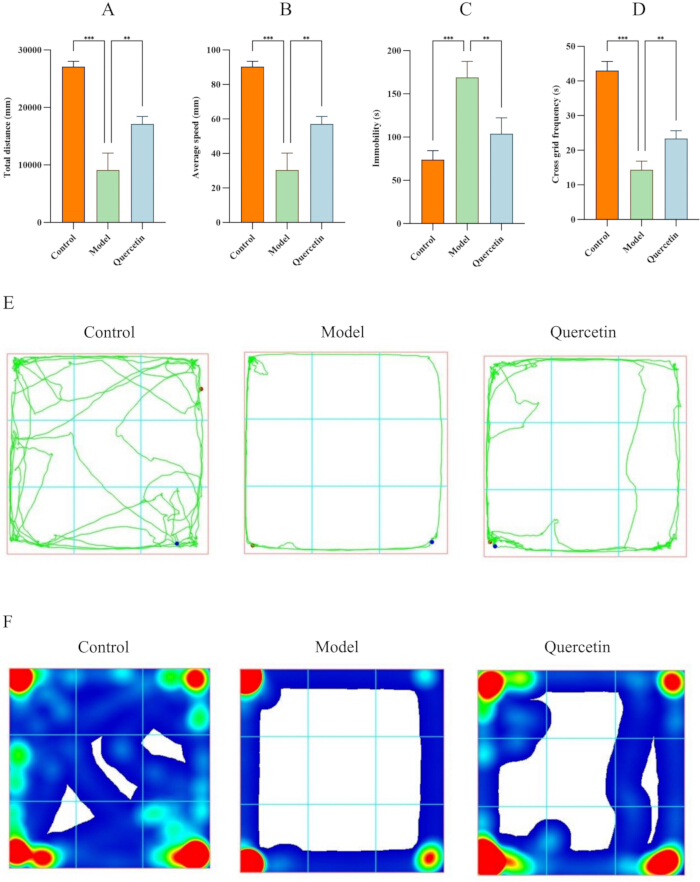
Figure 8. Effects of quercetin on behavioral measures in VPA-induced ASD rats evaluated by the open field test. (A) Total distance. (B) Average speed. (C) Immobility. (D) Cross grid frequency. (E) Track maps. (F) Heat maps. Please click here to view a larger version of this figure.
HE staining results of brain tissues in each group of rats
HE staining was used to detect neuronal damage in the hippocampus of rats. In the control group, the hippocampal dentate gyrus (DG) architecture was well-preserved. The granular cell layer was neatly arranged with clear nuclear morphology, and no obvious pathological changes were observed. In the model group, hippocampal damage was observed: the granular cell layer was disorganized, with numerous shrunken neurons showing nuclear pyknosis. The intercellular space was markedly widened, indicating obvious interstitial edema, and scattered inflammatory cell infiltration was visible. Compared with the model group, the quercetin intervention group showed alleviated pathological changes: the arrangement of the granular cell layer was improved, the number of pyknotic neurons was reduced, interstitial edema was relieved, and inflammatory cell infiltration was decreased (Figure 9A).
TNF-α detection results in serum and brain tissues of each group of rats
The results of ELISA detection showed that compared with the blank control group, the levels of pro-inflammatory factor TNF-α in the serum and brain tissues of rats in the model group were significantly increased (P < 0.01), indicating that there was an obvious inflammatory response in the body and brain of the model rats. After quercetin intervention, the level of TNF-α in the serum of rats was significantly decreased compared with the model group (P < 0.01), and the expression of TNF-α in the brain tissue was also effectively inhibited (P < 0.05). The results are shown in Figure 9B,C. The above results indicate that quercetin can significantly reduce the levels of inflammatory factors in the whole body and central nervous system of autistic rats, suggesting anti-inflammatory activity.
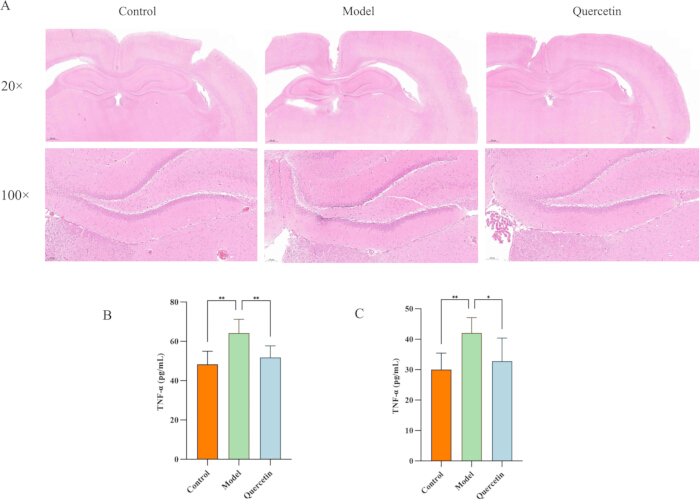
Figure 9. Pathological changes and TNF-α expression in brain tissues of each group. (A) Hippocampal tissue HE-stained pathological section image. Bar charts of TNF-α levels in (B) rat serum and (C) rat brain tissue. Please click here to view a larger version of this figure.
DATA AVAILABILITY
The datasets supporting the conclusions of this article are included within the article.
Discussion
Loading...
$$\rightleftharpoonup{xx}$$
$$\longleftharp{xx}$$,
$$\longrightharp{xx}$$,
A critical question is why quercetin, rather than other core components, was selected for experimental validation and whether it can represent the holistic effects of KSZZD. This selection was based on the following converging lines of evidence: (i) in a prenatal VPA-induced rat model, quercetin significantly prevented social interaction deficits and oxidative brain damage29; (ii) in a propionic acid-induced autism model, oral quercetin reduced brain TNF-α levels and ameliorated autistic-like behaviors30; and (iii) in an LPS-induced neuroinflammation model, quercetin alleviated anxiety-like behaviors and reduced inflammatory cytokines in a dose-dependent manner28. Together, these findings support quercetin as a neuroprotective and anti-inflammatory agent in ASD-relevant models. Second, quercetin has been shown to penetrate the blood-brain barrier32, which is a prerequisite for targeting central TNF-α-mediated neuroinflammation. Third, from a network pharmacology perspective, quercetin has been identified by independent studies as a core hub compound in multiple classical TCM formulations targeting neuropsychiatric conditions33, supporting the validity of prioritizing hub compounds for downstream experimental validation. Collectively, these data indicate that quercetin, as a principal pharmacophore of KSZZD, may mediate part of the formula's anti-neuroinflammatory effects via TNF-α pathway inhibition. Our findings that quercetin significantly reduced serum and brain TNF-α levels, ameliorated bradykinesia and exploratory inhibition, and was associated with reduced hippocampal histopathological changes is consistent with prior reports in ASD animal models29,30 and with preliminary clinical evidence in children with ASD showing reduced serum TNF-α levels following quercetin-containing flavonoid treatment34. Nevertheless, it should be acknowledged that the overall efficacy of KSZZD likely also involves the synergistic contribution of other core components, such as β-sitosterol and kaempferol, which may collectively target complementary pathways including the dopaminergic synapse pathway as suggested by our KEGG enrichment analysis. Future studies employing component combination strategies are warranted to fully decipher the multi-component synergy of this formula.
The results of this study, when interpreted collectively, suggest a possible mechanistic picture of how KSZZD may exert ASD-related effects. Network pharmacology analysis revealed that the 125 intersection targets of KSZZD and ASD were significantly enriched in the TNF signaling pathway, as well as the neuroactive ligand-receptor interaction, dopaminergic synapse, PI3K-Akt, and MAPK signaling pathways. The convergence of multiple core targets—including AKT1, TNF, IL6, and TP53—onto the PI3K-Akt and MAPK pathways is particularly noteworthy, as these pathways are centrally involved in both neuroinflammation and synaptic plasticity regulation. AKT1, positioned at the intersection of these pathways, functions as a critical mediator of neuronal survival by inhibiting pro-apoptotic signals while simultaneously promoting synapse formation and maturation. The concurrent targeting of TNF-α by quercetin, combined with the potential modulation of AKT1-mediated pro-survival signaling by other co-existing components, suggests that KSZZD may contribute to neuroprotective effects through a dual mechanism: direct inhibition of TNF-α-driven neuroinflammatory damage and simultaneous activation of neurotrophic signaling cascades that facilitate synaptic repair. This mechanistic framework aligns with the emerging consensus that intervention in neurodevelopmental disorders such as ASD may benefit from simultaneous engagement of anti-inflammatory and pro-neuroplasticity pathways. Multi-component TCM formulations may be suited to this dual-targeting strategy.
At the atomic level, our findings extend beyond the confirmation of binding affinity to provide precise structural information that may inform future drug design efforts. The identification of GLU104 and GLN102 as hotspot residues responsible for maintaining quercetin-TNF-α complex stability offers specific anchoring points for rational lead optimization. Structural modifications that enhance interactions with these residues could yield quercetin derivatives with improved binding specificity and prolonged target engagement. Such structure-guided optimization, combined with the multi-target characteristics revealed by our network pharmacology analysis, may facilitate the development of future anti-neuroinflammatory candidates for ASD-related research.
Compared with previous studies on KSZZD or quercetin in ASD models, the present work advances the field in several key aspects. First, while prior investigations have demonstrated quercetin's protective effects in VPA- or PPA-induced ASD models primarily through behavioral and oxidative stress endpoints29,30, our study integrates network pharmacology, molecular docking, 20-ns MD simulations, and alanine flexible scanning to further identify GLU104 and GLN102 as the key hotspot residues that maintain quercetin-TNF-α complex stability. This atomic-level interaction fingerprint has not been reported previously in the context of ASD drug-target interactions, offering actionable structural templates for future lead compound optimization targeting specific residues. Second, unlike many network pharmacology studies that conclude at the computational prediction stage, our work establishes a complete pipeline spanning from in silico screening and atomic-level MD simulation with residue-level energy decomposition to in vivo validation in a behaviorally, pathologically, and molecularly characterized VPA-induced ASD rat model. This multi-scale evidence chain substantially strengthens the translational relevance of the computational findings. Third, the concurrent reduction of TNF-α levels observed in both serum and brain tissue, together with the behavioral improvements and histopathological amelioration, supports the central hypothesis generated by network pharmacology: that KSZZD, through its principal pharmacophore quercetin, may ameliorate VPA-associated behavioral abnormalities via inhibition of TNF-α-mediated neuroinflammation. This integrated strategy may serve as a methodological reference for future mechanistic studies on multi-component TCM formulations targeting neurodevelopmental disorders.
Another limitation of this study is the absence of a positive control group treated with a clinically approved drug. Risperidone, an atypical antipsychotic, was the first drug approved by the U.S. Food and Drug Administration (FDA) in 2006 for the treatment of irritability associated with autistic disorder in children and adolescents, and its efficacy in ameliorating behavioral deficits was demonstrated in a landmark multisite randomized controlled trial35. In preclinical neurodevelopmental disorder models, risperidone has also been employed as a positive control and has been shown to rescue social interaction deficits, cognitive impairments, and sensorimotor gating dysfunction36. The present in vivo experiment was specifically designed to test the core mechanistic hypothesis that quercetin inhibits TNF-α-mediated neuroinflammation and ameliorates ASD-like behaviors. Therefore, the experimental design was streamlined to compare the VPA-induced pathological state with quercetin intervention. We acknowledge that without a positive control, the relative efficacy of quercetin cannot be directly benchmarked against standard pharmacotherapy. Future studies incorporating a risperidone positive control arm are warranted to benchmark the therapeutic potential of quercetin against standard pharmacotherapy for ASD.
Only male offspring were included in this study. This decision was based on the following rationale. First, ASD is diagnosed approximately four times more frequently in males than in females, and male predominance is a well-established epidemiological feature of the disorder37. Second, in the prenatal VPA rat model, while both sexes exhibit autism-like traits, males consistently display more pronounced impairments in social interaction and anxiety-related behaviors compared to females38, making them a more sensitive population for detecting treatment effects. We acknowledge that the exclusion of female offspring limits the generalizability of our findings, and future studies should examine sex-specific responses to quercetin intervention.
The sample size of n = 6 per group was determined based on the following considerations. First, this sample size is comparable to that employed in published pharmacological intervention studies using the prenatal VPA rat model, in which n = 8 per group has been used for behavioral assessments27. Second, the use of male littermates from different litters across groups minimized within-group variability. Third, given that the OFT parameters in VPA models have been reported to show large effect sizes, n = 6 per group was considered sufficient for one-way ANOVA to detect biologically meaningful differences at α = 0.05 with power ≥ 0.8.
A limitation of the present study is that the in vivo experimental validation focused exclusively on quercetin, the core pharmacophore identified by network pharmacology, rather than on the whole KSZZD extract. This experimental strategy was adopted for two reasons. First, the primary objective of our in vivo experiment was to validate the core computational hypothesis generated by the preceding in silico analyses—namely, that KSZZD-derived quercetin can inhibit TNF-α-mediated neuroinflammation and thereby ameliorate ASD-like behaviors. A reductionist approach that isolates the principal active component and tests it in a well-characterized animal model provides unambiguous evidence for the proposed mechanism of action. Second, quercetin has been independently validated as a neuroprotective and anti-inflammatory agent in multiple ASD-relevant animal models, including the prenatal VPA model29, the propionic acid-induced model30, and the LPS-induced neuroinflammation model28, supporting its suitability as a representative pharmacophore for initial mechanistic validation. We acknowledge, however, that this design does not directly address the contribution of multi-component synergy, which is a hallmark of TCM formulations. Future studies incorporating a whole KSZZD extract group, as well as component combination strategies, will be necessary to evaluate the extent to which the holistic effects of KSZZD exceed those of quercetin alone, and to systematically elucidate the scientific basis of the "multi-component, multi-target" paradigm of this classic formula.
Using network pharmacology, molecular docking, molecular dynamics simulations, and animal experiments, the present study investigated potential mechanisms by which KSZZD may affect ASD-related pathways. We identified that KSZZD contains 60 active components, with quercetin, β-sitosterol, and kaempferol as the core constituents. These components target 125 hub targets, including AKT1, TNF, IL6, and TP53, and synergistically regulate multiple signaling pathways related to neurodevelopment and inflammation, such as neuroactive ligand-receptor interaction, PI3K-Akt, and MAPK signaling pathways. The convergence of these targets on the PI3K-Akt and MAPK pathways suggests a dual mechanism involving both anti-inflammatory and neurotrophic effects. Molecular docking and 20 ns molecular dynamics simulations further supported that the core component quercetin exhibited favorable binding affinity (binding energy = -8.52 kcal/mol) and dynamic structural stability with the hub target TNF, among which GLU104 and GLN102 are the key hotspot residues that maintain their interactions. These atomic-level findings provide a structural template for future lead optimization efforts.
In the in vivo validation, the open-field test showed that quercetin intervention significantly ameliorated bradykinesia and exploratory inhibition in VPA-induced ASD rats, increased total moving distance, and shortened immobility time. Pathological observation was consistent with partial alleviation of hippocampal tissue abnormalities, and ELISA assay showed that quercetin reduced TNF-α levels in serum and brain tissue. These findings suggest that quercetin, as a KSZZD-derived candidate component, may contribute to anti-inflammatory effects in the VPA-induced ASD rat model through modulation of TNF-α-associated neuroinflammatory pathways. This multi-scale study thus provides a preclinical basis for further investigation of KSZZD-derived candidate components and a methodological framework for future mechanistic studies of TCM formulations in neurodevelopmental disorders.
Disclosures
Loading...
$$\rightleftharpoonup{xx}$$
$$\longleftharp{xx}$$,
$$\longrightharp{xx}$$,
The authors have no conflicts of interest to declare.
Acknowledgements
Loading...
$$\rightleftharpoonup{xx}$$
$$\longleftharp{xx}$$,
$$\longrightharp{xx}$$,
This work is part of No.: Zun Shi Ke He HZ Zi (2024) No. 54. Project Title: Study on the Therapeutic Effect of Jiawei Kongsheng Zhenzhong Dan on Autism Based on the BDNF-ERK-CREB Signaling Pathway.
Materials
| Name | Company | Catalog Number | Comments |
|---|---|---|---|
| 0.5% CMC-Na normal saline solution | Not specified in manuscript | Not specified | Vehicle used for blank/model groups and quercetin suspension. |
| 0.9% normal saline | Not specified in manuscript | Not specified | Vehicle for blank-control maternal injections. |
| 4% Paraformaldehyde in PBS | Thermo Scientific Chemicals | J61899.AK | Used for fixation of brain tissue. |
| 75% alcohol | Not specified in manuscript | Not specified | Used to clean the open-field apparatus between animals. |
| Absolute ethanol | Not specified in manuscript | Not specified | Used for tissue dehydration before embedding. |
| Alkaline water | Not specified in manuscript | Not specified | Used to blue hematoxylin-stained sections. |
| Amber14SB protein force field | Not specified in manuscript | Not applicable | Protein force field used for molecular dynamics simulations. |
| BATMAN-TCM database | Not specified in manuscript | Not applicable | Online target-screening database: http://bionet.ncpsb.org.cn/batman-tcm/ |
| BCA Protein Assay Kit | Thermo Scientific | 23225 | Used for protein quantification of tissue homogenates. |
| Bluing reagent | Thermo Scientific Richard-Allan Scientific | 7301 | Used after hematoxylin staining to blue nuclei. |
| CDOCKER module | Not specified in manuscript | Not applicable | Semi-flexible docking module used for molecular docking. |
| Clearing / dewaxing reagent | Thermo Scientific Richard-Allan Scientific | Clear-Rite 3, 6901 | Can be used for clearing and deparaffinization in histology workflows. |
| CytoNCA plugin | Not specified in manuscript | Not applicable | Cytoscape plugin used for degree centrality analysis. |
| Cytoscape software | Not specified in manuscript | Version 3.10.0 | Used for network visualization and protein-protein interaction analysis. |
| Discovery Studio software | Not specified in manuscript | Versions 2019 and 2021 | Used for receptor preprocessing, docking, and alanine scanning. |
| Draw Venn Diagram online tool | Not specified in manuscript | Not applicable | Online tool for Venn diagrams: http://bioinformatics.psb.ugent.be |
| Eosin-Y (alcoholic) | Thermo Scientific Richard-Allan Scientific | 7111 | Used for cytoplasmic counterstaining in H&E staining. |
| Fully automatic dehydrator | Not specified in manuscript | Not specified | Used for gradient dehydration of fixed brain tissue. |
| GeneCards database | Not specified in manuscript | Not applicable | Online database used to retrieve autism-related targets: https://www.genecards.org/ |
| GraphPad Prism software | Not specified in manuscript | Version 9.5 | Used for statistical analysis and graphing. |
| Hematoxylin staining solution | Thermo Scientific Richard-Allan Scientific | 7211 | Used for nuclear staining in H&E staining. |
| HERB database | Not specified in manuscript | Not applicable | Online database used for supplementary compound screening: http://herb.ac.cn |
| Hydrochloric acid alcohol | Not specified in manuscript | Not specified | Used for differentiation during H&E staining. |
| Metascape platform | Not specified in manuscript | Not applicable | Online platform used for GO and KEGG enrichment analysis. |
| Microplate reader | Thermo Scientific | Multiskan FC, 51119000 | Used for absorbance reading at 450 nm. |
| Microscope | Not specified in manuscript | Not specified | Used to observe H&E-stained brain sections. |
| Microsoft Excel software | Microsoft | Not specified | Used to randomize rats with the RANDBETWEEN function. |
| Mounting medium | Thermo Scientific Richard-Allan Scientific | 4111 | Used for coverslipping and permanent mounting of stained sections. |
| Open field test apparatus | Not specified in manuscript | Not specified | 50 cm × 50 cm × 30 cm box used for behavioral testing. |
| Paraffin | Not specified in manuscript | Not specified | Used for paraffin embedding of brain tissue. |
| Phosphate-buffered saline (PBS), pH 7.4 | Gibco | 10010023 | Used as pre-cooled buffer for tissue homogenization. |
| PLIP interaction fingerprinting | Not specified in manuscript | Not applicable | Used for protein-ligand interaction fingerprint analysis. |
| PubChem database | Not specified in manuscript | Not applicable | Online database used to retrieve SMILES identifiers: https://pubchem.ncbi.nlm.nih.gov/ |
| Quercetin | Not specified in manuscript | Not specified | Administered by gavage at 100 mg/kg/day. |
| Rat TNF-α ELISA Kit | Invitrogen | ERA56RB | Suitable for serum and tissue homogenate TNF-α detection. |
| Refrigerated centrifuge | Thermo Scientific | Sorvall ST 16R, 75004383 | Used for serum and tissue homogenate centrifugation. |
| Schrödinger Suite software | Schrödinger, LLC | Version 2024 | Used to construct the molecular dynamics simulation system. |
| SPF-grade Sprague-Dawley rats | Not specified in manuscript | Not specified | 3 male and 3 female rats used for animal model establishment. |
| SPSS software | Not specified in manuscript | Version 25.0 | Used for statistical analysis. |
| SRplot platform | Not specified in manuscript | Not applicable | Online platform used for visualization: https://www.bioinformatics.com.cn/ |
| STRING database | Not specified in manuscript | Version 12.0 | Used to construct the protein-protein interaction network: https://string-db.org/ |
| SwissTargetPrediction platform | Not specified in manuscript | Not applicable | Online platform used for target prediction: http://swisstargetprediction.ch/ |
| TCMSP database | Not specified in manuscript | Not applicable | Online platform used for bioactive compound screening: http://lsp.nwu.edu.cn/tcmsp.php |
| TIP3P water model | Not specified in manuscript | Not applicable | Water model used for molecular dynamics simulation. |
| UniProt protein database | Not specified in manuscript | Not applicable | Used to standardize target names to Gene Symbol: https://www.uniprot.org/ |
| Valproic acid (VPA) solution | Not specified in manuscript | Not specified | Administered intraperitoneally at 600 mg/kg on gestational day 12.5. |
| Video recording system/camera | Not specified in manuscript | Not specified | Used to record rat movement during the open field test. |
Reprints and Permissions
Request permission to reuse the text or figures of this JoVE article
Request Permission