This study evaluates creative behavior in music majors by applying a structured composition-rating rubric and many-facet Rasch measurement to original musical works.
Research Article
Assessing Creative Behavior in Music Majors Through Compositional Works Using a Many-Facet Rasch Model
In This Article
Summary
Abstract
Assessing creativity in music education remains challenging because judgments of original musical work are influenced by subjective preferences, uneven interpretations of criteria, and differences in rater severity. In composition training, completed works can be treated as observable products that show how students generate, develop, transform, refine, and realize musical ideas. This study examined whether a structured composition-rating rubric, combined with many-facet Rasch measurement, could support a reproducible evaluation of creative behavior among undergraduate music majors. Original compositions from 80 music majors were independently scored by nine trained raters using a five-point rubric. The rubric included five related dimensions of compositional creative behavior: novelty, fluency, flexibility, precision, and feasibility. Rating data were analyzed using FACETS software, version 3.83.6, with students, criteria, and raters specified as separate facets within a common logit measurement structure. The rating design included 3,600 expected rating opportunities; 3,598 valid observed ratings were analyzed, with two missing. Overall model fit supported the interpretation of the rating design, and the ordered category structure indicated that the five-point scale functioned in the expected direction. Criterion estimates showed that novelty was relatively easier to demonstrate, whereas feasibility and flexibility were more difficult within completed compositions. Differences in rater score-use location were also observed, supporting the need to model rater effects rather than relying only on raw scores. Student separation was moderate, indicating that the instrument was better suited to broad performance stratification than to precise individual ranking. These findings suggest that a composition-based rubric combined with many-facet Rasch measurement can provide a transparent framework for evaluating creative behavior in higher music education.
Introduction
Creativity has become a central outcome of arts education because students are expected not only to reproduce established techniques but also to create work that is original, meaningful, and communicable within a disciplinary context1. In music education, this expectation is especially important in composition training, where students must transform musical knowledge into completed works through decisions about theme, melody, rhythm, form, development, and realization. Assessment is difficult in this context because musical creativity cannot be evaluated solely as a matter of personal taste or general artistic impression. A completed composition provides observable evidence of creative behavior, but that evidence must be translated into explicit criteria if scoring is to be transparent and reproducible2. Without clear criteria, scores may reflect rater preference, stylistic familiarity, or a general impression of quality rather than the specific qualities of the submitted work.
The present study defines compositional creative behavior as the observable expression of creative musical work in a completed composition. The rubric uses five dimensions: novelty, fluency, flexibility, precision, and feasibility. These dimensions are not treated as identical subtraits or as separate theoretical constructs. Instead, they are used as criterion-level manifestations of one broad product-based performance construct: the extent to which a student can generate, develop, transform, refine, and realize musical ideas in a completed work. Novelty represents the distinctiveness of the musical idea or treatment; fluency represents the continuity and productivity of idea development; flexibility represents varied approaches, transformations, or adaptive shifts in musical handling; precision represents refinement, internal organization, and concreteness of musical detail; and feasibility represents the artistic and practical viability of the completed composition3. This structure connects idea generation, idea development, adaptive transformation, technical refinement, and realized viability into a single completed musical product.
This construct argument also reduces criterion overlap and construct contamination. Precision was limited to refinement, internal organization, and concrete musical detail, whereas feasibility was defined as the artistic and practical viability of the work as a realized composition. Similarly, fluency was limited to sustained and productive development, whereas flexibility was defined as variation, transformation, and adaptive musical handling. A work may contain an original idea but limited development, or it may be coherent and technically stable while showing little transformation. A criterion-based rubric is therefore necessary because a total raw score can obscure uneven creative profiles across the same composition4.
Rater-mediated music assessment requires attention to both scorer behavior and student performance. Even when raters use the same rubric, they may differ in severity, category use, and interpretation of criteria. These differences are not merely procedural problems; they are part of the measurement situation and can affect the meaning of observed scores5. Many-facet Rasch measurement is suitable for this setting because it estimates students, raters, criteria, and rating-scale categories within a common logit framework. Student measures represent estimated creative performance after adjustment for criterion difficulty and rater severity, criterion measures indicate how difficult each dimension is to demonstrate, rater measures indicate relative score-use location, and category statistics show whether the rating scale functions in the intended order6. This approach is stronger than relying only on raw totals or mean scores because it separates multiple sources of score variation that are otherwise combined in the observed rating.
The use of a unidimensional many-facet Rasch model requires a clear construct argument. In this study, the unidimensional specification is justified at the level of overall compositional creative behavior, not by assuming that the five rubric dimensions are identical. The five criteria are expected to represent distinct observable aspects of a broad performance construct as expressed in completed musical works. This assumption was treated as an empirical measurement assumption and was examined through criterion fit, rating-scale functioning, residual associations among criteria, and rater-by-criterion and student-by-criterion interaction diagnostics7. Although many-facet Rasch approaches have been applied in performance-based assessment, their systematic use in complete composition assessment within higher music education remains limited8. Existing music assessment research has emphasized the difficulty of judging open-ended artistic products and the need for explicit scoring criteria9, while measurement research has shown that rubric-based performance assessment can benefit from modeling rater and criterion effects directly10. Against this background, the present study applies a many-facet Rasch framework to original compositions produced by undergraduate music majors. The study addresses three questions: whether the proposed composition-rating framework functions adequately as a measurement design; how criterion difficulty and rater score-use variation contribute to observed score variation; and how students’ creative-performance measures are distributed after modeling criterion and rater effects.
Protocol
This study was approved by the Institutional Review Board of the School of Music and Dance, Jiangxi Institute of Technology, Nanchang 330098, Jiangxi, China, under approval number YG2020158. Written informed consent was obtained from all participants before task administration and data collection. Participants were informed that their submitted compositions would be used only for research-based assessment after de-identification. Student names, class identifiers, file metadata containing authorship information, and other direct identifiers were removed before scoring. These identifiers were not released to raters. All submitted works were de-identified before scoring and analysis, and all analytic files were processed using coded identifiers only.
Study setting, participant recruitment, and task assignment
The study was conducted at the School of Music and Dance, Jiangxi Institute of Technology, Nanchang, Jiangxi, China, from September 2025 to January 2026. Participants were recruited from the third-year Musicology cohort because students at this stage had completed the core curriculum in music theory, performance practice, electronic music composition, and composition-related coursework before the study semester.
The source cohort included 96 third-year Musicology students. All 96 students were approached. Four students did not provide written consent and therefore did not enter screening. The remaining 92 students provided written informed consent and were screened. Twelve students were excluded before final analysis. The exclusion reasons were incomplete composition submissions in five students, missing one or more required structural elements in three students, submissions after the deadline in two students, unreadable or corrupted files in one student, and withdrawals before scoring in one student. The final analytic sample included 80 undergraduate students, including 32 males and 48 females.
The final analytic sample represented the complete eligible corpus of anonymized and scoreable compositions available from the recruited cohort after consent, screening, and exclusion rules were applied. This sample size was not justified by treating the 3,600 rating opportunities as independent student-level observations. Instead, the many-facet Rasch design used repeated ratings of the 80 compositions to estimate student creative-performance measures while also modeling criterion difficulty, rater score-use variation, and rating-scale category functioning. The inclusion of nine raters was intended to support estimation of rater-related score-use variation and to reduce dependence on any single scorer’s interpretation of open-ended compositional quality. Students were eligible if they were enrolled full-time in the third year of the Musicology program, had completed the required core coursework before the study semester, provided written informed consent, and submitted one complete original composition within the designated submission period. Students were excluded if they did not submit complete work, if the submission did not meet the predefined task requirements, if the file could not be opened or scored, if the submission was received after the deadline, or if consent was withdrawn before scoring.
Each participant completed one individual original composition task under the same written instructions. Students were allowed to choose their own theme and style, but every submission was required to include lyrics, melody, rhythm, and formal organization. Group work, resubmitted coursework, adapted published material, draft-only files, and late revisions were excluded from the formal scoring dataset. Only one final version was accepted from each participant. The detailed task requirements and submission specifications are presented in Supplementary Table 1. The complete recruitment and analysis workflow is shown in Figure 1.
Collection, screening, and anonymization of compositional works
All compositions were submitted through the institutional learning management system by 23:59 on the final day of the scheduled assignment week. Each submission included one Portable Document Format (PDF) score file and one accompanying MP3 audio rendering. After the deadline, the research team downloaded all submitted files via the same submission channel and screened each work against the predefined task requirements before releasing it to raters. Only compositions that contained lyrics, melody, rhythm, and formal organization and that represented a complete final product were retained. Draft-only files, incomplete works, files missing major structural components, late submissions, and unreadable or corrupted files were excluded before scoring.
Each eligible work was assigned an anonymized student code from S1 to S80. Student names, class identifiers, file metadata containing authorship information, and all other direct identifiers were removed before the files were released for scoring. The linkage file linking participant identity to the anonymized study code was stored separately by the principal investigator in a password-protected file. This linkage file was not available to raters or to the analyst during model estimation. The final scoring corpus consisted of 80 anonymized and scoreable compositions, each represented by one PDF score file and one MP3 audio rendering.
Scoring rubric
The scoring rubric assessed five dimensions of creative behavior in compositional works: novelty, fluency, flexibility, precision, and feasibility. The rubric was developed by the research team in consultation with three faculty members with experience in composition teaching, music theory, and music education assessment. An initial version was reviewed using five non-study practice compositions from the previous academic year. The wording of the criteria and the five score anchors was revised after the pilot review to reduce overlap between feasibility and precision and to distinguish fluency from flexibility. The final rubric was fixed on September 20, 2025, before rater training and formal scoring. No criterion wording or score anchor was changed after formal scoring began.
In the final rubric, novelty referred to the distinctiveness and originality of the musical idea or treatment. Fluency refers to the continuity and productivity of idea development within the work. Flexibility referred to varied approaches, transformations, or adaptive shifts in musical handling. Precision referred to refinement, internal organization, and concreteness of musical detail. Feasibility referred to the artistic and practical viability of the completed work as a realized composition. All five dimensions were scored using the same five-point response format. A score of 1 indicated a very weak demonstration of the target dimension, and a score of 5 indicated a very strong demonstration. Half-points were not permitted. All raters used the same criterion order, score anchors, and standardized scoring sheet. The operational definitions and score anchors for all five dimensions are presented in Table 1.
Rater recruitment, blinding, and training
Nine raters with prior experience in music-related or arts-related evaluation were recruited from Jiangxi Institute of Technology. The rater panel included five faculty members from music-related courses, two faculty members from music education, and two senior postgraduate instructors with experience in arts assessment. Each rater had at least three years of teaching, scoring, adjudication, or arts-assessment experience. Each rater was assigned an anonymized code from J1 to J9. All raters scored the same anonymized corpus of 80 compositions. Raters were blinded to student identity, demographic information, class membership, and all other raters’ scores throughout the formal scoring phase.
Before formal scoring, all raters completed one standardized training and calibration session lasting approximately 120 min. During the session, the research team distributed the written rubric, score anchors, standardized scoring sheet, and scoring instructions. The five criteria and the five response categories were explained in the same fixed order used during formal scoring. Three anonymized calibration compositions were then used for practice scoring. These three calibration compositions were independent of the 80 formal study compositions and were not included in the analytic dataset. Each rater scored the three calibration works independently before discussion. Discrepancies were reviewed criterion by criterion to clarify the meaning of each dimension, the distinction between adjacent score categories, and the use of the full five-point scale. The purpose of the calibration session was to standardize the interpretation of the rubric, not to force identical scores. The training workflow and calibration procedure are presented in Supplementary Table 2.
Formal scoring procedure
During formal scoring, each rater independently evaluated every anonymized composition on all five criteria. Raters reviewed both the PDF score file and the accompanying MP3 audio rendering for each work. PDF files were opened in PDF reader software, and audio files were reviewed in Audacity using Sennheiser HD 280 Pro headphones on the same workstation type used for scoring administration. Raters were instructed to review the score file first, listen to the full audio rendering once, and then complete criterion-level scoring after a second focused review when needed. Repeat listening was permitted up to two additional times for any composition when the rater needed to verify details of rhythm, melody, structure, or realization. Raters were not allowed to discuss individual submissions during formal scoring, and no rater had access to the scores assigned by other raters.
The 80 anonymized compositions were presented to each rater in a randomized order generated before scoring. Each rater used the same anonymized set of files, rubric, scoring sheet, and scoring instructions. Formal scoring was completed individually in one to three sessions per rater, and no single scoring session exceeded 3 hr. When scoring was completed across multiple sessions, the same scoring environment, file set, and response sheet were used. Each composition had 45 expected rating opportunities, corresponding to nine raters multiplied by five criteria. With 80 compositions included in the final corpus, the rating design generated 3,600 expected rating opportunities before missing-rating checks.
Data entry, coding structure, and quality control
After formal scoring, all observed ratings were entered into a long-format analytic dataset using Microsoft Excel. The many-facet Rasch design included three facets: students, raters, and criteria. Students were coded as S1 to S80, raters as J1 to J9, and criteria as C1 to C5. The criteria were coded as C1 for novelty, C2 for fluency, C3 for flexibility, C4 for precision, and C5 for feasibility. Each valid scoring record represented one observed student-by-rater-by-criterion rating and contained student_id, rater_id, criterion_id, criterion_name, and score. Valid score categories were recorded as integers from 1 to 5 only.
Before model fitting, the dataset was checked for duplicate records, missing identifiers, missing scores, invalid student codes, invalid rater codes, invalid criterion codes, mismatches between criterion_id and criterion_name, and scores outside the allowed range. The full design generated 3,600 expected rating opportunities. The final analytic file contained 3,598 valid observed ratings and two missing rating opportunities. The two missing ratings were documented as missing, were not imputed, and were not recoded into any valid score category. Duplicate records and coding inconsistencies were checked against the original scoring sheets before model estimation. The required variable structure and coding format are presented in Supplementary Table 3.
Many-facet Rasch model specification
The cleaned rating data were analyzed using FACETS, version 3.83.6. The model simultaneously estimated student creative performance, criterion difficulty, rater score-use location, and rating-scale category thresholds on a common logit scale. Students were specified as the target measurement facet, criteria as the difficulty facet, and raters as the rater facet. The FACETS control file specified three facets, with student labels S1–S80, criterion labels C1–C5, and rater labels J1–J9. A common five-category rating-scale model was applied across all five criteria because all criteria used the same ordered 1–5 response structure. The model was estimated using joint maximum-likelihood estimation. No external anchor values were applied. The student and criterion facets were centered for reporting on the common logit scale, and the rater facet was freely estimated to represent variation in rater score use across raters. The FACETS control-file structure, facet coding, rating-scale setting, estimation method, centering rule, convergence rule, output requests, and diagnostic thresholds are summarized in Supplementary Table 4.
The model was specified as follows:

Where Pnijk denotes the probability that student n receives category k from rater j on criterion i rather than category k − 1, Bn denotes the estimated creative-performance measure of student n, Di denotes the difficulty of criterion i, Rj denotes the rater score-use location of rater j, and Fk denotes the threshold between adjacent score categories. Score categories were ordered from 1 to 5. In this parameterization, higher rater locations correspond to greater use of scores in the FACETS output. The initial model was fitted to the available valid ratings without collapsing categories. Missing ratings were treated as missing, not imputed or recoded into score categories.
The FACETS analysis was run with a maximum of 100 iterations and a convergence criterion of less than 0.01 logits for the maximum change in parameters between consecutive iterations. The output specifications included facet summary statistics, individual facet measures, model standard errors, infit and outfit mean-square statistics, observed averages, fair averages, separation and reliability indices, chi-square tests, category statistics, Rasch-Andrich thresholds, threshold standard errors, category probability output, standardized residuals, rater-by-criterion bias output, and student-by-criterion bias output. The FACETS control file, de-identified long-format rating dataset, primary model output, and sensitivity-analysis output were retained as reproducible analysis files.
Evaluation and diagnostic rules
Infit mean-square and outfit mean-square statistics were used to assess model fit for students, criteria, and raters. Values from 0.60 to 1.30 were treated as the primary acceptable range for routine interpretation. Values above 1.50 were flagged for review, and values above 2.00 were treated as substantial misfit. For any student with infit or outfit mean-square values above 2.00, the original scoring records were checked against the cleaned dataset, and the model was re-estimated after excluding that student as a sensitivity analysis. Cases were not removed from the primary model only because of misfit; sensitivity analysis was used to determine whether the main criterion, rater, and rating-scale conclusions remained stable. These fit-review and sensitivity-analysis rules are listed in Supplementary Table 4.
Separation and reliability indices were examined for each facet to determine whether meaningful internal differentiation was present and whether the resulting measures were sufficiently stable for interpretation. Separation values greater than 2.00 were interpreted as supporting substantial differentiation within a facet. Student separation below 2.00 was interpreted as supporting broad stratification rather than precise individual ranking. Reliability values closer to 1.00 were interpreted as indicating stronger measurement stability. Rating-scale functioning was examined using category statistics, observed averages, outfit mean-square values, Rasch-Andrich thresholds, threshold standard errors, and category probability curves. Category performance was judged acceptable when observed averages increased monotonically across score categories, adjacent thresholds advanced in ordered sequence, and the five categories formed interpretable probability regions across the latent continuum.
Bias and interaction output were inspected for rater-by-criterion and student-by-criterion combinations. Any interaction with an absolute standardized bias t value of 2.00 or greater was flagged for review. These diagnostic checks were used to identify possible inconsistencies in criterion interpretation or unexpected response patterns, not to automatically remove ratings. Local dependence and construct overlap were examined by reviewing criterion fit and residual associations among all 10 possible criterion pairs. Any residual association of 0.30 or greater between two criteria was flagged as possible local dependence and reviewed against the rubric definitions. These diagnostic criteria are also reported in Supplementary Table 4. The unidimensional Rasch specification was therefore evaluated as a measurement assumption rather than assumed automatically. When interpreting student measures, individual logit differences were not treated as meaningful unless they exceeded the corresponding measurement uncertainty. The student facet was interpreted primarily as an overall distribution of compositional creative performance rather than as a precise ranking of individual students.
Results
Overall facet summary
The many-facet Rasch analysis was based on a complete rating design involving 80 anonymized compositions, nine raters, and five scoring criteria. This design generated 3,600 expected rating opportunities. Of these, 3,598 valid observed ratings were analyzed, and two rating opportunities were documented as missing. The missing ratings were neither imputed nor recoded into any valid score category. The overall facet statistics are presented in Table 2. Across the three modeled facets, the mean infit and outfit mean-square values were close to 1.00, supporting an acceptable overall model-data fit. Reliability estimates were 0.87 for criteria, 1.00 for raters, and 0.78 for students. Separation values were 2.56 for criteria, 16.36 for raters, and 1.86 for students. Chi-square tests were significant for all three facets. The criterion facet and student facet were centered at 0.00 logits for reporting, while the rater facet had a mean measure of 0.62 logits. Student measures ranged from -0.80 to 1.12 logits, giving an estimated range of 1.92 logits.
Rater-measure variation
Rater estimates are shown in Table 2. Infit mean-square values ranged from 0.73 to 1.26, and outfit mean-square values ranged from 0.74 to 1.27. All nine raters were within the acceptable fit range of 0.60 to 1.30. The rater facet showed the widest spread among the modeled facets, indicating clear rater score-use variation even though all raters used the same rubric, scoring sheet, and scoring procedure. J9 had the highest rater-measure location at 3.37 logits, whereas J8 had the lowest rater-measure location at -0.34 logits. This direction was consistent with the observed and fair averages: J9 had the highest observed and fair averages, 4.74 and 4.75, whereas J8 had the lowest observed and fair averages, both 2.77. The rater facet was therefore interpreted as variation in the location of score use on the shared logit scale rather than as a simple severity ranking. J1 and J5 had identical estimates of 0.86 logits, J3 and J6 had identical estimates of -0.13 logits, and J2 and J4 were located near the center of the rater scale at 0.03 and -0.15 logits, respectively. The total rater-measure spread was 3.71 logits. The rater separation value was 16.36, with a chi-square value of 1487.8 (df = 8), p < 0.001. No rater exceeded the fit-review threshold, and no rater was excluded from the primary model.
Criterion difficulty and criterion fit
Criterion difficulty estimates are presented in Table 2. Feasibility had the greatest difficulty estimate at 0.20 logits, indicating that it was the most difficult criterion for students to demonstrate within the completed compositions. Flexibility and precision were located in the middle range, with estimates of 0.07 and 0.02 logits, respectively. Fluency had a difficulty estimate of -0.13 logits, and novelty had the lowest difficulty estimate at -0.16 logits, indicating that novelty was the easiest criterion to demonstrate in this corpus. The total criterion-difficulty spread was 0.36 logits. All five criteria showed acceptable fit values. Infit mean-square values ranged from 0.89 to 1.11, and outfit mean-square values ranged from 0.90 to 1.12. The criterion separation value was 2.56, and the chi-square value was 37.8, df = 4, p < 0.001. No criterion exceeded the fit-review threshold, and no criterion was removed from the model.
Student creative-performance distribution and fit review
Student measures are summarized in Table 2 as an overall distribution rather than as individual rankings. The student facet showed a separation value of 1.86 and a reliability estimate of 0.78. The chi-square value was 354.4 (df = 79), p < 0.001. Estimated student measures ranged from -0.80 to 1.12 logits, with model standard errors of approximately 0.19 to 0.20 logits. Because the student separation value was below 2.00, student results were interpreted as supporting broad performance stratification rather than precise individual ranking.
Student fit statistics were reviewed using the defined fit thresholds. S3 had an infit mean-square of 2.10 and an outfit mean-square of 2.05, exceeding the substantial-misfit threshold. The original scoring records for S3 were checked against the cleaned analytic dataset, including student code, rater code, criterion code, criterion name, score category, duplicate-record status, and missing-rating status. No data-entry error, duplicated record, invalid score, missing-rating mismatch, or coding inconsistency was found. S3 was therefore retained in the primary model. A sensitivity model was then estimated, excluding S3, to determine whether the main model's conclusions remained stable. This sensitivity model included 79 compositions and 3,555 expected rating opportunities. The number of valid analyzed ratings in the sensitivity model was 3,553. In the sensitivity model, feasibility remained the most difficult criterion at 0.19 logits, and novelty remained the least difficult criterion at -0.15 logits. Criterion separation changed from 2.56 to 2.48, criterion reliability changed from 0.87 to 0.86, rater separation changed from 16.36 to 16.02, rater reliability remained 1.00, student separation changed from 1.86 to 1.82, and student reliability changed from 0.78 to 0.77. Rating-scale thresholds remained ordered, changing from -2.10, -0.71, 0.69, and 2.12 logits in the primary model to -2.08, -0.70, 0.68, and 2.10 logits in the sensitivity model. These changes did not alter the main criterion, rater, student, or rating-scale conclusions. The sensitivity analysis results are presented in Table 3.
Local dependence and bias diagnostics
Local dependence diagnostics were reviewed for all 10 possible criterion pairs among the five scoring criteria. All residual associations were below the 0.30 review threshold. The largest residual association was 0.24 between precision and feasibility. The next largest associations were 0.21 between fluency and flexibility, 0.18 between novelty and fluency, and 0.17 between novelty and flexibility. The remaining six criterion-pair residual associations were also below 0.30 and are reported in Table 4. These results did not indicate problematic local dependence among the five rubric criteria.
Rater-by-criterion bias output was inspected using the absolute standardized bias t-value threshold of 2.00. The largest rater-by-criterion standardized bias t value was 1.84 for J9 on feasibility, which was below the review threshold. Student-by-criterion output identified an unexpected response pattern for S3. The largest student-by-criterion standardized bias t-value was 2.31 for S3 on feasibility, exceeding the review threshold. The S3 case was therefore checked against the original scoring records and examined through sensitivity analysis. The verification found no coding or entry error, and the sensitivity model did not change the substantive conclusions. The local dependence and bias diagnostics are summarized in Table 4.
Rating-scale functioning
The category structure results are shown in Table 5. Mean measures increased from -0.56 logits in category 1 to 2.23 logits in category 5, indicating that higher-scoring categories corresponded to higher estimated creative-performance locations. Outfit mean-square values for the scored categories ranged from 0.90 to 1.10. Rasch-Andrich thresholds advanced in the order -2.10, -0.71, 0.69, and 2.12 logits. The transition from category 1 to category 2 occurred at approximately -2.10 logits, the transition from category 2 to category 3 occurred near -0.71 logits, the transition from category 3 to category 4 occurred near 0.69 logits, and the transition from category 4 to category 5 occurred near 2.12 logits. The ordered thresholds and acceptable outfit values supported retention of the original five-category structure. No category was collapsed.
Distribution of facets and category probability structure
The joint distribution of raters, students, criteria, and response categories on the common logit scale is shown in Figure 2. The rater facet showed the widest spread, reflecting clear variation in the location of rater score use. The criterion facet placed novelty at the lowest difficulty level and feasibility at the greatest difficulty level. Student measures were concentrated around the center of the scale, with fewer cases at the upper and lower extremes. The ruler map was used to show the distribution of facet measures and not to support precise individual student rankings.
The category probability curves are presented in Figure 3. Category 1 showed its highest probability below approximately -2.10 logits, category 2 reached its peak between approximately -2.10 and -0.71 logits, category 3 peaked between approximately -0.71 and 0.69 logits, category 4 showed its highest probability between approximately 0.69 and 2.12 logits, and category 5 became dominant above approximately 2.12 logits. The vertical threshold markers in Figure 3 indicate the Rasch-Andrich transition points between adjacent categories. Adjacent categories transitioned in an ordered sequence, supporting the interpretation that the five-point scale functioned as intended.
Data Availability:
The de-identified long-format rating dataset, data codebook, and FACETS primary output have been deposited in Zenodo under DOI: https://doi.org/10.5281/zenodo.21873801. The dataset contains coded student identifiers, rater identifiers, criterion identifiers, criterion names, valid integer score categories, and missing-rating indicators. The full rating design contained 3,600 expected rating opportunities. Of these, 3,598 valid observed ratings were analyzed; two were documented as missing and not imputed. The deposited FACETS primary output supports the reported facet measures, fit statistics, separation and reliability indices, rating-scale thresholds, category functioning, and diagnostic summaries. Original creative works and identifiable files are not publicly available because participant consent and institutional privacy restrictions do not permit redistribution of individual student compositions or files that could contain authorship information. The many-facet Rasch analysis was performed using FACETS, version 3.83.6.
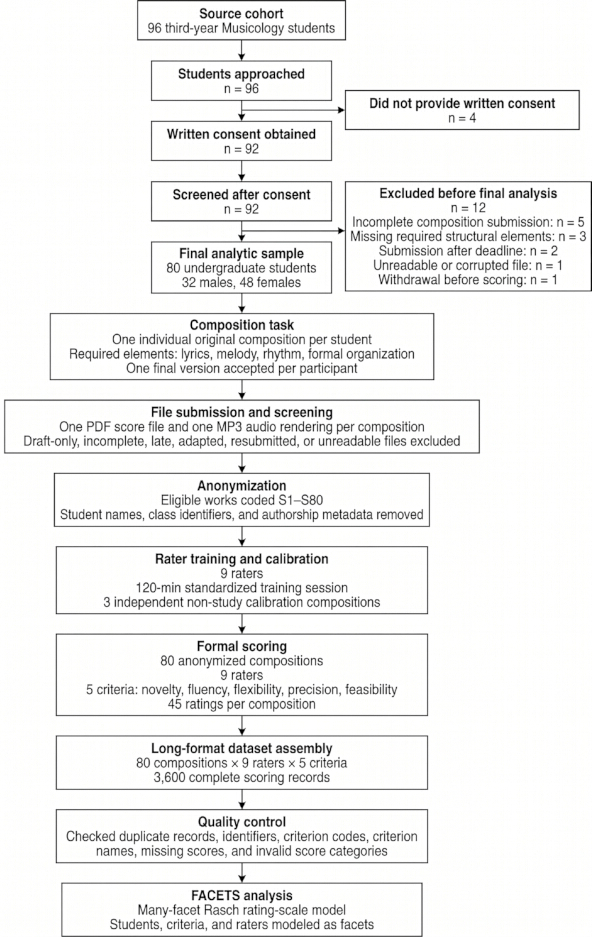
Figure 1: Workflow of participant recruitment, task administration, anonymization, scoring, data checking, and many-facet Rasch analysis. This figure shows the complete study workflow from source cohort identification to final model analysis. The source cohort included 96 third-year Musicology students. All 96 students were approached; four did not provide written consent, 92 were screened, and 12 were excluded before final analysis. The final analytic sample comprised 80 anonymized, scoreable compositions. The figure also summarizes task assignment, file submission, screening, anonymization, rater training, formal scoring, long-format data assembly, quality control, and FACETS analysis. The rating design generated 3,600 expected rating opportunities; of these, 3,598 valid observed ratings were analyzed, and two were documented as missing. Please click here to view a larger version of this figure.
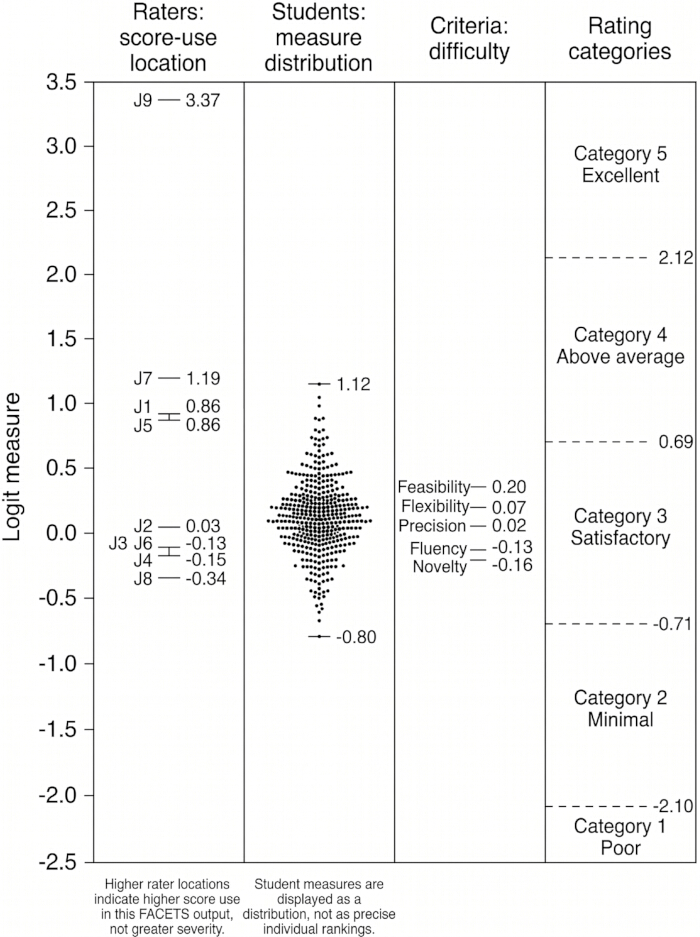
Figure 2: Vertical ruler map of raters, students, criteria, and rating-scale categories on the common logit metric. This figure displays rater score-use locations, student-measure distribution, criterion difficulty estimates, and response-category locations on a shared logit scale. Higher rater locations in this output correspond to higher score use, not greater severity. The ruler map is used to display the distribution of facets and is not used to support precise rankings of individual students. Please click here to view a larger version of this figure.
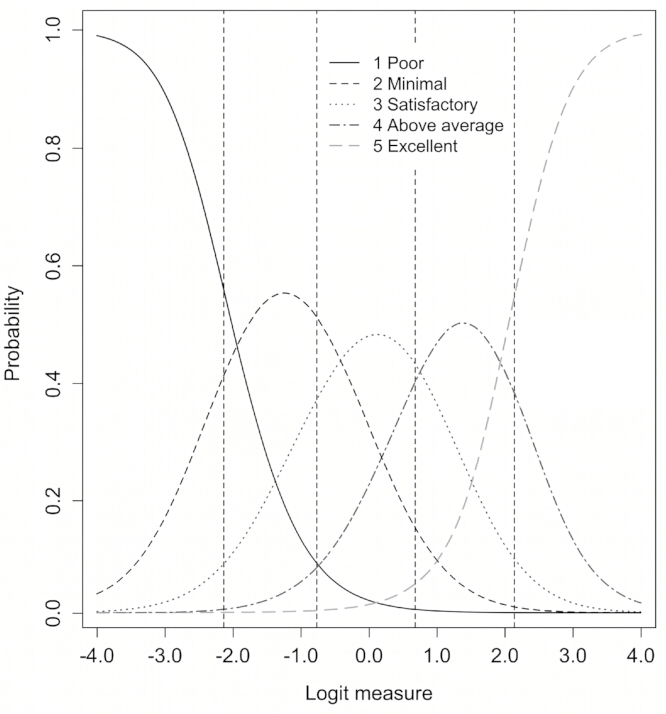
Figure 3: Category probability curves for the five-point rating scale. The vertical dashed lines indicate the Rasch-Andrich category thresholds, which mark the estimated transition points between adjacent response categories. The ordered intersections of adjacent categories show that the five-point response scale functioned in the expected direction and supports retention of the original category structure without collapsing categories. Please click here to view a larger version of this figure.
| Criterion | Operational definition | Score 1 | Score 2 | Score 3 | Score 4 | Score 5 |
| Novelty | Distinctiveness and originality of the musical idea or treatment | Conventional or imitative | Limited originality | Some originality but uneven | Clear originality in several parts | Highly distinctive and consistently original |
| Fluency | Continuity and productivity of idea development within the work | Very limited development | Sparse development | Adequate development | Rich and sustained development | Highly productive and continuously developed |
| Flexibility | Use of varied approaches, transformations, or adaptive shifts in musical handling | Single rigid approach | Minimal variation | Some variation | Clear variation across sections or devices | Strongly varied and adaptively developed |
| Precision | Refinement, internal organization, and concreteness of musical detail | Weak control and unclear detail | Limited refinement | Moderate organization and detail | Good refinement and internal organization | High refinement with clear and concrete detail |
| Feasibility | Artistic and practical viability of the completed composition as a realized work | Not viable as a finished work | Weak viability | Basically viable | Viable and musically workable | Strongly viable and convincingly realized |
Table 1: Operational definitions and score anchors for the five dimensions of creative behavior in compositional works. This table presents the final rubric used for formal scoring. It defines novelty, fluency, flexibility, precision, and feasibility, and provides score anchors from 1 to 5 for each criterion. The definitions distinguish sustained idea development from adaptive variation and distinguish structural refinement from realized artistic and practical viability.
| Facet / Unit | Measure (logits) | Model SE | Infit MnSq | Outfit MnSq | Observed average | Fair average | Separation | Reliability | Chi-square (df) |
| Criteria, overall | 0 | 0.05 | 0.99 | 0.99 | 3.36 | 3.43 | 2.56 | 0.87 | 37.8 (4)*** |
| Novelty | -0.16 | 0.05 | 1.01 | 1.07 | 3.46 | 3.54 | — | — | — |
| Fluency | -0.13 | 0.05 | 1 | 0.95 | 3.44 | 3.52 | — | — | — |
| Flexibility | 0.07 | 0.05 | 0.89 | 0.93 | 3.32 | 3.39 | — | — | — |
| Precision | 0.02 | 0.05 | 0.95 | 0.9 | 3.35 | 3.42 | — | — | — |
| Feasibility | 0.2 | 0.05 | 1.11 | 1.12 | 3.23 | 3.3 | — | — | — |
| Raters, overall | 0.62 | 0.07 | 0.98 | 0.99 | 3.36 | 3.36 | 16.36 | 1 | 1487.8 (8)*** |
| J1 | 0.86 | 0.06 | 1.26 | 1.27 | 3.59 | 3.59 | — | — | — |
| J2 | 0.03 | 0.06 | 1.1 | 1.1 | 3.02 | 3.02 | — | — | — |
| J3 | -0.13 | 0.06 | 0.73 | 0.74 | 2.91 | 2.91 | — | — | — |
| J4 | -0.15 | 0.06 | 1.07 | 1.07 | 2.9 | 2.9 | — | — | — |
| J5 | 0.86 | 0.06 | 1.26 | 1.27 | 3.59 | 3.59 | — | — | — |
| J6 | -0.13 | 0.06 | 0.73 | 0.74 | 2.91 | 2.91 | — | — | — |
| J7 | 1.19 | 0.06 | 0.77 | 0.77 | 3.8 | 3.81 | — | — | — |
| J8 | -0.34 | 0.06 | 1.06 | 1.06 | 2.77 | 2.77 | — | — | — |
| J9 | 3.37 | 0.11 | 0.87 | 0.93 | 4.74 | 4.75 | — | — | — |
| Students, overall | 0 | 0.19 | 0.99 | 0.99 | 3.36 | 3.43 | 1.86 | 0.78 | 354.4 (79)*** |
| Student measure range | -0.80 to 1.12 | 0.19–0.20 | — | — | — | — | — | — | — |
| NOTE: The rating design generated 3,600 expected rating opportunities, calculated as 80 compositions x 9 raters x 5 criteria. The primary model analyzed 3,598 valid observed ratings; two rating opportunities were missing and were not imputed or recoded into score categories. For the rater facet, rater measures are interpreted here as rater score-use locations on the shared logit scale. In this output, higher rater measures were associated with higher observed and fair averages, indicating a tendency toward greater use of higher scores rather than greater severity. ***= p < 0.001. | |||||||||
Table 2: Summary statistics of the many-facet Rasch analysis for criteria, raters, and students. This table reports the main FACETS output for the three modeled facets, including logit measures, model standard errors, infit and outfit mean-square values, observed averages, fair averages, separation indices, reliability estimates, and chi-square tests. The rating design generated 3,600 expected rating opportunities; 3,598 valid observed ratings were analyzed, and two rating opportunities were documented as missing. Criterion difficulty, rater score-use location, and the overall student-measure distribution are reported on the same logit metric. Rater measures are interpreted as score-use locations rather than as a simple severity ranking because higher rater measures were accompanied by higher observed and fair averages. Student results are summarized as a distribution and are not presented as precise individual rankings.
| Metric | Primary model | Sensitivity model excluding S3 |
| Number of compositions | 80 | 79 |
| Expected rating opportunities | 3,600 | 3,555 |
| Valid rating records analyzed | 3,598 | 3,553 |
| Missing rating opportunities | 2 | 2 |
| Criterion with highest difficulty | Feasibility, 0.20 logits | Feasibility, 0.19 logits |
| Criterion with lowest difficulty | Novelty, -0.16 logits | Novelty, -0.15 logits |
| Criterion separation | 2.56 | 2.48 |
| Criterion reliability | 0.87 | 0.86 |
| Rater separation | 16.36 | 16.02 |
| Rater reliability | 1 | 1 |
| Student separation | 1.86 | 1.82 |
| Student reliability | 0.78 | 0.77 |
| Rating-scale thresholds | -2.10, -0.71, 0.69, 2.12 | -2.08, -0.70, 0.68, 2.10 |
| Primary-model decision | Primary model retained | No substantive change |
| NOTE: The primary model used 3,598 valid observed ratings from 3,600 expected rating opportunities. The sensitivity model excluded S3 and used 3,553 valid observed ratings from 3,555 expected rating opportunities. The same two missing rating opportunities were outside S3 and therefore remained missing in the sensitivity model. Excluding S3 did not substantively change the criterion order, separation indices, reliability estimates, or rating-scale threshold structure. | ||
Table 3: Sensitivity analysis after excluding the misfitting student case. This table compares the primary model with the sensitivity model estimated after excluding S3. The primary model used 80 compositions, 3,600 expected rating opportunities, and 3,598 valid observed ratings. The sensitivity model used 79 compositions, 3,555 expected rating opportunities, and 3,553 valid observed ratings. The table reports changes in criterion difficulty, criterion separation, criterion reliability, rater separation, rater reliability, student separation, student reliability, and rating-scale thresholds. The sensitivity analysis showed no substantive change in the main model conclusions.
| Diagnostic item | Review threshold | Largest observed value / observed value | Review outcome |
| Residual association: novelty–fluency | ≥0.30 | 0.18 | Below threshold |
| Residual association: novelty–flexibility | ≥0.30 | 0.17 | Below threshold |
| Residual association: novelty–precision | ≥0.30 | 0.12 | Below threshold |
| Residual association: novelty–feasibility | ≥0.30 | 0.09 | Below threshold |
| Residual association: fluency–flexibility | ≥0.30 | 0.21 | Below threshold |
| Residual association: fluency–precision | ≥0.30 | 0.16 | Below threshold |
| Residual association: fluency–feasibility | ≥0.30 | 0.14 | Below threshold |
| Residual association: flexibility–precision | ≥0.30 | 0.15 | Below threshold |
| Residual association: flexibility–feasibility | ≥0.30 | 0.11 | Below threshold |
| Residual association: precision–feasibility | ≥0.30 | 0.24 | Below threshold |
| Rater-by-criterion standardized bias t value | ≥2.00 absolute value | 1.84 for J9 on feasibility | Below threshold |
| Student-by-criterion standardized bias t value | ≥2.00 absolute value | 2.31 for S3 on feasibility | Reviewed through original-record verification and sensitivity analysis |
| Data-entry verification for S3 | Any coding or entry error | None found | S3 retained in the primary model |
| Sensitivity analysis excluding S3 | Change in main model conclusions | No substantive change | Primary model retained |
| NOTE: All 10 criterion-pair residual associations were reviewed. Values below 0.30 were interpreted as not indicating problematic local dependence among the five rubric criteria. Rater-by-criterion and student-by-criterion interactions were reviewed using an absolute standardized bias t-value threshold of 2.00. | |||
Table 4: Local dependence and bias diagnostic checks. This table summarizes diagnostic checks for criterion overlap, rater-by-criterion bias, student-by-criterion unexpected response patterns, and verification of the misfitting student case. All 10 possible criterion-pair residual associations were reviewed. Residual associations among criteria were below the review threshold of 0.30. The largest rater-by-criterion standardized bias t value was below the review threshold of |t| ≥ 2.00, whereas the student-by-criterion output identified an S3-related unexpected response pattern that was reviewed through original-record verification and sensitivity analysis. The sensitivity analysis showed no substantive change in the main model conclusions.
| Rating category | Category label | Mean measure (logits) | Outfit MnSq | Rasch-Andrich threshold | Threshold SE | Measure at -0.5 |
| 1 | Poor | -0.56 | 1 | — | — | — |
| 2 | Minimal | -0.21 | 0.9 | -2.1 | 0.1 | -2.51 |
| 3 | Satisfactory | 0.25 | 0.9 | -0.71 | 0.05 | -0.73 |
| 4 | Above average | 0.8 | 1.1 | 0.69 | 0.04 | 0.72 |
| 5 | Excellent | 2.23 | 1.1 | 2.12 | 0.06 | 2.53 |
| NOTE: Rasch-Andrich thresholds indicate the estimated transition points between adjacent rating categories. No threshold is reported for category 1 because it is the lowest category. “Measure at -0.5” reports the logit location associated with the category boundary output in FACETS and is included as a category-functioning diagnostic rather than as a separate student-performance estimate. No category was collapsed. | ||||||
Table 5: Category functioning of the five-point rating scale. This table reports category-level statistics for the five-point response scale, including mean measures, outfit mean-square values, Rasch-Andrich thresholds, threshold standard errors, and the FACETS “Measure at -0.5” category-functioning output. Rasch-Andrich thresholds indicate the estimated transition points between adjacent rating categories. The ordered thresholds show that the five response categories advanced in the expected direction, and no category was collapsed.
Supplementary Table 1: Composition task requirements, recruitment flow, and submission specifications. This table presents the study setting, recruitment flow, participant eligibility criteria, task format, required structural elements, originality rules, submission requirements, screening rules, exclusion reasons, and final analytic unit. It documents how the final corpus of 80 anonymized and scoreable compositions was obtained. Please click here to download this file.
Supplementary Table 2: Rater training, calibration, and standardized scoring procedure. This table summarizes rater recruitment, rater qualifications, anonymized rater coding, training materials, rubric briefing, category briefing, calibration scoring, discrepancy review, blinding procedures, scoring restrictions, review materials, playback procedure, repeat-listening rule, randomized order of presentation, and scoring-duration control. Please click here to download this file.
Supplementary Table 3: Long-format dataset structure and coding rules. This table presents the variable structure, coding rules, dataset constraints, criterion codes, and example rows for the long-format analytic dataset. Each valid row represents one observed scoring event defined by student identifier, rater identifier, criterion identifier, criterion name, and score category. The rating design generated 3,600 expected rating opportunities, of which 3,598 valid observed ratings were analyzed, and two rating opportunities were documented as missing. Please click here to download this file.
Supplementary Table 4: FACETS control-file and diagnostic specifications. This table reports the FACETS model structure and reproducibility settings, including software version, model type, modeled facets, score categories, missing-rating handling, estimation method, maximum iterations, convergence criterion, output requests, fit thresholds, bias-review threshold, local-dependence threshold, and student-measure interpretation rule. Missing ratings were treated as missing, were not imputed, and were not recoded into valid score categories. Please click here to download this file.
Discussion
The present study applied a many-facet Rasch framework to assess creative behavior in undergraduate music majors through original compositional works. The results showed that student performance, criterion difficulty, rater-measure variation, and rating-scale category functioning could be estimated within a common measurement structure. This finding supports the use of many-facet modeling in rubric-based music assessment when scores are produced through expert judgment rather than through purely objective responses11. The model did not remove the need for expert musical evaluation; instead, it provided a structured way to examine how student, criterion, and rater facets contributed to observed ratings. This is important for composition assessment because completed works require qualitative judgment, but raw scores alone cannot indicate whether variation in scores reflects the student, the criterion, the rater, or the rating scale12.
The criterion results showed that novelty was the least difficult criterion, whereas feasibility and flexibility were more difficult within the completed compositions. This pattern should be interpreted as a descriptive measurement result, not as evidence of a causal instructional effect. The finding indicates that, in this corpus, students more readily demonstrated distinctive musical ideas than fully realized viability or adaptive transformation across the completed work. This distinction is consistent with music-creativity research that treats composition as a process involving idea generation, development, selection, restructuring, refinement, and realization rather than originality alone13. It also supports the value of separating rubric dimensions rather than collapsing creative performance into a single global judgment14. However, the present study cannot determine whether the observed difficulty pattern was caused by teaching practices, task design, students’ developmental stage, criterion wording, or rater interpretation. Future studies should combine product ratings with process evidence such as drafts, revision histories, reflective logs, or composition interviews to examine how students move from initial ideas to realized musical products.
The rater results showed substantial rater-measure variation, while all rater fit values remained within the defined acceptable range. This pattern should not be interpreted simply as a failure of rater training. Differences in rater score use are expected in expert-mediated artistic assessment and are one of the main reasons for using a many-facet Rasch model15. The present results show that the raters used the scale in a broadly acceptable manner, while still differing in their relative use of score categories. The model, therefore, helped adjust for rater-related variation in scores before criterion and student measures were interpreted. For future applications, rater training should be combined with post hoc monitoring of score-use variation, fit, category use, and rater-by-criterion interactions rather than relying on training alone to eliminate all differences among raters16.
The student facet showed measurable variation but only moderate separation. The student reliability estimate was 0.78, and the separation value was 1.86. Therefore, the student measures should be interpreted as supporting broad performance stratification rather than precise individual ranking. This point is important because small differences between individual student logits may be smaller than the corresponding measurement standard errors. The misfitting S3 case further supports cautious interpretation at the individual level. After original-record verification and sensitivity analysis, the main criterion order, rater-measure pattern, and rating-scale threshold structure remained stable. S3 was therefore retained in the primary model, but the study does not draw substantive conclusions from this individual case. This interpretation is consistent with the use of Rasch fit analysis as a diagnostic tool for evaluating measurement stability rather than as a basis for unsupported individual claims17.
The study has several limitations. First, the sample was drawn from a single institution and academic stage, so the findings should not be generalized beyond comparable undergraduate Musicology cohorts without further validation. Second, the study evaluated final compositional products and did not include process materials such as drafts, revision histories, reflective logs, or think-aloud data. Third, the five rubric criteria were treated as related manifestations of overall compositional creative behavior, and the diagnostic results supported this specification in the present dataset; however, future research should examine whether the same structure holds in larger samples, different institutions, and different composition tasks. Fourth, the rater background was modeled only through the rater facet, and the study did not directly test how disciplinary background, teaching experience, aesthetic preference, or composition expertise contributed to rater-measure variation. Finally, the study was cross-sectional and non-interventional, so the criterion-difficulty pattern should not be used to infer teaching effectiveness or instructional causality.
In conclusion, this study demonstrates a reproducible procedure for assessing creative behavior in music majors through original compositional works using a structured rubric and many-facet Rasch measurement. The findings show that criterion difficulty, rater-measure variation, student performance distribution, and rating-scale functioning can be examined within a single measurement framework. Novelty was relatively easier to demonstrate, whereas feasibility and flexibility were more difficult in the completed compositions. Rater-measure variation was substantial, supporting the need to model rater effects in music assessment. Student measures supported broad stratification rather than precise individual ranking. Overall, the framework provides a transparent basis for evaluating composition-based creative behavior and for refining rubric design, rater monitoring, and future validation studies in higher music education.
Disclosures
The authors declare no conflicts of interest. AI-assisted language-editing tools were used only to improve readability and grammar during manuscript preparation. No AI tools were used for data analysis, many-facet Rasch modeling, figure generation, interpretation of results, or scientific decision-making. The authors reviewed and verified all manuscript content and accept full responsibility for the final version.
Acknowledgements
The authors thank the participating students, raters, and administrative staff of the School of Music and Dance at Jiangxi Institute of Technology for their support during task administration, file collection, anonymization, and scoring coordination. This work was supported by the Jiangxi Province Cultural and Artistic Science Planning Project, ‘A Study on the Preservation and Diversified Development of Jinggang Hakka Mountain Songs’ (Project No. YG2020158).
Materials
| Name | Company | Catalog Number | Comments |
|---|---|---|---|
| Adobe Acrobat Reader | Adobe | 26.001.21346 | Used to open and review PDF score files during submission screening and formal scoring. |
| Audacity | Audacity | 3.7.7 | Used to open and review MP3 audio renderings accompanying the submitted compositions. |
| FACETS | Winsteps | 3.83.6 | Used for many-facet Rasch analysis. |
| HD 280 Pro headphones | Sennheiser | 506845 | Closed-back monitoring headphones used for standardized listening during review of submitted audio files. |
| Microsoft 365 Apps for business, including Excel | Microsoft | O365BusinessRetail | Used for score entry, long-format dataset assembly, and data checking before Rasch analysis. |
| Moodle LMS | Moodle | MOODLE_5013 | Used as the institutional learning management system for assignment submission and file collection. |
| MuseScore Studio | MuseScore | 4.6.5 | Used for preparation, notation, and export of original composition files in score-based formats. |
| OptiPlex Tower Plus 7020 Desktop | Dell | QBS1250 | Used as the workstation for file management, scoring administration, and statistical analysis. |
References
- UNESCO. Road Map for Arts Education: Building Creative Capacities for the 21st Century. Paris: UNESCO; 2006.
- Teaching Guidance Committee for Higher Education Institutions, Ministry of Education of the People’s Republic of China. National Standards for Teaching Quality of Undergraduate Major Programs in Regular Higher Education Institutions, Volume II. Beijing: Higher Education Press; 2018.
- Bolden B, DeLuca C. Nurturing student creativity through assessment for learning in music classrooms. Res Stud Music Educ. 2022;44(1):273-289. doi:10.1177/1321103X211054793.
- Escorihuela G, Martínez-Bayona T, Marzal L. Competence-based assessment in higher music education: faculty perceptions in the Valencian Community. Front Educ. 2025;10:1697717. doi:10.3389/feduc.2025.1697717.
- Moura N, Dias P, Veríssimo L, Oliveira-Silva P, Serra S. Solo music performance assessment criteria: a systematic review. Front Psychol. 2024;15:1467434. doi:10.3389/fpsyg.2024.1467434.
- Said-Metwaly S, Van den Noortgate W, Kyndt E. Approaches to measuring creativity: a systematic literature review. Creat Theor Res Appl. 2017;4(2):238-275. doi:10.1515/ctra-2017-0013.
- Uto M. A multidimensional generalized many-facet Rasch model for rubric-based performance assessment. Behaviormetrika. 2021;48:425-457. doi:10.1007/s41237-021-00144-w.
- Tavakol M, Pinner G. Using the many-facet Rasch model to analyse and evaluate the quality of an objective structured clinical examination: a non-experimental cross-sectional design. BMJ Open. 2019;9(9):e029208. doi:10.1136/bmjopen-2019-029208.
- Hung SP, Chen PH, Chen HC. Improving creativity performance assessment: a rater effect examination with many-facet Rasch model. Creat Res J. 2012;24(4):345-357. doi:10.1080/10400419.2012.730331.
- Huang HY. Understanding rater cognition in performance assessment: a mixed IRTree approach. Appl Psychol Meas. 2025;49(7):331-349. doi:10.1177/01466216251333578.
- Ooi PS, Engelhard G Jr. Examining rater judgements in music performance assessment using many-facets Rasch rating scale measurement model. J Appl Meas. 2019;20(1):79-99.
- Eckes T. Introduction to Many-Facet Rasch Measurement: Analyzing and Evaluating Rater-Mediated Assessments. Berlin: Peter Lang; 2015.
- Engelhard G Jr, Wind SA. Invariant Measurement with Raters and Rating Scales: Rasch Models for Rater-Mediated Assessments. New York: Routledge; 2018.
- Hickey M. An application of Amabile’s consensual assessment technique for rating the creativity of children’s musical compositions. J Res Music Educ. 2001;49(3):234-244. doi:10.2307/3345709.
- Schiavio A, Moran N, van der Schyff D, Biasutti M, Parncutt R. Processes and experiences of creative cognition in seven Western classical composers. Music Sci. 2022;26(2):303-325. doi:10.1177/1029864920943931.
- Nijs L, Grinspun N, Fortuna S. Developing musical creativity through movement: navigating the musical affordance landscape. Creat Res J. 2025;37(3):427-451. doi:10.1080/10400419.2023.2299159.
- Zhan Z, He J, Zhong Y. How does problem-solving pedagogy affect creativity? A meta-analysis of empirical studies. Front Psychol. 2024;15:1287082. doi:10.3389/fpsyg.2024.1287082.