This retrospective cohort study found that smart nursing–enabled individualized rehabilitation was associated with better 12-month pain control, paraspinal muscle recovery, functional outcomes, and lower healthcare use than conventional continuing rehabilitation after posterior lumbar fusion; prospective multicenter studies are needed to confirm causality and generalizability.
Research Article
Smart Nursing–Enabled Individualized Rehabilitation is Associated with Improved Outcomes After Posterior Lumbar Fusion: A Retrospective Cohort Study
* These authors contributed equally
In This Article
Summary
Abstract
Lumbar degenerative disease is highly prevalent among older adults, and posterior lumbar fusion is a common surgical treatment. However, chronic postoperative pain, paraspinal muscle atrophy, and related complications frequently impair functional recovery and long-term outcomes. Conventional continuing rehabilitation often relies on delayed responses and standardized management, limiting its ability to address individual recovery needs during home-based rehabilitation. This single-center retrospective comparative cohort study included 117 patients aged ≥60 years who underwent single- or two-level posterior lumbar interbody fusion at the Fourth Affiliated Hospital of Soochow University between January 1, 2024, and January 31, 2025. All patients received standardized perioperative care and baseline rehabilitation guidance before discharge. Post-discharge rehabilitation consisted of either a smart nursing-enabled individualized rehabilitation model delivered through a wearable smart nursing terminal (n = 54) or conventional continuing rehabilitation comprising routine telephone follow-up, outpatient review, and a fixed home rehabilitation program (n = 63). The smart nursing model incorporated standardized stepwise rehabilitation with individualized adjustments, real-time monitoring, graded alert-triggered interventions, and continuous supervision throughout the 12-month recovery period. The primary outcome was the between-group difference in the change in activity-related Numerical Rating Scale (NRS) pain score from baseline to 12 months. Group-by-time analysis showed a greater reduction in activity-related NRS scores in the smart nursing group than in the control group (interaction estimate: −1.10 points; 95% CI: −1.50 to −0.69; P < 0.001). At 12 months, the smart nursing group also demonstrated lower resting NRS scores (1.87 ± 0.80 vs 2.87 ± 0.77), greater erector spinae cross-sectional area (14.20 cm2 ± 1.13 cm2 vs 12.19 cm2 ± 0.56 cm2), higher maximum isometric paraspinal torque (82.84 Nm ± 7.58 Nm vs 66.75 Nm ± 4.57 Nm), and a lower incidence of chronic postsurgical pain (16.67% vs 63.49%) (all q < 0.001). Differences in fusion and complication outcomes were examined in an exploratory manner. Smart nursing-enabled individualized rehabilitation was associated with improved 12-month outcomes, although the retrospective, nonrandomized design precludes causal inference.
Introduction
Lumbar degenerative disease is a major cause of impaired mobility and reduced quality of life in older adults. Among individuals aged 60 years and above, the prevalence of symptomatic lumbar degenerative disease has reached 58.2%, and 27.4% of these patients eventually undergo surgical procedures such as lumbar decompression and fusion because conservative treatment fails to produce satisfactory results1. Surgery can quickly relieve neural compression and restore spinal stability. However, chronic persistent pain after surgery, paraspinal muscle atrophy, and loss of muscle strength remain common problems in elderly patients and continue to influence long-term rehabilitation outcomes2. Previous reports have shown that the incidence of chronic pain after lumbar surgery ranges from 12% to 38%. In patients over 65 years of age, more than 52% still do not recover paraspinal muscle strength to the preoperative baseline by 12 months after surgery. This not only delays the recovery of daily activity but also increases the risks of recurrent spinal injury, falls, and unplanned readmission, thereby imposing a sustained disease burden3,4.
Traditional continuing rehabilitation mainly depends on pre-discharge education, printed rehabilitation manuals, scheduled telephone follow-up, and outpatient review. In elderly patients, however, this approach is often undermined by cognitive decline, poor adherence to home-based rehabilitation, and difficulty returning for follow-up visits. Under these constraints, supervision after discharge is frequently delayed or interrupted, and it becomes difficult to achieve either dynamic pain control or precise intervention for muscle recovery5. Most previous studies have centered on optimization of in-hospital perioperative nursing pathways6 or on a single form of online follow-up intervention7. What remains lacking is a full-course rehabilitation management strategy that truly matches the physiological characteristics of older adults and the course of postoperative recovery. The overall impact of dynamically adjusting individualized rehabilitation plans on long-term outcomes has also not been clearly established. With the rapid development of mobile health technology and wearable intelligent devices, smart nursing–linked continuing rehabilitation has gradually entered a range of clinical settings, including chronic disease management and postoperative recovery. Because it allows real-time data collection, remote dynamic supervision, and timely adjustment of individualized plans, this model helps overcome the temporal and spatial limitations of traditional nursing and is becoming an important direction in post-discharge rehabilitation management8,9.
Recent reviews suggest that telemedicine and wearable systems can facilitate follow-up and remote functional assessment after spine surgery; however, monitoring methods, intervention intensity, and outcome reporting remain heterogeneous, and comparative evidence for a closed-loop, nurse-led rehabilitation model after lumbar fusion is still limited7,8,9. Against this background, we examined whether receipt of this rehabilitation model was associated with chronic pain, paraspinal muscle recovery, lumbar function, psychological status, and 12-month clinical outcomes among older patients undergoing posterior lumbar fusion. The aim was to provide real-world evidence for the development of a full-course continuing rehabilitation nursing system for elderly patients after lumbar surgery. Such observational evidence may inform the design of prospective studies evaluating long-term postoperative complications and quality of life.
Protocol
The study was approved in 2022 by the Ethics Committee of the Fourth Affiliated Hospital of Soochow University (approval No. 220083) and was conducted in accordance with the Declaration of Helsinki. Because the retrospective analysis used previously collected and de-identified clinical and follow-up data without introducing any additional intervention or data-collection procedure, the Ethics Committee formally waived the requirement for additional written informed consent for the retrospective research analysis. Before entering the smart nursing program, each participant had provided written clinical consent for the use of the wearable rehabilitation terminal, remote monitoring, transmission, and clinical storage of health data, and video-based rehabilitation guidance.
Study design
This was a single-center retrospective comparative cohort study in which receipt of smart nursing–enabled individualized rehabilitation was treated as the exposure and conventional continuing rehabilitation as the comparator. Allocation was nonrandomized and was not determined solely by the treatment period. Following routine discharge counseling, the patient and treating team jointly selected the rehabilitation approach based on the patient's preference, willingness, and ability to use remote monitoring; availability of caregiver assistance; clinical suitability; and availability of the wearable rehabilitation terminal. Patients who selected and were able to undertake terminal-supported rehabilitation entered the smart nursing group, whereas patients who selected routine follow-up or for whom the terminal was unavailable received conventional continuing rehabilitation. To limit selection bias, all consecutively identified eligible records were assessed, identical eligibility criteria were applied to both groups, and both groups received the same surgical and in-hospital perioperative care; nevertheless, residual confounding related to motivation, digital literacy, caregiver support, treatment preference, and other unmeasured factors could not be eliminated. Statistical analysis was performed by retrospectively retrieving perioperative medical records, complete records of continuing rehabilitation interventions, and standardized follow-up data collected 12 months after surgery. No prospective intervention was introduced during the study period. The original clinical diagnosis, treatment, and nursing pathways were not altered in any way. All data used for analysis were obtained from the hospital's fully archived clinical diagnosis and treatment database, nursing management database, and dedicated follow-up database, ensuring the dataset was traceable and verifiable.
Study population
The electronic medical record system was queried for patients who underwent single-level or two-level posterior lumbar interbody fusion between January 1, 2024, and January 31, 2025, and follow-up information was collected through January 31, 2026. The archived screening log began with records returned by the prespecified date- and procedure-restricted database query; the total number of lumbar operations performed before those database filters was applied was not retained and should not be interpreted as an eligibility-screening denominator. The query returned 117 records for formal eligibility assessment; all 117 met the eligibility criteria, and no record was excluded. The final analytical cohort, therefore, comprised 54 patients in the smart nursing group and 63 in the control group. All 117 patients had complete baseline and 12-month outcome data; no participants were lost from the analytical cohort, and no outcome values were imputed. Participant selection and follow-up are summarized in Figure 1.
Inclusion criteria
1) Elderly patients aged ≥60 years; 2) patients diagnosed with lumbar degenerative disease on the basis of imaging findings combined with clinical symptoms, including lumbar spinal stenosis, lumbar disc herniation, and lumbar spondylolisthesis, who underwent single-level or two-level posterior lumbar interbody fusion (PLIF/TLIF); 3) surgery performed between January 1, 2024, and January 31, 2025; 4) complete preoperative baseline assessment data and complete 12-month postoperative follow-up data, with no missing core data; 5) clear consciousness after surgery, ability to cooperate with rehabilitation evaluation and follow-up, and complete, traceable medical records.
Exclusion criteria
1) Cases complicated by severe failure of major organs such as the heart, liver, or kidneys, malignant tumors, or severe cognitive impairment (Mini-Mental State Examination, MMSE score <24), making rehabilitation follow-up impossible; 2) a history of lumbar surgery, spinal deformity, spinal infection, or spinal fracture; 3) cases complicated by peripheral neuropathy, lower-limb motor dysfunction, or severe osteoporosis that could interfere with evaluation of rehabilitation outcomes; 4) missing core data during the 12-month postoperative follow-up period, making complete statistical analysis impossible; 5) transfer to another hospital during postoperative recovery or loss to follow-up.
Rehabilitation exposure and clinical procedures
During the in-hospital perioperative period, patients in both groups received the same routine diagnosis, treatment, and nursing care provided by the Department of Orthopedics at the hospital. These measures included postoperative vital-sign monitoring, incision care, position management, dietary guidance, and instruction in early bedside rehabilitation. At discharge, all patients were given the hospital's standardized printed manual for postoperative lumbar rehabilitation. Within 24 h before surgery, a standardized baseline assessment, surgery-related health education, and rehabilitation pretraining were completed to ensure that patients had mastered key movements such as log rolling, ankle pump exercise, and diaphragmatic breathing. After the patients returned to the ward, continuous ECG monitoring was maintained for 24 h, a three-tier pain management strategy was implemented, and early bedside rehabilitation training was started once vital signs were stable. From postoperative day 1 to day 7, stepwise rehabilitation training was carried out, along with incision care and prevention of complications such as thrombosis and pulmonary infection. Before discharge, a comprehensive rehabilitation assessment was completed; the Home-Based Rehabilitation Guidance Manual After Lumbar Surgery was uniformly distributed; practical evaluation of core rehabilitation movements was conducted; and discharge education was completed, with signatures from both patients and caregivers confirming completion of the instruction. Conventional continuing rehabilitation. After discharge, patients in the control group followed the fixed home rehabilitation program contained in the hospital's printed manual and received routine telephone follow-up and outpatient review over 12 months. No wearable rehabilitation terminal, automated alert, or remote dynamic adjustment of the rehabilitation plan was used. Pain, medication use, wound condition, neurological symptoms, exercise performance, and complications were reviewed during routine contacts and documented in the electronic medical record or follow-up database. The archived protocol did not maintain a uniform contact-frequency schedule for every patient; therefore, follow-up contacts reflected routine departmental practice and clinically indicated review, as summarized in Table 1. Smart nursing–enabled individualized rehabilitation. In addition to the routine follow-up, outpatient review, and printed rehabilitation manual provided to the control group, patients in the smart nursing group received a 12-month program incorporating four stages of exercise progression, clinician-reviewed monitoring via a wearable rehabilitation terminal, predefined alert-triggered contact, and periodic adjustments to the rehabilitation plan. The objectives and principal progression rules of the four stages are summarized below, whereas the complete exercise dose, progression criteria, safety criteria, and monitoring actions are presented in Table 2.
The program was delivered through a wearable rehabilitation terminal (see Table of Materials) connected to the hospital's smart nursing management platform. The terminal generated processed movement-trajectory, exercise-duration, training-frequency, and surface electromyography (sEMG)-derived monitoring indices, which were transmitted to the platform at a 1 Hz update rate, equivalent to one processed update per second. The 1-Hz value refers only to the platform update rate and does not represent the raw inertial measurement unit or sEMG sampling frequency. The archived clinical records did not contain raw IMU or sEMG waveforms; raw sampling rates; filtering, preprocessing, feature-extraction, or downsampling procedures; the allocation of processing between the wearable terminal and server; firmware or algorithm-version identifiers; proprietary implementation details; formal accuracy or test–retest reliability estimates; the medical-device registration number; or a quantitative data-loss rate. These technical characteristics could not, therefore, be independently reconstructed, and the terminal was treated solely as a clinician-reviewed monitoring and alert-support tool rather than as a validated diagnostic or quantitative sEMG instrument. Stage-specific movement templates were constructed from standardized exercise demonstrations performed under the supervision of the rehabilitation therapist, and each patient's first correctly completed supervised repetitions were stored as the individual reference for subsequent percentage-deviation calculations. Before initial use, the terminal underwent its built-in self-check and zero-reference procedure, after which the responsible nurse or rehabilitation therapist confirmed sensor placement, signal stability, and successful data transmission. Because the proprietary processing procedures were unavailable, these reference-based indices were used only to support clinician review and were not interpreted as validated physiological measurements. The sensing module was placed over intact paraspinal skin lateral to the surgical incision and outside the wound-dressing margin and was worn only during prescribed rehabilitation sessions after clinical clearance. Patients and caregivers were instructed to inspect the skin before and after each session; the terminal was removed during bathing, wound care, imaging examinations, or any episode of erythema, pain, blistering, or other irritation. When skin irritation occurred, use was suspended, the responsible nurse assessed the affected area by telephone, photograph, or video, and rehabilitation guidance continued without the terminal until the skin condition had resolved. Patients unable to tolerate the terminal were instructed to continue the clinically appropriate exercise program under telephone or video supervision, although the number and duration of episodes of intolerance were not retained in the analytical dataset. Processed data were transmitted by Bluetooth to a patient-side mobile gateway and then through the hospital-managed network; temporarily interrupted transmissions were synchronized after reconnection, whereas intervals that could not be recovered were recorded by the platform as device off-time. Aggregate wear time, unrecovered off-time, technical-failure counts, and reconnection duration were not exported to the archived analytical dataset.
Before discharge, all patients received a multidimensional baseline assessment covering age, surgical procedure, comorbidities, pain severity (Numeric Rating Scale, NRS), paraspinal muscle strength (Manual Muscle Test, MMT), and cognitive function, based on which a four-stage stepwise individualized rehabilitation program was developed, with clear training parameters, intensity progression rules, and individualized pain management strategies. The rehabilitation program comprised an adaptation phase during postoperative weeks 1–4, a core-activation phase during weeks 5–8, a functional-recovery phase during weeks 9–12, and a maintenance phase during weeks 13–52. Exercise intensity and progression were determined jointly by pain status, wound condition, therapist-confirmed movement quality, functional performance, and completion of the prescribed program. The exercise type, dose, progression criteria, safety or stopping criteria, and monitoring actions for each stage are provided in Table 2.
A predefined rule-based three-level alert system was used; no machine-learning or artificial-intelligence model was involved. Red alerts required clinical review within 1 h and were triggered by an NRS score ≥7 at rest, an NRS score ≥9 during activity, a persistent NRS score ≥4 for more than 24 h, or an sEMG amplitude deviation ≥20% in two consecutive 1-s monitoring windows. Yellow alerts required corrective guidance within 48 h and were triggered by an NRS score of 4–6 at rest, an NRS score of 6–8 during activity, movement-trajectory deviation ≥15% for three consecutive repetitions, or completion of <80% of the prescribed training plan for three consecutive days. Blue alerts were used for routine education and outpatient-review reminders and were closed within 72 h. Movement-trajectory deviation was defined as the platform-calculated mean absolute percentage difference between a completed exercise trajectory and the stage-specific reference template. The sEMG criterion was defined as the percentage deviation of the root-mean-square amplitude from the patient's supervised reference performance for the same exercise. According to the archived clinical protocol, the 15% movement-deviation and 20% sEMG-deviation values were selected before program implementation through internal discussion among the two orthopedic specialist nurses, one rehabilitation therapist, and one attending orthopedic surgeon who delivered the rehabilitation program. The protocol did not use a pilot dataset, a Delphi procedure, a formal consensus rating, an inter-rater agreement assessment, calibration against expert-annotated movements, or validation against subsequent clinical outcomes, and the quantitative rationale for selecting 15% and 20% beyond the internal clinical consensus was not retained. These thresholds should therefore be interpreted only as exploratory operational triggers for clinician review, rather than as validated clinical, diagnostic, or safety cutoffs. The intervention team reviewed all platform-uploaded data daily, with one-to-one video guidance provided for nonstandard movements, incomplete training, or abnormal fluctuations in pain. Comprehensive rehabilitation reassessment was performed every 4 weeks, with the program dynamically adjusted based on training adherence, pain improvement, and muscle strength recovery; updated plans were sent to the patient's terminal with one-to-one explanation from the responsible nurse. Monthly online rehabilitation health education, full-process outpatient review, multistep reminders, and automatic encrypted archiving of all supervision, alert-handling, and program-adjustment records were implemented throughout the 12-month intervention period.
Data sources, extraction, and follow-up schedule
Perioperative characteristics were extracted from the electronic medical record system; rehabilitation exposure and intervention records were extracted from the nursing management database; and 12-month outcomes were extracted from the dedicated follow-up database. Two assessment time points were analyzed: T0, defined as the assessment completed within 3 days before surgery, and T1, defined as the final assessment completed 12 months after surgery. Data extraction was performed using a standardized form, and group assignments and outcome values were checked against the original records before analysis.
Platform access was restricted to named rehabilitation team members via individually authenticated accounts and role-based authorization. Clinical data were stored within the hospital-managed information environment, and only de-identified variables were exported for research analysis. The platform audit log recorded account access, alert handling, and rehabilitation plan modifications; however, the frequency of audit log reviews and audit findings was not analyzed as study outcomes. The archived study records did not contain the specific cryptographic algorithm, encryption strength, key-generation or key-rotation procedure, or other key-management documentation, and these details could not be independently reported. Accordingly, the manuscript describes only the security controls that could be verified from the clinical workflow and does not claim cryptographic reproducibility or independent security validation.
Indicators related to chronic pain control
Numeric Rating Scale (NRS) scores10 under resting and active conditions at T0 and T1 were extracted. The scale ranges from 0 to 10, where 0 represents no pain, and 10 represents the worst pain imaginable; higher scores indicate more severe pain. The incidence of chronic postsurgical pain (CPSP) at T1 was also recorded. CPSP was defined as pain located in the lumbar surgical area that persisted for ≥3 months after surgery, had an NRS score ≥3, and could not be better explained by another condition11. In addition, the mean monthly frequency of oral analgesic use during the 12-month postoperative follow-up period and the Pain Self-Efficacy Questionnaire (PSEQ) score12 at T1 were collected. The PSEQ contains 10 items, each scored from 0 to 6, giving a total score of 0–60. Higher scores indicate better pain self-management efficacy. The Cronbach's α coefficient of this scale is 0.92, indicating good reliability and validity.
Indicators of paraspinal muscle strength recovery and core functional restoration
The cross-sectional area of the erector spinae muscle at T0 and T1 was extracted from measurements obtained with a lumbar color Doppler ultrasound system (see Table of Materials). During measurement, patients were placed in the prone position with the paraspinal muscles relaxed. A transverse scan was performed at the L4/5 intervertebral level, the cross-sectional areas of the bilateral erector spinae muscles were measured, and the mean of both sides was calculated in cm2. The maximum isometric strength of the paraspinal muscles was measured using an isokinetic muscle testing system (see Table of Materials). At T1, the rates of achieving the target muscle strength and of completing core stability rehabilitation movements were also recorded in both groups. Muscle strength attainment was assessed using the Manual Muscle Test (MMT)13, which grades strength from 0 to 5; a grade of ≥4 was defined as attainment. The quality of movement completion was evaluated by rehabilitation therapists and included three core training movements: bridging, prone trunk extension, and plank. According to the hospital's standardized movement criteria, performance was classified as qualified or unqualified, and the overall qualification rate was then calculated. In addition, Berg Balance Scale (BBS) scores14 at T0 and T1 were extracted. This scale contains 14 items, each scored from 0 to 4, with a total score of 0–56. Higher scores indicate better balance function and a lower risk of falling. The Cronbach's α coefficient is 0.96, showing good reliability and validity.
Core outcome measures of lumbar function and long-term prognosis
Japanese Orthopedic Association Scores (JOA)15, the Oswestry Disability Index (ODI)16, and the Modified Barthel Index (MBI)17 at T0 and T1 were extracted to comprehensively evaluate lumbar function and activities of daily living. The JOA scale covers four dimensions, namely subjective symptoms, clinical signs, limitation of daily activities, and bladder function, with a total score of 0–29; higher scores indicate better lumbar function. The ODI covers 10 dimensions, including pain intensity, self-care, lifting, and walking. Each item is scored from 0 to 5, with a total score of 0–50; after conversion to a percentage, higher scores indicate more severe lumbar dysfunction. The MBI includes 10 daily activity items, such as feeding, grooming, dressing, toileting, and walking, with a total score ranging from 0 to 100; higher scores reflect better daily functioning and greater self-care ability. At T1, bone graft fusion was assessed according to the Bridwell fusion grading system based on lumbar CT findings obtained with an electronic computed tomography scanner (see Table of Materials). Grades I–II were defined as successful bone graft fusion, and the lumbar fusion rate was calculated in both groups. The cumulative incidence of falls during the 12-month postoperative follow-up period was also recorded.
Indicators of health-related quality of life and psychological status
The assessment results of the 36-Item Short Form Health Survey (SF-36)18 at T0 and T1 were extracted. This scale includes two dimensions, the Physical Component Summary (PCS) and Mental Component Summary (MCS), both converted to a 0–100 scale; higher scores indicate better health status in the corresponding domain. Psychological status was evaluated using the Generalized Anxiety Disorder-7 (GAD-7)19 and the Patient Health Questionnaire-9 (PHQ-9)20.
Indicators of rehabilitation-related adverse events and complications
The cumulative incidence of poor incision healing/infection, nerve root irritation/lower-limb numbness, adjacent-segment degeneration, deep venous thrombosis of the lower limbs, and unplanned readmission during the 12-month postoperative follow-up period was recorded in both groups.
Indicators related to medical resource utilization and rehabilitation costs
Resource use was evaluated descriptively from healthcare-service and patient/caregiver perspectives over the 12-month follow-up period; this analysis was not designed as a formal cost-effectiveness evaluation. Outpatient and emergency visits were extracted from the medical records and follow-up databases. Total rehabilitation-related cost was defined as the cumulative amount recorded in the hospital billing and follow-up systems for rehabilitation services, rehabilitation-related outpatient or emergency care, and use of the wearable rehabilitation platform, and was expressed in nominal Chinese yuan. Home caregiving burden was recorded as the cumulative number of months during which regular assistance was required and was not converted into a monetary value. Because the observation horizon was 12 months, neither discounting nor inflation adjustment was applied.
Statistical analysis
All analyses were performed using statistical software (see Table of Materials). The primary outcome was the between-group difference in the change in activity-related NRS score from baseline to 12 months. Continuous outcomes measured at both T0 and T1 were analyzed using generalized estimating equations with a Gaussian distribution, identity link, exchangeable working correlation structure, and robust sandwich standard errors. Each model included rehabilitation group, assessment time, and the group-by-time interaction; the interaction coefficient represented the between-group difference in change from baseline to 12 months. A covariate-adjusted sensitivity analysis was additionally performed for each repeated continuous outcome by modeling the individual change score using linear regression with HC3 robust standard errors and including the baseline value of the corresponding outcome, age, sex, body mass index, primary diagnosis, surgical procedure, and number of fused levels as covariates. The adjusted estimates are reported in Supplementary Table 1. Continuous outcomes assessed only at T1 were compared using Welch's independent-samples t-test. CPSP, muscle-strength attainment, qualified movement completion, bone graft fusion, and falls were compared using Pearson's χ2 test, whereas the four low-frequency complication outcomes were analyzed using Fisher's exact test. Continuous effects are reported as mean differences or group-by-time interaction estimates with 95% confidence intervals, and categorical effects are reported as risk differences with 95% confidence intervals. Shapiro–Wilk tests and Q–Q plots indicated departures from normality for most bounded-scale and change-score variables; robust standard errors and Welch's test were therefore used to reduce reliance on the assumptions of equal variance and normality. The primary outcome was tested at a two-sided α level of 0.05 and was not included in the multiplicity adjustment. The Benjamini–Hochberg procedure was applied across the 26 secondary outcomes to control the false discovery rate at 5%, and both unadjusted P values and adjusted q values are reported. All 117 patients had complete baseline and 12-month outcome data, and no imputation was performed. Because the study included all eligible archived records, no a priori sample size calculation was undertaken; a descriptive sensitivity analysis indicated that group sizes of 54 and 63 provided 80% power to detect a standardized mean difference of approximately 0.52 at a two-sided α level of 0.05.
Results
Comparison of baseline characteristics
Among the 117 included patients, 54 received smart nursing–enabled individualized rehabilitation and 63 received conventional continuing rehabilitation. No statistically significant between-group differences were observed in the measured demographic, clinical, or surgical baseline characteristics, including age, sex, body mass index, disease duration, comorbidities, primary diagnosis, surgical procedure, and number of fused levels (all P > 0.05; Table 3); however, the absence of statistically significant baseline differences does not exclude residual confounding.
Comparison of indicators related to chronic pain control
At 12 months, resting NRS scores were 1.87 ± 0.80 in the smart nursing group and 2.87 ± 0.77 in the control group, whereas activity-related NRS scores were 2.69 ± 1.06 and 3.87 ± 0.77, respectively. CPSP occurred in 9 of 54 patients (16.67%) in the smart nursing group and 40 of 63 patients (63.49%) in the control group, corresponding to a risk difference of −46.83 percentage points (95% CI, −62.32 to −31.33; P < 0.001; q < 0.001). Mean monthly analgesic use was 2.44 ± 0.84 versus 3.35 ± 1.39 (mean difference, −0.90; 95% CI, −1.32 to −0.49; q < 0.001), and PSEQ scores were 47.98 ± 6.21 versus 33.49 ± 6.49 (mean difference, 14.49; 95% CI, 12.16–16.82; q < 0.001). For the primary outcome, the GEE analysis showed that the reduction in activity-related NRS score was 1.10 points greater in the smart nursing group than in the control group (group-by-time interaction estimate, −1.10; 95% CI, −1.50 to −0.69; P < 0.001). The corresponding secondary interaction estimate for resting NRS was −0.93 points (95% CI, −1.29 to −0.56; q < 0.001) (Table 4). In the covariate-adjusted sensitivity analysis, the adjusted between-group difference in activity-related NRS change was −1.12 points (95% CI, −1.26 to −0.98; P < 0.001).
Comparison of paraspinal muscle strength recovery and core functional restoration
At 12 months, erector spinae cross-sectional area was 14.20 cm2 ± 1.13 cm2 in the smart nursing group and 12.19 cm2 ± 0.56 cm2 in the control group, while maximum isometric paraspinal torque was 82.84 ± 7.58 and 66.75 ± 4.57 Nm, respectively. The group-by-time interaction estimates were 1.96 cm2 for erector spinae cross-sectional area (95% CI, 1.81–2.11) and 16.05 Nm for paraspinal torque (95% CI, 15.00–17.10); both q values were < 0.001. MMT attainment was documented in 41 of 54 patients (75.93%) and 36 of 63 patients (57.14%), respectively (q = 0.039), whereas qualified completion of the core movements was documented in 40 of 54 patients (74.07%) and 29 of 63 patients (46.03%), respectively (q = 0.003). The interaction estimate for BBS score was 6.92 points (95% CI, 6.57–7.27; q < 0.001) (Table 5).
Comparison of core outcomes of lumbar function and long-term prognosis
At 12 months, the smart nursing group had a higher JOA score (23.52 ± 1.96 vs 20.00 ± 1.75), a lower ODI score (22.15 ± 3.60 vs 37.14 ± 4.46), and a higher MBI score (88.30 ± 4.96 vs 71.89 ± 4.49). The corresponding group-by-time interaction estimates were 3.58 points for JOA (95% CI, 3.37–3.80), −14.24 percentage points for ODI (95% CI, −14.59 to −13.89), and 15.74 points for MBI (95% CI, 15.19–16.28); all q values were <0.001. Bone graft fusion was observed in 49 of 54 patients (90.74%) and 39 of 63 patients (61.90%), respectively (risk difference, 28.84 percentage points; 95% CI, 14.57–43.10; q < 0.001). Falls occurred in 6 of 54 patients (11.11%) and 16 of 63 patients (25.40%), respectively; although the unadjusted P value was 0.049, the association did not remain statistically significant after adjustment for multiplicity (q = 0.053) (Table 6).
Comparison of health-related quality of life and psychological status
There were no statistically significant between-group differences in baseline SF-36, GAD-7, or PHQ-9 scores. The group-by-time interaction estimates favored the smart nursing group for SF-36 PCS (13.44 points; 95% CI, 12.63–14.25), SF-36 MCS (12.16 points; 95% CI, 11.21–13.10), GAD-7 (−3.19 points; 95% CI, −3.56 to −2.82), and PHQ-9 (−2.53 points; 95% CI, −2.81 to −2.26); all corresponding q values were <0.001 (Figure 2A–C).
Comparison of rehabilitation-related adverse events and complications
During the 12-month follow-up, poor wound healing or infection occurred in 1 of 54 patients (1.85%) in the smart nursing group and 5 of 63 patients (7.94%) in the control group (Fisher P = 0.215; q = 0.215), nerve root irritation or lower-limb numbness occurred in 3 of 54 (5.56%) and 13 of 63 patients (20.63%), respectively (Fisher P = 0.029; q = 0.035), adjacent-segment degeneration occurred in 2 of 54 (3.70%) and 10 of 63 patients (15.87%), respectively (Fisher P = 0.035; q = 0.040), and deep venous thrombosis occurred in 1 of 54 (1.85%) and 6 of 63 patients (9.52%), respectively (Fisher P = 0.122; q = 0.126). Because the events were uncommon and allocation was nonrandomized, these complication findings were considered exploratory (Table 7).
Comparison of medical resource utilization and rehabilitation costs
During the 12-month follow-up, the smart nursing group had fewer outpatient visits than the control group (3.17 ± 0.84 vs 5.94 ± 0.93; mean difference, −2.77; 95% CI, −3.09 to −2.45), fewer emergency visits (0.20 ± 0.41 vs 0.83 ± 0.79; mean difference, −0.62; 95% CI, −0.85 to −0.39), lower rehabilitation-related costs (CNY 4422.42 ± 462.26 vs CNY 6905.14 ± 497.08; mean difference, −CNY 2482.73; 95% CI, −2658.56 to −2306.89), and a shorter duration of home-care dependence (2.41 ± 1.22 vs 5.73 ± 1.18 months; mean difference, −3.32 months; 95% CI, −3.76 to −2.88); all corresponding q values were <0.001 (Figure 3A–D).
DATA AVAILABILITY:
The de-identified participant-level dataset used to reproduce the analyses reported in this study is provided with the article as Supplementary File 1. The file contains the 117 included patients and the variables analyzed in Table 3, Table 4, Table 5, Table 6, Table 7, Figure 2, and Figure 3.
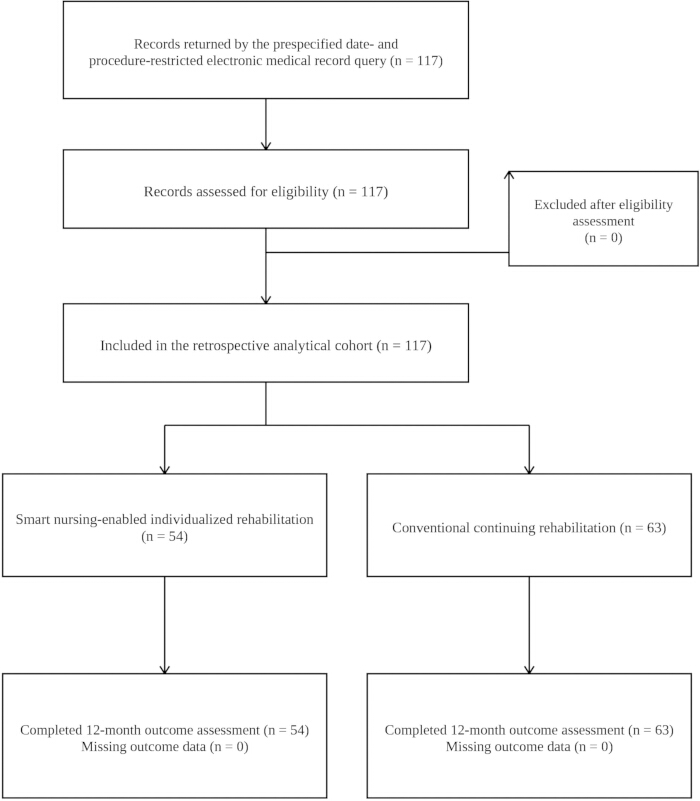
Figure 1: Flow of participants through the retrospective comparative cohort study. The prespecified electronic medical record query identified 117 records for eligibility assessment; no record was excluded. The final cohort included 54 patients who received smart nursing–enabled individualized rehabilitation and 63 patients who received conventional continuing rehabilitation. All 117 patients had complete baseline and 12-month outcome data, and no imputation was performed. This diagram shows participant identification, eligibility assessment, group allocation, follow-up completion, and missing-data status. Please click here to view a larger version of this figure.
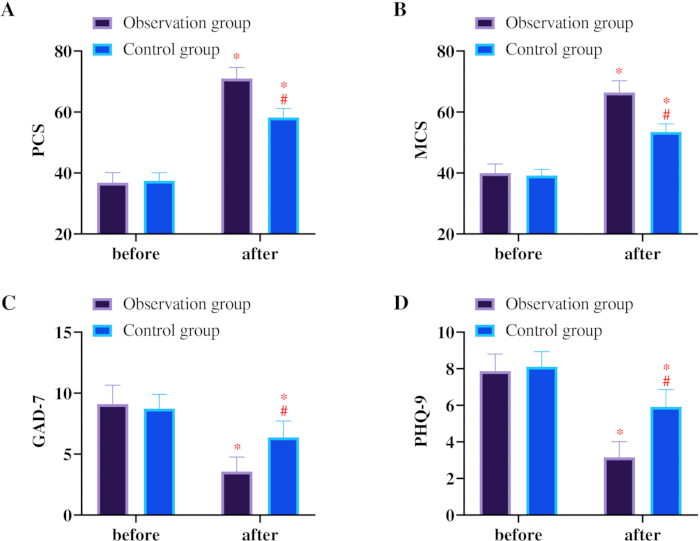
Figure 2: Changes in health-related quality of life and psychological outcomes from baseline to 12 months. (A) SF-36 Physical Component Summary score. (B) SF-36 Mental Component Summary score. (C) Generalized Anxiety Disorder-7 score. (D) Patient Health Questionnaire-9 score. Data are presented as mean ± SD. Between-group differences in change were evaluated using generalized estimating equations, and q values were obtained using the Benjamini–Hochberg procedure across the 26 secondary outcomes. The figure illustrates the changes in physical health, mental health, anxiety, and depressive symptoms from baseline to 12 months in both groups. Please click here to view a larger version of this figure.
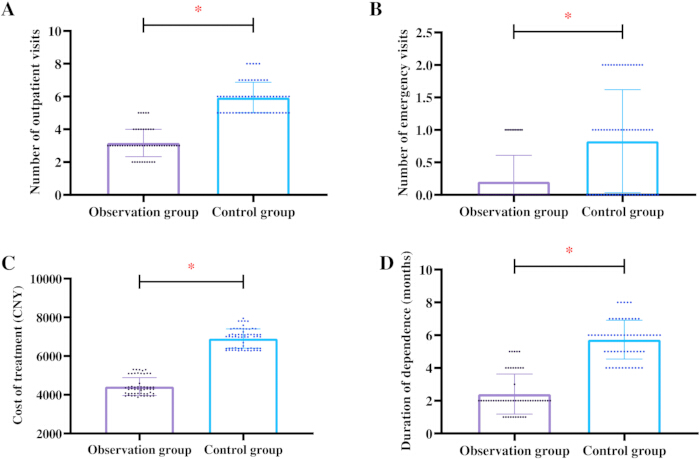
Figure 3. Medical resource utilization and rehabilitation-related burden during the 12-month follow-up. (A) Number of outpatient visits. (B) Number of emergency visits. (C) Rehabilitation-related cost in Chinese yuan. (D) Duration of dependence on home care. Data are presented as mean ± SD; all corresponding Benjamini–Hochberg-adjusted q values were <0.001. The figure compares outpatient visits, emergency visits, rehabilitation-related costs, and home-care dependence between the two groups over the follow-up period. Please click here to view a larger version of this figure.
| Component | Procedure | ||
| Pre-discharge preparation | Standardized perioperative care, baseline assessment, rehabilitation education, movement demonstration, printed home-rehabilitation manual, and practical verification involving the patient and caregiver | ||
| Home exercise | Fixed exercise program based on the printed manual; no wearable rehabilitation terminal, automated alert, or dynamic remote adjustment | ||
| Continuing follow-up | Routine telephone follow-up and outpatient review over 12 months, with review of pain, medication use, wound condition, neurological symptoms, exercise performance, and complications | ||
| Clinical escalation | Patients were instructed to contact the department or seek outpatient or emergency assessment for worsening pain, wound problems, new numbness or weakness, a fall, or another concerning symptom | ||
| Documentation | Telephone and outpatient follow-up information was entered into the electronic medical record or dedicated follow-up database | ||
Table 1: Continuing Rehabilitation Supervision Protocol in the Control Group. This table summarizes the principal components of conventional post-discharge rehabilitation provided to the control group.
| Stage | Exercise prescription | Progression criteria | Safety or stopping criteria | Monitoring and actions | |||||
| Weeks 1–4: adaptation | Ankle pumps: 3-s dorsiflexion and 3-s plantarflexion, 15 repetitions/set, 4 sets/day; diaphragmatic breathing: 5-s inhalation and 5-s exhalation, 10 repetitions/set, 3 sets/day; gluteal isometric contractions: 5-s hold, 10 repetitions/set, 3 sets/day | Wound healing without complication, resting NRS ≤3, and completion of the prescribed program for 7 consecutive days | Suspend the session for new wound drainage, fever, acute neurological symptoms, intolerable pain, or skin irritation; red-alert pain thresholds required clinical review | Pain, exercise completion, skin condition, and movement performance were reviewed; alerts were handled according to the predefined three-level system | |||||
| Weeks 5–8: core activation | Supine bridging: 10-s hold, 12 repetitions/set, 3 sets/day; neutral-spine prone trunk extension: 8-s hold, 10 repetitions/set, 3 sets/day; 30° straight-leg raise: 6-s hold, 8 repetitions/side/set, 2 sets/day | Activity NRS ≤2, therapist-confirmed correct movement execution, and ≥90% completion for 7 consecutive days | Exercise was stopped for sharp radiating pain, new numbness or weakness, loss of movement control, intolerable fatigue, or skin irritation | Processed movement and sEMG-derived indices supported clinician review; nonstandard movements prompted corrective video guidance | |||||
| Weeks 9–12: functional recovery | Modified kneeling plank: 20-s hold, 10 repetitions/set, 3 sets/day; resistance-band dynamic bridging: 10-s hold, 15 repetitions/set, 3 sets/day; walking: 20–30 min twice daily | Pain-free continuous walking for 30 min, plank hold ≥30 s, and no red alert for 2 consecutive weeks | Training was reduced or suspended for worsening pain, neurological symptoms, instability, falls, or other clinically concerning events | Daily platform review continued, with plan adjustment according to pain, movement quality, and completion | |||||
| Weeks 13–52: maintenance | Standard plank: 30–45-s hold, 8 repetitions/set, 3 sets/day, with a 5-s monthly increase as tolerated; lumbar rotation stretch: 5-s hold/side, 12 repetitions/set, 2 sets/day; aerobic walking: 30–45 min, 3–5 times/week | Maintenance of ≥80% completion and tolerance of the prescribed intensity | Patients were instructed to stop and contact the team for persistent pain escalation, new neurological symptoms, a fall, skin injury, or device intolerance | Comprehensive reassessment was conducted every 4 weeks; updated plans were delivered through the platform and explained by the responsible nurse | |||||
Table 2: Smart Nursing Terminal–Enabled Individualized Continuing Rehabilitation Supervision Protocol in the Observation Group. This table presents the exercises, dosing schedules, progression criteria, safety requirements, and monitoring actions used during the four rehabilitation stages.
| Smart nursing group, n=54 | Control group, n=63 | P value | |
| Age, years | 71.13±5.99 | 71.32±5.68 | 0.863 |
| Male sex | 25 (46.30%) | 32 (50.79%) | 0.628 |
| BMI, kg/m² | 23.35±0.72 | 23.35±0.75 | 0.964 |
| College or above | 9 (16.67%) | 10 (15.87%) | |
| Junior/senior high school | 26 (48.15%) | 35 (55.56%) | 0.698 |
| Primary school or below | 19 (35.19%) | 18 (28.57%) | |
| Disease duration, months | 22.93±6.15 | 22.95±6.26 | 0.982 |
| Hospital stay, days | 10.50±1.38 | 10.49±1.34 | 0.975 |
| Hypertension | 44 (81.48%) | 54 (85.71%) | 0.536 |
| Type 2 diabetes mellitus | 24 (44.44%) | 24 (38.10%) | 0.486 |
| Coronary heart disease | 11 (20.37%) | 15 (23.81%) | 0.656 |
| COPD | 5 (9.26%) | 8 (12.70%) | 0.555 |
| Lumbar disc herniation | 18 (33.33%) | 34 (53.97%) | |
| Lumbar spinal stenosis | 24 (44.44%) | 19 (30.16%) | 0.081 |
| Lumbar spondylolisthesis | 12 (22.22%) | 10 (15.87%) | |
| PLIF | 31 (57.41%) | 42 (66.67%) | 0.303 |
| TLIF | 23 (42.59%) | 21 (33.33%) | |
| Two fused levels | 18 (33.33%) | 25 (39.68%) | 0.478 |
Table 3: Baseline Characteristics of the Two Groups. This table compares the demographic, clinical, comorbidity, and surgical characteristics of the two groups at baseline.
| Outcome | Smart nursing group | Control group | Effect estimate (95% CI) | Test statistic | P | q |
| Resting NRS, T0 | 5.91±0.68 | 5.98±0.83 | ||||
| Resting NRS, T1 | 1.87±0.80 | 2.87±0.77 | Interaction −0.93 (−1.29 to −0.56) | z=−4.986 | <0.001 | <0.001 |
| Activity-related NRS, T0 | 6.91±0.68 | 7.00±0.78 | ||||
| Activity-related NRS, T1 | 2.69±1.06 | 3.87±0.77 | Interaction −1.10 (−1.50 to −0.69) | z=−5.257 | <0.001 | — |
| CPSP | 9/54 (16.67%) | 40/63 (63.49%) | RD −46.83 percentage points (−62.32 to −31.33) | χ²=26.193 | <0.001 | <0.001 |
| Analgesic use, times/month | 2.44±0.84 | 3.35±1.39 | MD −0.90 (−1.32 to −0.49) | t=−4.321 | <0.001 | <0.001 |
| PSEQ | 47.98±6.21 | 33.49±6.49 | MD 14.49 (12.16 to 16.82) | t=12.325 | <0.001 | <0.001 |
Table 4: Comparison of Chronic Pain–Related Outcomes Between the Two Groups. This table reports between-group differences in pain intensity, chronic postsurgical pain, analgesic use, and pain self-efficacy.
| Outcome | Smart nursing group | Control group | Effect estimate (95% CI) | Test statistic | P | q |
| Erector spinae CSA, T0, cm² | 11.96±0.71 | 11.90±0.68 | ||||
| Erector spinae CSA, T1, cm² | 14.20±1.13 | 12.19±0.56 | Interaction 1.96 (1.81 to 2.11) | z=26.033 | <0.001 | <0.001 |
| Maximum isometric paraspinal torque, T0, N·m | 54.14±4.26 | 54.10±4.12 | ||||
| Maximum isometric paraspinal torque, T1, N·m | 82.84±7.58 | 66.75±4.57 | Interaction 16.05 (15.00 to 17.10) | z=29.985 | <0.001 | <0.001 |
| MMT attainment | 41/54 (75.93%) | 36/63 (57.14%) | RD 18.78 percentage points (2.07 to 35.50) | χ²=4.559 | 0.033 | 0.039 |
| Qualified movement completion | 40/54 (74.07%) | 29/63 (46.03%) | RD 28.04 percentage points (11.07 to 45.02) | χ²=9.451 | 0.002 | 0.003 |
| BBS, T0 | 37.28±2.69 | 36.65±2.57 | ||||
| BBS, T1 | 49.61±2.86 | 42.06±3.19 | Interaction 6.92 (6.57 to 7.27) | z=38.530 | <0.001 | <0.001 |
Table 5: Comparison of Paraspinal Muscle Recovery and Core Functional Outcomes Between the Two Groups. This table summarizes paraspinal muscle recovery, movement performance, muscle-strength attainment, and balance outcomes in the two groups.
| Outcome | Smart nursing group | Control group | Effect estimate (95% CI) | Test statistic | P | q |
| JOA, T0 | 9.76±1.61 | 9.83±1.58 | ||||
| JOA, T1 | 23.52±1.96 | 20.00±1.75 | Interaction 3.58 (3.37 to 3.80) | z=32.936 | <0.001 | <0.001 |
| ODI, T0, % | 64.19±4.19 | 64.94±4.17 | ||||
| ODI, T1, % | 22.15±3.60 | 37.14±4.46 | Interaction −14.24 (−14.59 to −13.89) | z=−79.523 | <0.001 | <0.001 |
| MBI, T0 | 41.26±3.61 | 40.59±3.62 | ||||
| MBI, T1 | 88.30±4.96 | 71.89±4.49 | Interaction 15.74 (15.19 to 16.28) | z=56.203 | <0.001 | <0.001 |
| Bone graft fusion | 49/54 (90.74%) | 39/63 (61.90%) | RD 28.84 percentage points (14.57 to 43.10) | χ²=12.969 | <0.001 | <0.001 |
| Falls | 6/54 (11.11%) | 16/63 (25.40%) | RD −14.29 percentage points (−27.92 to −0.66) | χ²=3.887 | 0.049 | 0.053 |
Table 6: Comparison of Lumbar Functional Outcomes and Long-Term Prognostic Indicators Between the Two Groups. This table compares lumbar function, activities of daily living, bone graft fusion, and falls between the two groups.
| Complication | Smart nursing group | Control group | Risk difference (95% CI) | Fisher P | q |
| Poor wound healing or infection | 1/54 (1.85%) | 5/63 (7.94%) | −6.08 percentage points (−13.67 to 1.50) | 0.215 | 0.215 |
| Nerve root irritation or lower-limb numbness | 3/54 (5.56%) | 13/63 (20.63%) | −15.08 percentage points (−26.79 to −3.37) | 0.029 | 0.035 |
| Adjacent-segment degeneration | 2/54 (3.70%) | 10/63 (15.87%) | −12.17 percentage points (−22.50 to −1.83) | 0.035 | 0.04 |
| Deep venous thrombosis | 1/54 (1.85%) | 6/63 (9.52%) | −7.67 percentage points (−15.76 to 0.42) | 0.122 | 0.126 |
Table 7: Comparison of Rehabilitation-Related Adverse Events and Complications Between the Two Groups. This table reports the frequencies and comparative estimates of rehabilitation-related adverse events and postoperative complications.
Supplementary Table 1: Covariate-adjusted sensitivity analyses of repeated continuous outcomes.Please click here to download this file.
Supplementary File 1. De-identified participant-level clinical dataset for the 117 patients included in the retrospective comparative cohort study. The file contains group assignment, baseline characteristics, baseline and 12-month clinical outcomes, complications, and medical-resource variables used in the final analyses.
Discussion
Chronic pain after lumbar surgery is a key determinant of long-term rehabilitation outcome and remains one of the most difficult issues in conventional post-discharge rehabilitation management21. In this retrospective cohort, receipt of smart nursing–enabled individualized rehabilitation was associated with lower 12-month pain scores, a lower incidence of CPSP, and higher pain self-efficacy than conventional continuing rehabilitation. These associations may reflect the combined contribution of timely monitoring, individualized exercise progression, and repeated clinical contact, although the nonrandomized design does not establish that the rehabilitation model itself caused the observed differences. One important advantage of this model is that it addresses the passive and delayed nature of traditional follow-up. Under the conventional approach, clinicians usually learn about patients' pain status only through scheduled telephone calls, which makes prompt intervention difficult once pain begins to worsen. In this study, by contrast, the smart terminal enabled real-time collection of pain data and graded warning of abnormal changes, allowing analgesic regimens and rehabilitation plans to be adjusted soon after unusual pain fluctuations were detected. This temporal responsiveness may partly explain the observed association with a lower incidence of chronic postsurgical pain, although the study did not test mediation or establish a causal pathway22. From a mechanistic perspective, chronic pain after lumbar surgery is closely related to peripheral nerve sensitization, mechanical stimulation secondary to spinal instability, and insufficient patient self-management23. Individualized stepwise training and sustained health education provide a clinically plausible context for the observed pain differences; however, the present analysis did not test these mechanisms or determine the independent contribution of each program component24. This finding is consistent with previous studies showing that continuing rehabilitation intervention can reduce the risk of chronic pain after lumbar surgery25. The most evident benefit observed here may be attributable to the smart terminal's real-time monitoring capability, which compensated for the time lag of conventional follow-up and made pain management throughout the recovery period more precise.
Disuse atrophy of the paraspinal muscles is another important pathological basis for poor functional recovery after lumbar surgery. Loss of muscle mass can delay restoration of spinal function and increase the long-term risk of spinal degeneration and falls26. In the present study, the observation group had a larger erector spinae cross-sectional area and greater maximum isometric strength of the paraspinal muscles at 12 months after surgery than the control group. The observation group also had higher JOA scores and a higher observed bone graft fusion rate; however, these associations do not establish that the rehabilitation program increased fusion or directly improved spinal recovery. Conventional homogeneous rehabilitation programs do not adequately account for the marked individual differences seen in elderly patients, nor can they correct improper movements performed during home-based rehabilitation. As a result, training may become ineffective and may even lead to secondary injury. This is also one reason why some previous studies found limited benefit of online follow-up for muscle strength improvement27. In contrast, the model used in this study first established an individualized stepwise rehabilitation plan based on each patient's preoperative baseline condition, and then relied on the wearable terminal to monitor myoelectric signals and movement trajectories, thereby enabling real-time correction of incorrect force patterns. This monitoring approach may have supported more consistent execution of home-based rehabilitation, although patient-level adherence, wear time, and implementation fidelity could not be quantified28. From a pathophysiological standpoint, progressive individualized resistance training can activate muscle satellite cells, promote muscle protein synthesis, and reverse muscle atrophy caused by postoperative immobilization. Greater paraspinal muscle strength could theoretically contribute to spinal stability and a more favorable biomechanical environment; nevertheless, the observed difference in fusion does not establish that the rehabilitation program increased the probability of bone graft fusion29.
At 12 months, the observation group had more favorable anxiety, depressive symptoms, quality of life, and nursing satisfaction scores than the control group, although the observational design does not establish that these differences were caused by the rehabilitation model. This finding should not be viewed as separate from physical recovery; rather, it was closely associated with pain relief and restoration of bodily function. At the same time, continuous online supervision and interaction provided steady psychological support to elderly patients recovering at home and helped reduce helplessness and loneliness during rehabilitation. This is consistent with earlier reports showing that psychological status is closely linked to rehabilitation outcomes after lumbar surgery30. Lower frequencies of several complications and lower healthcare use were observed in the smart nursing group; however, these findings require cautious interpretation. The study was not randomized, complication events were relatively uncommon, and unmeasured differences in clinical risk, treatment preference, caregiver support, and healthcare-seeking behavior may have influenced the results. In particular, the present data do not establish that the rehabilitation protocol prevented falls or adjacent-segment degeneration, increased bone fusion, or independently reduced readmission. The resource-use findings likewise represent observational associations rather than evidence from a formal cost-effectiveness analysis.
This study has several limitations. First, the single-center retrospective design, nonrandomized allocation of exposures, and limited sample size leave the findings susceptible to selection bias, residual confounding, and an attention effect arising from more frequent clinical contact. Although covariate-adjusted sensitivity analyses yielded estimates consistent with the primary analyses, these adjustments cannot account for unmeasured differences in motivation, digital literacy, caregiver support, treatment preference, or healthcare-seeking behavior. Second, the archived analytical dataset did not contain participant-level wear time, longitudinal adherence records, alert volumes, false-positive or false-negative alert adjudication, clinician response times, technical-failure counts, or cumulative device off-time; the study should therefore be interpreted as an analysis of clinical outcomes rather than an evaluation of implementation fidelity or technical performance. Third, raw IMU and sEMG sampling rates, filtering and preprocessing procedures, feature extraction and downsampling methods, device-versus-server processing, firmware details, proprietary algorithms, and cryptographic configuration were unavailable, thereby limiting technical reproducibility. Fourth, the 15% movement-deviation and 20% sEMG-deviation thresholds were internally selected exploratory triggers and were not calibrated or validated against expert annotations or clinical outcomes. Fifth, unplanned readmission and the institution-developed satisfaction score were excluded from the final analysis because participant-level readmission data and the complete satisfaction-instrument documentation required for independent verification were unavailable. Although the Benjamini–Hochberg procedure was applied across the 26 retained secondary outcomes, the findings, given the sparse number of complication events and q-values close to 0.05, remain exploratory. Finally, follow-up ended at 12 months, and the sample did not support reliable subgroup or interaction analyses; prospective multicenter studies with validated device procedures, implementation metrics, and longer follow-up are required.
In this single-center retrospective comparative cohort, smart nursing–enabled individualized rehabilitation was associated with more favorable 12-month pain, paraspinal muscle, functional, psychological, and healthcare-use outcomes than conventional continuing rehabilitation after posterior lumbar fusion. The nonrandomized design, potential selection and attention effects, unavailable implementation and device performance metrics, and unvalidated operational thresholds preclude causal conclusions; prospective multicenter studies are required to confirm these associations and determine their generalizability.
Materials
| Name | Company | Catalog Number | Comments |
|---|---|---|---|
| Wearable rehabilitation terminal | Shenzhen Jianke Medical Technology Co., Ltd., Shenzhen, China | JK-YZ2020 | Transmission of processed movement and sEMG-derived monitoring indices |
| Smart nursing management platform | Fourth Affiliated Hospital of Soochow University | Institutional platform; not applicable | Clinical review, alert handling, plan modification, and audit logging |
| Ultrasound system | GE Healthcare | LOGIQ E9 | Measurement of erector spinae cross-sectional area |
| Isokinetic dynamometer | Biodex Medical Systems | Biodex System 4 | Measurement of maximum isometric paraspinal torque |
| CT scanner | Siemens Healthineers | SOMATOM Definition Flash | Assessment of Bridwell fusion grade |
| Statistical software | IBM Corp. | SPSS Statistics version 26.0 | Statistical analysis |
References
- *Katz JN, Zimmerman ZE, Mass H, Makhni MC. Diagnosis and management of lumbar spinal stenosis: a review. JAMA. 2022;327(17):1688–99.
- He K, et al. Prevalence and risk factors of lumbar spondylolisthesis in elderly Chinese men and women. Global Spine J. 2020;10(5):657–66.
- Alshammari HS, Alshammari AS, Alshammari SA, Ahamed SS. Prevalence of lower back pain and its relation to stress among medical students in Tabuk City, Saudi Arabia. Cureus. 2023;15(7):e41841. doi:10.7759/cureus.41841.
- Saleh A, Thirukumaran C, Mesfin A, Molinari RW. Complications and readmission after lumbar spine surgery in elderly patients: an analysis of 2,320 patients. Spine J. 2017;17(8):1106–12.
- Wang QP, et al. Global burden of low back pain in older adults, 1990–2021: a systematic analysis for the Global Burden of Disease Study 2021. Front Public Health. 2024;12:1291916. doi:10.3389/fpubh.2024.1291916.
- Bansal T, Sharan AD, Garg B. Enhanced recovery after surgery in spine surgery. J Clin Orthop Trauma. 2022;31:101944. doi:10.1016/j.jcot.2022.101944.
- Totala P, et al. Walking outcome after surgery in patients with lumbar spinal canal stenosis: comparison between open and minimally invasive techniques. Asian J Neurosurg. 2024;19(2):263–69.
- Shinwari H, Kamath AG, Gill SS, Sugand K. Gait analysis in degenerative lumbar spine disease: a systematic review. EFORT Open Rev. 2025;10(12):894–902.
- Sripadrao S, et al. Walking as an independent predictor of achieving minimal clinically important difference after surgery for lumbar spinal stenosis. Spine J. 2026;26(6):1061–69.
- Karcioglu O, Topacoglu H, Dikme O, Dikme O. A systematic review of the pain scales in adults: which to use Am J Emerg Med. 2018;36(4):707–14.
- Sydora BC, et al. Multimodal approaches for treating chronic low back pain: a comprehensive review. J Pain Res. 2024;17:2511–30.
- Dubé MO, Langevin P, Roy JS. Measurement properties of patient-reported outcome measures for chronic musculoskeletal pain: a systematic review. Pain Rep. 2021;6(4):e972. doi:10.1097/PR9.0000000000000972.
- Bittmann FN, Dech S, Aehle M, Schaefer LV. Manual muscle testing—force profiles and their reproducibility. Diagnostics (Basel). 2020;10(12):996. doi:10.3390/diagnostics10120996.
- Viveiro LAP, et al. Reliability and validity of the Functional Gait Assessment in older adults. J Geriatr Phys Ther. 2019;42(4):E45–54.
- Fujimori T, et al. Time course of physical function after lumbar fusion surgery. Spine J. 2016;16(6):728–36.
- Koivunen K, et al. Effectiveness of functional testing in predicting discharge destination after lumbar spine surgery: a prospective cohort study. BMC Surg. 2024;24(1):13. doi:10.1186/s12893-023-02292-4.
- Lee SY, et al. Diagnostic validity of patient-reported outcomes for lumbar spinal stenosis. PLoS One. 2020;15(1):e0226324. doi:10.1371/journal.pone.0226324.
- Amjad F, et al. Effect of functional tasks on pain and disability in patients with lumbar spine disorders. J Bodyw Mov Ther. 2022;32:176–82.
- Aktürk Z, et al. Exercise for reducing fear avoidance in people with chronic low back pain. Cochrane Database Syst Rev. 2025;(3):CD015455. doi:10.1002/14651858.CD015455.pub2.
- Cosci F, et al. Clinimetric properties of the Patient Health Questionnaire-9: a review. Braz J Psychiatry. 2024;46:e20233449. doi:10.47626/1516-4446-2023-3449.
- Yu C, et al. Gait analysis in lumbar degenerative disease: a systematic review. Neurospine. 2025;22(2):403–20.
- Azzellino G, et al. Functional recovery trajectories after lumbar spine surgery: a prospective study. J Clin Med. 2025;14(11):4009. doi:10.3390/jcm14114009.
- Wu Q, et al. Gait analysis in spinal disorders: a systematic review. J Orthop Translat. 2023;42:147–59.
- Sakaguchi T, et al. Machine learning prediction of functional recovery after lumbar surgery. J Clin Med. 2024;13(10):2915. doi:10.3390/jcm13102915.
- Manni T, et al. Functional tests for evaluating mobility after lumbar spine surgery: a systematic review. Arch Physiother. 2023;13(1):21. doi:10.1186/s40945-023-00172-1.
- Ito T, et al. Five-repetition sit-to-stand test in patients with lumbar degenerative disease. Healthcare (Basel). 2021;9(5):521. doi:10.3390/healthcare9050521.
- Bogaert L, et al. Clinical outcome measures in degenerative lumbar spine disorders: a systematic review. Eur Spine J. 2022;31(6):1525–45.
- Haddas R, et al. Objective functional assessment after lumbar spine surgery: a prospective cohort study. Spine J. 2026;26(6):1124–33.
- Heidari D, Shirvani H, Bazgir B, Shamsoddini A. Functional outcomes after lumbar spine surgery: a longitudinal study. Cell J. 2023;25(8):513–23.
- van Grafhorst J, van Furth W, Vleggeert-Lankamp C. Objective functional testing in lumbar spine surgery: current concepts and future directions. Brain Spine. 2024;4:103902. doi:10.1016/j.bas.2024.103902.