This protocol describes a survey-based workflow for examining how Agentic AI technological characteristics relate to cognitive surplus, psychological safety, and AI-human task reallocation among 331 employees. Partial least squares structural equation modeling with multi-group analysis reveals role-based differences between leaders and staff.
A subscription to JoVE is required to view this content. Sign in or start your free trial.
Research Article
How Agentic AI Reshapes Work: The Roles of Cognitive Surplus, Psychological Safety, and AI-Human Task Reallocation
In This Article
Summary
Abstract
This study examines how the technological characteristics of Agentic AI relate to employees' psychological states and behavioral responses in organizations. Drawing on Job Demands-Resources (JD-R) theory and Conservation of Resources (COR) theory, we conceptualize Agentic AI technological characteristics (AITC) as a higher-order construct comprising autonomous planning, multi-tool orchestration, and proactive feedback, and propose that these characteristics function as job resources associated with greater cognitive surplus and psychological safety, which in turn relate to AI-human task reallocation. We further investigate whether these relationships differ between leaders and staff. A cross-sectional, anonymous online survey was administered via an online survey platform to participants recruited through a research panel using purposive nonprobability sampling; eligibility was restricted to adults with current or prior AI-related work experience, and screened, attention-checked responses yielded a final sample of 331 employees (171 leaders, 160 staff). All constructs were measured with validated scales adapted to the Agentic AI context on 7-point Likert scales. Data were analyzed using partial least squares structural equation modeling (PLS-SEM), applying a two-stage approach for the second-order construct, bootstrapping with 5,000 resamples for direct and indirect effects, and multi-group analysis (MGA) for leader-staff comparisons. The measurement model demonstrated acceptable reliability and validity, and the structural results were consistent with the theorized resource-gain model: AITC was positively associated with cognitive surplus, psychological safety, and task reallocation, with significant mediation pathways and stronger AITC-resource associations among leaders. By focusing on psychological mechanisms rather than technical performance, this study extends emerging Agentic AI research and offers practical implications for role-differentiated AI adoption strategies.
Introduction
The proliferation of Agentic AI is redefining the role of artificial intelligence in industries and organizational life1,2. Agentic AI can be defined as an advanced form of artificial intelligence that perceives changing environments, sets goals independently through reasoning mechanisms, and orchestrates sequences of actions with minimal human oversight3,4. It is distinguished from traditional AI, including conventional generative AI tools, in three respects: autonomy, because agentic systems pursue objectives with minimal human intervention rather than executing pre-programmed rules5,6; core function, because their purpose is to automate complex workflows rather than single tasks7; and architecture, because they coordinate multiple large language models, application programming interfaces (APIs), and agents rather than relying on a single model7. These capabilities rest on the defining technological characteristics examined in this study8,9. Autonomous planning (AP) means that, given a user's goal, the system independently decomposes it into sub-tasks and revises its plan as constraints change10; for example, an employee can provide a one-line instruction and receive a workable multi-step project plan. Multi-tool orchestration (MTO) means that the system selects, sequences, and integrates external tools and APIs1,11,12; for example, combining web search, document editors, and data-analysis tools to produce a single coherent report. Proactive feedback (PF) means that the system flags errors, missing information, and risky assumptions before being asked10,13; for example, reminding an employee of validation or compliance checkpoints during task execution. We focus on these three characteristics, collectively termed Agentic AI technological characteristics (AITC), because they are the functional capabilities that differentiate agentic from traditional AI in everyday work7,10; attributes such as transparency, controllability, and explainability matter for AI trust in general but are not specific to the agentic paradigm, and we therefore treat them as boundary conditions for future research rather than focal dimensions.
Despite the rapid diffusion of Agentic AI in workplaces, the extant literature has primarily addressed its technical architecture, operational efficiency, and task-automation capabilities, while paying comparatively little attention to how these characteristics reshape employees' psychological states and behavioral responses14,15. This omission matters because reallocating tasks between humans and AI is not a purely technical adjustment but a psychologically and organizationally embedded process: employees must challenge existing workflows, redefine role boundaries, and accept new forms of collaboration with intelligent systems16,17. Such changes do not occur automatically simply because advanced technology is available. Accordingly, the purpose of this study is threefold: to examine whether AITC function as job resources associated with cognitive surplus, psychological safety, and AI-human task reallocation; to investigate the mediating and sequentially mediating roles of cognitive surplus and psychological safety; and to explore whether these structural relationships differ between leaders and staff. The novelty of this study is threefold. First, it conceptualizes and operationalizes Agentic AI technological characteristics—autonomous planning, multi-tool orchestration, and proactive feedback—as a higher-order job resource within the JD-R framework, rather than treating AI adoption as an undifferentiated context. Second, it introduces AI-human task reallocation as a domain-specific, technology-enacted form of task crafting, distinct from both generic job crafting and top-down digital-transformation outcomes. Third, it provides, to our knowledge, the first multi-group evidence that the resource-generating associations of Agentic AI differ systematically between leaders and staff.
The theoretical rationale integrates Job Demands-Resources (JD-R) theory and Conservation of Resources (COR) theory. JD-R theory holds that every job comprises job demands, the physical, emotional, and cognitive aspects of work that require sustained effort, and job resources, the aspects that reduce demands, support goal achievement, and stimulate personal development; their balance shapes engagement, well-being, and performance18,19. COR theory adds a dynamic mechanism: individuals strive to obtain, retain, and protect valued resources, and accumulated resources initiate gain spirals in which existing resources are reinvested to acquire further resources20,21,22. From this joint perspective, AITC can be conceptualized not merely as technical features but as a new form of job resource: by absorbing repetitive and cognitively taxing tasks such as planning and diagnostic analysis, agentic systems reduce demands and conserve employees' cognitive energy and time15,23. We define cognitive surplus (CS) as the reservoir of cognitive energy and discretionary time that becomes available when such routine tasks are delegated to technology, and that can be reinvested in collective participation, collaboration, and the creation of new value24. CS is thus conceptually distinct from work engagement, which is an affective-motivational state, and from mere time availability, because it denotes a convertible stock of personal resources in the COR sense20,24. CS is likewise distinct from psychological detachment and recovery, which concern the restoration of depleted energy away from work, and from time affluence, which denotes the subjective perception of having enough time; CS instead refers to freed cognitive capacity that remains available for reinvestment during work itself. In COR terms, accumulated CS represents a resource gain that should support occupational well-being by buffering exhaustion and burnout, whereas its absorption by additional routine demands would signal resource loss20,23,24. Whether conserved time actually converts into surplus may depend on individual characteristics such as AI literacy, on workload norms that can absorb saved time with additional demands, and on organizational culture; we therefore treat the resource-gain pathway as a hypothesis to be tested rather than an assumption.
H1: AITC is positively associated with CS.
Psychological safety (PS) is defined as the belief that one's work environment is safe for interpersonal risk-taking, such as admitting mistakes, asking for help, and challenging the status quo25,26. Although psychological safety has often been studied as a team-level climate, this study conceptualizes and measures it as an individual-level perception, consistent with our individual-level survey design27,28. When agentic systems provide learning-oriented feedback and supportive tools, the interpersonal cost of experimenting and exposing errors may decline, because employees can test and correct their work before presenting it to others26,28. We acknowledge, however, that the opposite dynamic is plausible: where agentic systems are deployed for surveillance or fault-finding accountability, perceived interpersonal risk and mistrust may increase29,30. Because the characteristics examined here are assistive rather than evaluative in nature, we hypothesize a positive association while treating this two-sided possibility as an important boundary condition.
H2: AITC is positively associated with PS.
We define AI-human task reallocation (AHTR) as employees' self-initiated redistribution of tasks between themselves and AI systems, delegating routine work to AI while expanding their own strategic and creative responsibilities. We position AHTR as a domain-specific form of job crafting. In the JD-R-based model of Tims and Bakker, job crafting comprises increasing job resources, increasing challenge demands, and decreasing hindrance demands17,31; in the typology of Wrzesniewski and Dutton, it comprises task, relational, and cognitive crafting32. AHTR corresponds most closely to task crafting enacted through technology: offloading routine tasks to AI simultaneously decreases hindrance demands and mobilizes a new job resource17,23,32. It is narrower than a general digital-transformation outcome because it captures discretionary, employee-initiated changes in task boundaries rather than top-down organizational redesign33. We privilege task reallocation over relational and cognitive crafting because the redistribution of tasks is the most immediate behavioral interface between employees and agentic systems and is directly observable in early adoption, whereas relational and cognitive crafting typically emerge as downstream adaptations31,32. Unlike prior studies that treat AI adoption as a contextual antecedent of general job crafting16,34, we model the reallocation itself as the focal crafting behavior. Because such reallocation disrupts established workflows, employees are more likely to enact it when they possess sufficient cognitive resources to redesign their work and feel psychologically safe to take the associated interpersonal risks16,34. Within the gain-spiral logic of COR theory, psychological safety also functions as a contextual resource that protects and amplifies the accumulation of cognitive surplus22.
H3: CS is positively associated with AHTR.
H5: PS is positively associated with AHTR.
H6: PS is positively associated with CS.
H9: AITC is positively associated with AHTR.
Integrating these arguments, AITC is expected to relate to AHTR not only directly but also indirectly, through the resource-gain pathways of cognitive surplus and psychological safety.
H4: CS mediates the relationship between AITC and AHTR.
H7: PS mediates the relationship between AITC and AHTR.
H8: PS and CS sequentially mediate the relationship between AITC and AHTR.
Finally, employees do not interpret and respond to Agentic AI uniformly. Gibson, Cooper, and Conger described perceptual distance between leaders and their teams as cognitive discrepancy regarding the same organizational objectives, rooted in asymmetries of information access, accountability, risk exposure, and work experience35. Building on this view, leaders and staff occupy structurally different positions with respect to AI adoption: leaders carry strategic accountability and tend to frame AI as an augmentation-oriented resource for productivity and data-driven decision-making, whereas staff are relatively more exposed to automation-related job insecurity and learning overload20,30. We treat these patterns as tendencies to be tested empirically rather than fixed dispositions of either group. Such role-based discrepancies may generate heterogeneous patterns in the relationships among AITC, CS, PS, and AHTR, yet empirical research that explicitly captures these group differences remains limited.
H10a: The associations of AITC with CS and PS differ between leaders and staff.
H10b: The associations of PS and CS with AHTR differ between leaders and staff.
The protocol below describes the complete workflow, from participant recruitment and screening through survey administration, data cleaning, measurement validation, structural model estimation, mediation analysis, and multi-group analysis (MGA) (Figure 1), so that the procedure can be independently replicated. The research model is depicted in Figure 2: AITC, modeled as a second-order construct comprising AP, MTO, and PF, relates to AHTR directly and indirectly through CS and PS, with PS also relating to CS; the leader-staff role difference is examined through MGA.
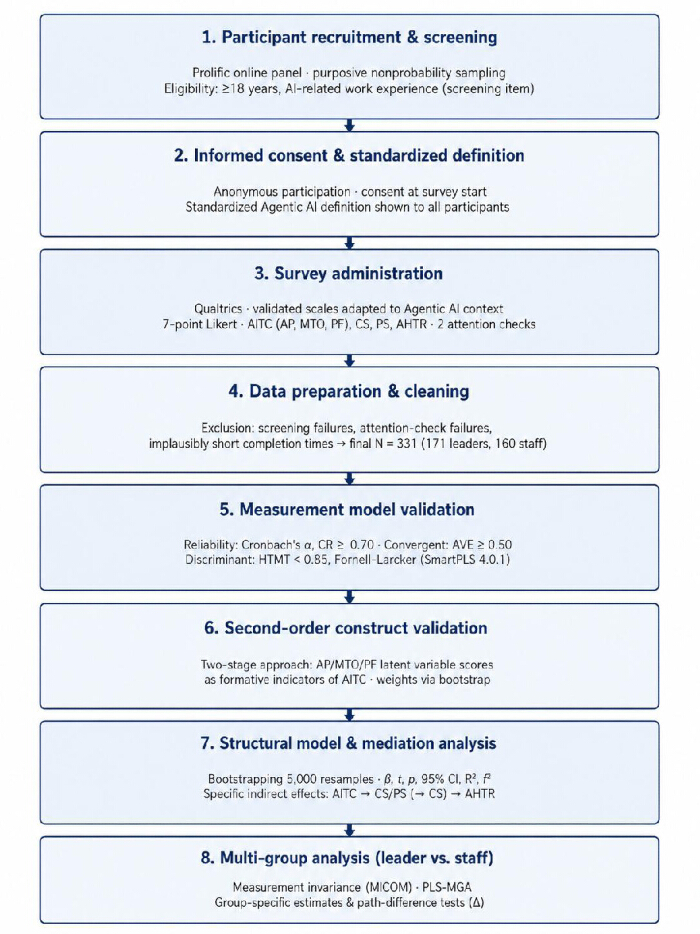
Figure 1. Overall study-design workflow. Schematic of the complete research protocol. Participants were recruited via the online panel using purposive nonprobability sampling and screened for AI-related work experience; eligible respondents completed an anonymous survey measuring all constructs on 7-point Likert scales. After data cleaning (screening failures, attention-check failures, and implausibly short completion times removed; final N = 331), the measurement model was validated (reliability: Cronbach's α, composite reliability; convergent validity: average variance extracted; discriminant validity: HTMT and Fornell-Larcker), the second-order construct was validated via the two-stage approach, and the structural model, mediation pathways, and leader-staff multi-group analysis were estimated with 5,000 bootstrap resamples. Please click here to view a larger version of this figure.
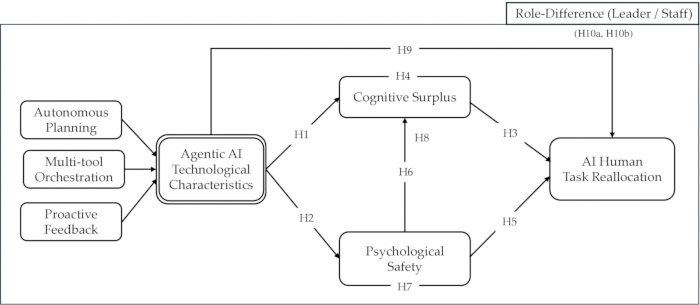
Figure 2. Proposed research model. Conceptual model of hypothesized relationships. Agentic AI technological characteristics (AITC), a second-order construct comprising autonomous planning (AP; the system's capacity to decompose goals into sub-tasks and revise plans), multi-tool orchestration (MTO; the capacity to select, sequence, and integrate multiple tools and APIs), and proactive feedback (PF; the capacity to flag errors and risks unprompted), is hypothesized to be positively associated with cognitive surplus (CS; the reservoir of cognitive energy and discretionary time freed when routine tasks are delegated to AI), psychological safety (PS; the perception that the work environment is safe for interpersonal risk-taking), and AI-human task reallocation (AHTR; employees' self-initiated redistribution of tasks between themselves and AI) (H1, H2, H9). CS and PS are hypothesized to be positively associated with AHTR (H3, H5), PS with CS (H6), and CS and PS to mediate, individually and sequentially, the AITC-AHTR relationship (H4, H7, H8). Arrows represent hypothesized structural paths; H10a/H10b denote hypothesized leader-staff differences tested via multi-group analysis. Please click here to view a larger version of this figure.
Access restricted. Please log in or start a trial to view this content.
Protocol
All procedures were performed in accordance with the ethical standards for research involving human participants at aSSIST University and Dong-A University. Since all responses were anonymized upon collection and no personal identifiable information was collected at any stage, the Institutional Review Board of aSSIST University determined that the study was exempt from full review pursuant to Article 15 of the Bioethics and Safety Act of the Republic of Korea and Article 13 of its Enforcement Rule. The survey opened with an information and consent page stating that participation was restricted to individuals currently employed and involved in an AI project, describing the study purpose, and explaining the voluntary nature of participation, the anonymity of responses, and the intended use of the data; only respondents who explicitly agreed proceeded to the questionnaire. The consent page is provided in Supplementary File 1.
Sample size determination
An a priori power analysis was conducted before data collection using G*Power 3.1.9.7 (RRID: SCR_013726) for the linear multiple regression family, specifying the largest number of predictors directed at a single endogenous construct in the model; in this study, AHTR is predicted by three constructs (AITC, CS, and PS). With a medium effect size (f2 = 0.15), α = 0.05, and statistical power of 0.80, the required minimum sample was 77 cases; the G*Power protocol output is provided in Supplementary File 2. The minimum sample size was cross-checked using the inverse square root method for PLS-SEM36, under which approximately 155 cases are required to detect a minimum standardized path coefficient of approximately 0.20 at the 5% significance level with 80% power. Finally, the recruitment target was set to exceed both minima substantially, in order to support bootstrapping of indirect effects and split-sample multi-group analysis; the final sample (N = 331; leaders n = 171, staff n = 160) satisfied the minimum sample requirement within each subgroup.
Participant recruitment and screening
Participants were recruited through the online research panel using purposive nonprobability sampling; that is, the sample was deliberately restricted to respondents satisfying an a priori substantive criterion—current or prior work experience involving AI—rather than drawn at random from the general population. Eligibility was restricted to respondents aged 18 years or older. AI-related work experience was operationalized through the screening item “Which of the following best describes your current situation?”, presented before the main questionnaire; only respondents who indicated that they were currently employed and currently involved in AI-related work proceeded, whereas the remaining options (employed but not involved in AI work; not employed but previously involved; not employed and not involved) triggered immediate screen-out. Data collection was run in a single session on 8 February 2026 (10:28–13:30), and participants were compensated at GBP 6.98 per hour in accordance with the platform’s fair-pay policy. Duplicate participation was prevented through the platform’s unique participant identifiers and the survey platform’s duplicate-response prevention settings. The number of respondents at each stage was recorded to document the inclusion/exclusion workflow: 537 responses were recorded; 151 were screened out by the screening questions (386 remaining); 40 were removed for failing the attention checks, including straight lining (346 remaining); and 15 were removed for implausibly short completion times (under approximately 180 s), yielding the final sample of N = 331.
Standardized definition and survey instructions
Participants were informed that the survey examined how Agentic AI may affect organizations and their members. At the start of the survey, all participants were shown a brief standardized definition of Agentic AI, consistent with the definition given in the Introduction—an advanced AI system characterized by autonomous planning, multi-tool orchestration, and proactive feedback that performs goal-directed actions with limited human oversight (Figure 1, step 2). Eligibility was restricted to respondents who were currently employed and involved in an AI project, which provided a relevant work-related basis for responding to the questionnaire. No separate comprehension-check item was included; the standardized definition therefore served as a contextual orientation rather than a verified comprehension check. Participants were instructed to answer every item based on their actual experience of using or working with such Agentic AI systems in organizational contexts.
Survey instrument development and administration
The questionnaire was developed from validated measurement scales adapted to the Agentic AI organizational context. Table 1 lists every item, its source scale, and descriptive statistics: AP, MTO, and PF items were adapted from recent Agentic AI conceptualizations7,8; CS items from generative-AI cognitive-resource research37; PS items from Plomp et al.38; and AHTR items from JD-R-based job crafting scales17,39 adapted to task reallocation. All constructs were measured on 7-point Likert scales ranging from 1 (“strongly disagree”) to 7 (“strongly agree”). The survey was organized into blocks covering the consent page, screening, AITC items (AP, MTO, PF), CS, PS, AHTR, and demographic/control characteristics; the instrument also contained additional scales (AI literacy and role-breadth self-efficacy) that are beyond the scope of the present model and were collected but not analyzed here, reported for transparency. The survey was hosted on the online survey platform; the back button was disabled so that respondents could not revise earlier answers, and items were presented in a fixed order within blocks. The median completion time was 7 min 44 s. Two instructed-response attention-check items were embedded as survey-flow branches that closed the survey when answered incorrectly: (i) a factual check, “Is AI an abbreviation for Artichoke Information?” (correct answer: No), and (ii) a scale-comprehension check confirming that responses were recorded on a 7-point Likert scale ranging from “strongly disagree” to “strongly agree”. Before the main administration, a pilot test was conducted with 124 respondents to evaluate the clarity of the survey items, the overall survey flow, completion duration, and the feasibility of the questionnaire; completion duration was reviewed to identify unusually short responses and to confirm that the survey length was appropriate for the target respondents. The pilot test did not indicate any wording problems requiring item revision, and no wording changes were made prior to the main survey. In addition, the pilot data were analyzed using PLS-SEM as a preliminary validation procedure to assess indicator performance, construct reliability, convergent validity, discriminant validity, collinearity, and the plausibility of the proposed structural relationships; the results supported the suitability of the instrument for the main survey.
| Construct | Item | Question | Mean | STDEV | VIF | Source | |||
| AITC | AP | AP1 | When I provide a goal, the AI helps create a multi-step plan to reach it. | 5.81 | 0.9 | 1.44 | Abou Ali, M., et al. (2025) ; Sapkota, R., et al. (2025) | ||
| AP2 | The AI can revise its plan when constraints or requirements change. | 5.75 | 0.99 | 1.37 | |||||
| AP3 | The AI breaks complex work into manageable sub-tasks without needing step-by-step instructions. | 5.33 | 1.37 | 1.33 | |||||
| MTO | MTO1 | The AI can combine multiple tools or apps (e.g., search, documents, data tools) to complete a task. | 5.69 | 1.11 | 1.5 | ||||
| MTO2 | The AI suggests the right tool(s) and uses them in the correct sequence to produce a deliverable. | 5.36 | 1.04 | 1.64 | |||||
| MTO3 | The AI helps integrate outputs from different tools into one coherent result. | 5.61 | 1.01 | 1.63 | |||||
| PF | PF1 | The AI proactively points out errors, missing information, or risky assumptions in my work. | 4.9 | 1.44 | 1.68 | ||||
| PF2 | The AI suggests improvements before I explicitly ask for feedback. | 5.07 | 1.38 | 1.85 | |||||
| PF3 | The AI reminds me of checkpoints (e.g., validation, compliance, quality) to prevent rework. | 5.02 | 1.4 | 1.6 | |||||
| CS | CS1 | Using AI has freed up my mental energy to focus on more complex and meaningful work. | 5.59 | 1.28 | 2.07 | Liu, Y., Sheng, F., & Liu, R. (2025) | |||
| CS2 | I have more time available for strategic thinking and problem-solving since using AI. | 5.61 | 1.23 | 2.38 | |||||
| CS3 | The workload from routine tasks has decreased significantly, giving me headspace for new initiatives. | 5.42 | 1.28 | 2.23 | |||||
| CS4 | I feel less mentally exhausted at the end of the workday because AI handles repetitive tasks. | 5.15 | 1.5 | 1.91 | |||||
| PS | PS1 | In my workplace, it is safe to take a risk related to using AI in new ways. | 4.74 | 1.37 | 1.52 | Plomp et al. (2019) | |||
| PS2 | My manager encourages experimentation with AI and is tolerant of mistakes. | 4.52 | 1.61 | 1.68 | |||||
| PS3 | I feel comfortable speaking up if I have concerns about how AI is being used in my team. | 5.48 | 1.24 | 1.32 | |||||
| PS4 | My colleagues are supportive if I try new ways of working with AI. | 5.26 | 1.32 | 1.48 | |||||
| PS5 (excluded) | I am not afraid of negative consequences if I propose innovative uses of AI in my work. | 4.47 | 1.59 | 1.23 | |||||
| AHTR | AHTR1 | I deliberately transfer routine tasks (e.g., data entry, report formatting) to AI so I can focus on higher-value work. | 5.12 | 1.35 | 1.68 | Tims, M., & Bakker, A. B. (2010); Li, W. et al. (2024) | |||
| AHTR2 | I actively seek opportunities to use AI to handle tasks I previously did manually. | 5.58 | 1.28 | 1.84 | |||||
| AHTR3 | Since using AI, I have taken on new or expanded responsibilities that are more strategic or creative. | 5.18 | 1.3 | 1.58 | |||||
| AHTR4 (excluded) | I negotiate with my manager about which tasks AI should handle and which I should do. | 4.09 | 1.65 | 1.23 | |||||
| AHTR5 | I have redesigned my job by reallocating routine work to AI, freeing myself for more meaningful tasks. | 4.92 | 1.35 | 1.67 | |||||
Table 1: Measurement items, sources, descriptive statistics, and full collinearity assessment. Complete survey instrument. Each item is listed with its construct (AITC dimensions AP, MTO, PF; CS; PS; AHTR), item code, wording, mean, standard deviation (STDEV), full collinearity variance inflation factor (VIF; values <3.3 indicate the absence of common method variance contamination), and the source scale from which it was adapted. All items were measured on 7-point Likert scales (1 = strongly disagree, 7 = strongly agree). PS5 and AHTR4 were removed during measurement model evaluation due to low outer loadings. AITC = Agentic AI technological characteristics; AP = autonomous planning; MTO = multi-tool orchestration; PF = proactive feedback; CS = cognitive surplus; PS = psychological safety; AHTR = AI-human task reallocation. Please click here to download this Table.
Data preparation and cleaning
The raw responses were exported in CSV format. Cases failing the screening criterion or either attention-check item were excluded, as were responses with substantial missing data (forced-response settings minimized within-survey missingness); the resulting exclusion counts at each stage are documented in protocol section 2 (537 recorded → 331 retained). The retained data were inspected for consistency and screened for inattentive response patterns: straight-lining responses were removed via the attention checks, and responses with implausibly short completion times (under approximately 180 s) were excluded. Variables were then coded for analysis (e.g., Role: Leader = 1, Staff = 0; Gender: Male = 1, Female = 0) as documented in Table 2, categorical controls such as industry were dummy-coded with k-1 indicators, and the finalized dataset was imported into the PLS-SEM software. A codebook mapping every variable to its item text, coding, and construct is provided as Supplementary File 2.
Measurement model evaluation
Using the PLS-SEM software, each observed item was assigned to its latent construct, and all first-order constructs (AP, MTO, PF, CS, PS, AHTR) were specified as reflective. AITC was specified as a second-order construct comprising AP, MTO, and PF and was estimated with the two-stage approach40,41,42: latent variable scores were first obtained for the first-order constructs and then used (AP_LVS, MTO_LVS, PF_LVS) as formative indicators of AITC. The PLS algorithm was run with the path weighting scheme, a maximum of 3,000 iterations, and a stop criterion of 10−7. Internal consistency reliability was evaluated against Cronbach’s α and composite reliability (CR) thresholds of 0.7043, treating α values of 0.5–0.6 as marginally acceptable for short scales in emerging research contexts43; convergent validity was evaluated against the average variance extracted (AVE) threshold of 0.5044; and discriminant validity was evaluated using the heterotrait-monotrait ratio (HTMT <0.85, conservative threshold)45 and the Fornell-Larcker criterion44. Where reliability or convergent validity criteria were not met, outer loadings were inspected, and poorly performing indicators were removed while preserving content validity, with every removal and its rationale documented; in this study, PS5 and AHTR4 were removed due to low outer loadings, which improved the convergent validity of PS and AHTR.
Structural model and mediation analysis
The structural paths were specified in accordance with the research model (Figure 2), and collinearity among predictor constructs was examined using inner-model variance inflation factors (VIF < 5.0)36 and full collinearity VIFs (<3.3)46,47. Path significance was estimated by bootstrapping with 5,000 resamples using percentile confidence intervals and two-tailed testing, and standardized path coefficients (β), sample means (M), standard deviations (STDEV), t-values, p-values, 95% confidence intervals, R2, and effect sizes (f2) were reported. Out-of-sample predictive power was assessed using PLSpredict with 10 folds and 10 repetitions; for each endogenous indicator, Q2predict (>0 indicates predictive relevance) was inspected, and the PLS-SEM prediction errors (RMSE and MAE) were compared against the linear-model (LM) benchmark48. For the mediation analysis, the indirect effects of AITC on AHTR through CS, through PS, and through the sequential PS → CS pathway were specified, and each specific indirect effect was evaluated using the bootstrap distribution (5,000 resamples), with an indirect effect judged significant when its 95% confidence interval excluded zero.
Multi-group analysis
Respondents were classified into leader and staff groups based on self-reported organizational role (Role: Leader = 1, Staff = 0; Table 2); the leader group comprised team leads/supervisors, managers/department heads, and executives/senior leadership, and the staff group comprised staff-level employees. Before path coefficients were compared, measurement invariance across groups was established using the measurement invariance of composite models (MICOM) procedure45. Step 1 (configural invariance) was satisfied by identical model specification across groups, and step 2 (compositional invariance) was supported for all constructs, with original correlations at or above their 5% quantiles and non-significant permutation p-values (AHTR c = 0.999, p = 0.524; AITC c = 0.954, p = 0.205; CS c = 1.000, p = 0.800; PS c = 0.976, p = 0.073), establishing partial measurement invariance and justifying the multi-group comparison (full MICOM results in Supplementary File 3). The model was then estimated separately for each group, and path differences were tested using bootstrap-based PLS-MGA, with one-tailed and two-tailed p-values reported for the leader-staff difference (Δ) of each path; group-specific path coefficients, t-values, and p-values were reported for all direct and indirect paths, together with the magnitude of each between-group difference.
Reporting, verification, and troubleshooting
All reliability, validity, structural, mediation, and MGA outputs were compiled; the result tables were exported; and every reported statistic was verified against the software-generated output to ensure consistency across tables, figures, and text. For troubleshooting, the following guidelines apply: if many responses fail screening or attention checks, refine the eligibility requirements and clarify the survey instructions; if reliability (CR < 0.70) or convergent validity (AVE < 0.50) criteria are unmet, review outer loadings and remove weak indicators while preserving theoretical coverage; if collinearity is identified (VIF above thresholds), re-evaluate construct specifications and eliminate redundant indicators; if mediation or group effects are non-significant, re-examine sample adequacy and construct operationalization before interpretation; and use an adequate number of bootstrap resamples (e.g., 5,000) to stabilize estimates.
Access restricted. Please log in or start a trial to view this content.
Results
Participant characteristics
Table 2 presents the demographic characteristics of the final sample (N = 331). The sample comprised 65.0% male and 35.0% female respondents, with a relatively balanced distribution between leaders (51.7%, n = 171) and staff (48.3%, n = 160). The largest age group was under 30 years (46.5%), followed by 31–40 years (32.0%); 76.4% held undergraduate or postgraduate degrees. Respondents were drawn from a range of industries, led by te...
Access restricted. Please log in or start a trial to view this content.
Discussion
This study examined how the technological characteristics of Agentic AI relate to employees' psychological resources and task-reallocation behavior, and whether these relationships differ across organizational roles. Using a cross-sectional survey of 331 AI-experienced employees and PLS-SEM with mediation and multi-group analysis, the results were consistent with the theorized resource-gain model: AITC was positively associated with cognitive surplus, psychological safety, and AI-human task reallocation; cognitive su...
Access restricted. Please log in or start a trial to view this content.
Disclosures
The authors declare no conflicts of interest.
A generative AI tool (ChatGPT, OpenAI) was used for language editing; all content was reviewed and verified by the authors, who also checked that AI-assisted editing did not introduce shifts in terminology or tone across sections.
Acknowledgements
This work was supported by research funding from aSSIST University.
Access restricted. Please log in or start a trial to view this content.
Materials
| Name | Company | Catalog Number | Comments |
|---|---|---|---|
| Prolific | Prolific | https://www.prolific.com/ | Online survey pannel provider |
| Qualtrics | Qualtrics, LLC | https://www.qualtrics.com/ | Survey coding |
| SmartPLS | SmartPLS GmbH | version 4.0.1, https://www.smartpls.com/ | PLS-SEM analysis |
References
- Chawla C, Chatterjee S, Gadadinni SS, Verma P, Banerjee S. Agentic AI: The building blocks of sophisticated AI business applications. Journal of AI, Robotics & Workplace Automation. 2024;3(3):196–210.
- Lu C, et al. The AI scientist: Towards fully automated open-ended scientific discovery. arXiv [Preprint]. 2024. arXiv:2408.06292. Available from: https://arxiv.org/abs/2408.06292.
- Xie J, Chen Z, Zhang R, Wan X, Li G. Large multimodal agents: A survey. arXiv [Preprint]. 2024. arXiv:2402.15116. Available from: https://arxiv.org/abs/2402.15116.
- Du H, Thudumu S, Vasa R, Mouzakis K. A survey on context-aware multi-agent systems: Techniques, challenges and future directions. arXiv [Preprint]. 2024. arXiv:2402.01968. Available from: https://arxiv.org/abs/2402.01968.
- Acharya DB, Kuppan K, Divya B. Agentic AI: Autonomous intelligence for complex goals - a comprehensive survey. IEEE Access. 2025;13:18912–18936.
- Calegari R, Ciatto G, Mascardi V, Omicini A. Logic-based technologies for multi-agent systems: A systematic literature review. Auton Agent Multi Agent Syst. 2021;35(1):1.
- Sapkota R, Roumeliotis KI, Karkee M. AI agents vs. Agentic AI: A conceptual taxonomy, applications and challenges. Inf Fusion. 2026;126:103599.
- Abou Ali M, Dornaika F, Charafeddine J. Agentic AI: A comprehensive survey of architectures, applications, and future directions. Artif Intell Rev. 2025;59(1):11.
- Buyya R. Agentic artificial intelligence (AI): Architectures, taxonomies, and evaluation of large language model agents. arXiv [Preprint]. 2026. arXiv:2601.12560. Available from: https://arxiv.org/abs/2601.12560.
- Nisa U, Shirazi M, Saip MA, Pozi MSM. Agentic AI: The age of reasoning - a review. J Autom Intell. 2025. doi:10.1016/j.jai.2025.08.003.
- Singh A, Ehtesham A, Kumar S, Khoei TT. Enhancing AI systems with agentic workflows patterns in large language model. In: 2024 IEEE World AI IoT Congress (AIIoT); Seattle, WA; 2024:527–532.
- Zeng A, et al. AgentTuning: Enabling generalized agent abilities for LLMs. In: Findings of the Association for Computational Linguistics: ACL 2024; Bangkok, Thailand; 2024:3053–3077.
- Liu X, Zhang L, Wei X. Generative artificial intelligence literacy: Scale development and its effect on job performance. Behav Sci (Basel). 2025;15(6):811.
- Wooldridge M, Jennings NR. Intelligent agents: Theory and practice. Knowl Eng Rev. 1995;10(2):115–152.
- Masterman T, Besen S, Sawtell M, Chao A. The landscape of emerging AI agent architectures for reasoning, planning, and tool calling: A survey. arXiv [Preprint]. 2024. arXiv:2404.11584. Available from: https://arxiv.org/abs/2404.11584.
- Sha C, Chai T. When digital-AI transformation sparks adaptation: Job crafting and AI knowledge in job insecurity contexts. Front Psychol. 2025;16:1612245.
- Tims M, Bakker AB. Job crafting: Towards a new model of individual job redesign. SA J Ind Psychol. 2010;36(2):1–9.
- Bakker AB, Hakanen JJ, Demerouti E, Xanthopoulou D. Job resources boost work engagement, particularly when job demands are high. J Educ Psychol. 2007;99(2):274–284.
- Bakker AB, Demerouti E, Sanz-Vergel A. Job demands-resources theory: Ten years later. Annu Rev Organ Psychol Organ Behav. 2023;10(1):25–53.
- Hobfoll SE, Shirom A. Conservation of resources theory: Applications to stress and management in the workplace. In: Golembiewski RT, ed. Handbook of Organizational Behavior. 2nd ed. Marcel Dekker; New York; 2000:57–80.
- Hobfoll SE. Conservation of resources: A new attempt at conceptualizing stress. Am Psychol. 1989;44(3):513–524.
- Hobfoll SE, Halbesleben J, Neveu JP, Westman M. Conservation of resources in the organizational context: The reality of resources and their consequences. Annu Rev Organ Psychol Organ Behav. 2018;5(1):103–128.
- Bakker AB, Demerouti E. Job demands-resources theory: Taking stock and looking forward. J Occup Health Psychol. 2017;22(3):273–285.
- Shirky C. Cognitive Surplus: How Technology Makes Consumers into Collaborators. Penguin Press; New York; 2010.
- Edmondson A. Psychological safety and learning behavior in work teams. Adm Sci Q. 1999;44(2):350–383.
- Zhao G, Kumar N, Wang C, Liu Z. Bridging the AI gap: How AI-oriented leadership empowers non-technical employees in AI-based innovation engagement. Leadersh Organ Dev J. 2026;47(3):498–514.
- Edmondson AC, Lei Z. Psychological safety: The history, renaissance, and future of an interpersonal construct. Annu Rev Organ Psychol Organ Behav. 2014;1(1):23–43.
- Kim BJ, Kim MJ, Lee J. The dark side of artificial intelligence adoption: Linking artificial intelligence adoption to employee depression via psychological safety and ethical leadership. Humanit Soc Sci Commun. 2025;12(1):1–14.
- Cardon PW, Ma H, Fleischmann C. Recorded business meetings and AI algorithmic tools: Negotiating privacy concerns, psychological safety, and control. Int J Bus Commun. 2023;60(4):1095–1122.
- Raisch S, Krakowski S. Artificial intelligence and management: The automation-augmentation paradox. Acad Manage Rev. 2021;46(1):192–210.
- Tims M, Bakker AB, Derks D. Development and validation of the job crafting scale. J Vocat Behav. 2012;80(1):173–186.
- Wrzesniewski A, Dutton JE. Crafting a job: Revisioning employees as active crafters of their work. Acad Manage Rev. 2001;26(2):179–201.
- Grant AM, Parker SK. Redesigning work design theories: The rise of relational and proactive perspectives. Acad Manag Ann. 2009;3(1):317–375.
- Liu Q, Tian Q, Li X, Tan H. How does organizational AI adoption affect employees’ job crafting behaviors? An approach-avoidance perspective. Front Psychol. 2025;16:1690238.
- Gibson CB, Cooper CD, Conger JA. Do you see what we see? The complex effects of perceptual distance between leaders and teams. J Appl Psychol. 2009;94(1):62–76.
- Hair JF, et al. Partial Least Squares Structural Equation Modeling (PLS-SEM) Using R: A Workbook. Springer; Cham; 2021:1–56.
- Liu Y, Sheng F, Liu R. Generative AI adoption and employee outcomes: A conservation of resources perspective on job crafting, career commitment, and the moderating role of liking of AI. Humanit Soc Sci Commun. 2025;12:1376.
- Plomp J, Tims M, Khapova SN, Jansen PG, Bakker AB. Psychological safety, job crafting, and employability: A comparison between permanent and temporary workers. Front Psychol. 2019;10:974.
- Li W, et al. Embracing artificial intelligence (AI) with job crafting: Exploring trickle-down effect and employees’ outcomes. Tour Manag. 2024;104:104935.
- Gaskin J, Godfrey S, Vance A. Successful system use: It’s not just who you are, but what you do. AIS Trans Hum Comput Interact. 2018;10(2):57–81.
- Marakas G, Johnson R, Clay PF. The evolving nature of the computer self-efficacy construct: An empirical investigation of measurement construction, validity, reliability and stability over time. J Assoc Inf Syst. 2007;8(1):2.
- Loch KD, Straub DW, Kamel S. Diffusing the Internet in the Arab world: The role of social norms and technological culturation. Global Information Systems. 2008;143–175.
- Nunnally JC. Psychometric Theory. 2nd ed. McGraw-Hill; New York; 1978.
- Fornell C, Larcker DF. Evaluating structural equation models with unobservable variables and measurement error. J Mark Res. 1981;18(1):39–50.
- Henseler J, Ringle CM, Sarstedt M. A new criterion for assessing discriminant validity in variance-based structural equation modeling. J Acad Mark Sci. 2015;43(1):115–135.
- Kock N. Common method bias in PLS-SEM: A full collinearity assessment approach. Int J e-Collab. 2015;11(4):1–10.
- Kock N, Lynn GS. Lateral collinearity and misleading results in variance-based SEM: An illustration and recommendations. J Assoc Inf Syst. 2012;13(7):2.
- Shmueli G, et al. Predictive model assessment in PLS-SEM: Guidelines for using PLSpredict. Eur J Mark. 2019;53(11):2322–2347.
- Podsakoff PM, MacKenzie SB, Lee JY, Podsakoff NP. Common method biases in behavioral research: A critical review of the literature and recommended remedies. J Appl Psychol. 2003;88(5):879–903.
- Podsakoff PM, MacKenzie SB, Podsakoff NP. Sources of method bias in social science research and recommendations on how to control it. Annu Rev Psychol. 2012;63(1):539–569.
- Harman HH. Modern Factor Analysis. 3rd ed. University of Chicago Press; Chicago; 1976.
- Podsakoff PM, Organ DW. Self-reports in organizational research: Problems and prospects. J Manage. 1986;12(4):531–544.
Access restricted. Please log in or start a trial to view this content.