Here, we present a rapid ferric ammonium citrate-based iron overload model in C2C12 myoblasts that produces iron loading, ferroptosis-associated molecular changes, and early ferrostatin-sensitive loss of viability.
Method Article
A Ferric Ammonium Citrate-Based Model of Iron Overload With Ferroptosis-Associated Readouts In C2C12 Myoblasts
In This Article
Summary
Abstract
Ferroptosis is an iron-dependent form of regulated cell death implicated in aging and degenerative disease. We previously found that aged muscle stem cells accumulate intracellular iron and undergo ferroptotic death upon activation. Here, we describe a simple in vitro model that uses ferric ammonium citrate to generate iron overload in murine C2C12 myoblasts. Ferric ammonium citrate treatment increased intracellular iron burden, as shown by elevated ferritin heavy- and light-chain transcripts, increased ferritin protein, and enhanced signal from a live-cell labile iron dye. Ferric ammonium citrate (FAC) exposure also produced molecular changes associated with ferroptosis, including increased Slc40a1 and Hmox1 expression and reduced glutathione peroxidase 4 protein. The FAC-associated decrease in glutathione peroxidase 4 was partially reversed by deferoxamine. At 12 hours, cytotoxic ferric ammonium citrate reduced cell viability, and this effect was rescued by ferrostatin-1, consistent with a ferroptosis-sensitive component of cell death. At later time points, increased variability and reduced assay dynamic range limit the interpretability of viability measurements. Thus, this protocol provides a rapid and scalable model of ferric ammonium citrate-mediated iron loading that can be used to study ferroptosis-associated responses and test iron- or ferroptosis-modifying interventions in muscle cells.
Introduction
Ferroptosis is a form of regulated cell death (RCD), molecularly distinct from other RCD. It was first discovered using erastin, a lethal small molecule selective for RAS (rat sarcoma), which was found to cause non-apoptotic cell death1. In their seminal work, Dixon et al. first described its mechanism as iron-dependent, and thus coined the term ferroptosis, meaning “fall (death) by iron1.” Molecularly, ferroptosis presents as excessive iron accumulation, increased lipid peroxidation, and a buildup of reactive oxygen species, leading to cell death2. It is uniquely distinguishable from oxidative stress and other forms of RCD by its independence from caspase activation, a hallmark of apoptosis, and lack of phosphorylated receptor-interacting protein kinase 3 (RIPK3) and mixed lineage kinase domain-like pseudo kinase (MLKL), which are only seen in necroptosis3. Furthermore, ferroptosis can also be alleviated with the lipid antioxidants ferrostatin-1 and liproxstatin-1, and the iron chelator deferoxamine4. Though ferroptosis is similar to other types of RCD in that all eventually result in the death of cells, its presentation makes it mechanistically distinct from other forms of RCD.
The study of ferroptosis has gained traction over the past decade, mainly due to continuous efforts in the field to identify new hallmarks and develop new tools to study its underlying mechanisms and contribution to human disease5. A recent body of evidence suggests that iron overload and ferroptosis are understudied contributors to age-related frailty and sarcopenia6,7,8. We recently showed that aged muscle stem cells (MuSCs) are uniquely susceptible to ferroptotic death resulting from chronic inflammation suppressing an anti-oxidative genetic program through epigenetic silencing9. We found that aged MuSCs accumulate an aberrant level of intracellular elemental iron, roughly 30x higher than their adult counterpart. Although ferroptosis has been linked to disease across multiple organs and tissues—predominantly those related to aging—its physiological role remains unclear and warrants further investigation.
While our previous study showed that aged MuSCs are sensitized to ferroptotic death upon activation, the specific contribution of iron loading to that phenotype remains to be clarified. Here, we establish a simple iron overload model in C2C12 myoblasts treated with ferric ammonium citrate (FAC) and ask whether excess iron is sufficient to generate ferroptosis-associated molecular changes and ferrostatin-sensitive loss of viability. C2C12 cells provide a low-maintenance, scalable, and readily available murine muscle progenitor system10. We anticipate that this approach will offer a practical platform for studying iron-driven stress responses in muscle cells and for testing interventions that modify ferroptosis-associated phenotypes.
Protocol
1. Preparing C2C12 cells
- Thawing cells
NOTE: All cell culture steps should be performed in a sterile biosafety cabinet.- Prepare a conical tube containing 9 mL of warm complete media (Dulbecco’s modified Eagle medium with high glucose and pyruvate + 10% fetal bovine serum + 1% pen/strep).
- Thaw one vial of frozen C2C12 cells (~1 million) by adding 800 µL of prewarmed complete media to the vial from the main media stock. Pipet up and down slowly.
- Once the media added to the thawing vial becomes cold, remove it and add it to the conical tube. Replace with the same volume of warm media from the tube. Continue pipetting up and down and swapping the media until the frozen cells are resuspended.
- Pipet the contents of the vial into the conical tube of media. Invert to mix, then add the contents to a 10 cm cell culture-treated dish. Incubate at 37 °C for 4 h.
- Check the cells under a microscope to ensure they have attached. Attached cells will appear elongated, while floating cells are circular and move when the plate moves.
NOTE: Assuming the plated cells are healthy, most of them should be attached. - Aspirate off the media to remove any dead cells and debris. Replace with 10 mL of warm complete media and return to the incubator. Let it incubate overnight, or until the plate reaches 80% confluency.
- Seeding C2C12 cells for iron treatment
- Once the desired confluency is reached, aspirate off the cell media. Add 2 mL of PBS dropwise to the plate, ensuring that the entire surface is covered; aspirate.
- Add 2 mL of 0.25% trypsin to the cells. Incubate at 37 °C for 5–10 min, or until cells detach. Once detached, the cells will appear circular under a microscope, and the trypsin and cell suspension will be cloudy and thickened.
- Neutralize the trypsin by adding 8 mL of warm complete DMEM. Use a serological pipet to thoroughly mix the solution and wash the plate. Transfer the cell suspension to a conical tube.
- Gently invert the tube 3–5x. Remove the appropriate volume and count the cells using the preferred method (cell counter, hemocytometer, etc.).
- Make a suspension of cells sufficient to seed the desired number of wells/plates for n = 3 for each condition: 10 cm plate (for western blot): 100,000 cells/plate, 6-well plate (for qPCR): 50,000 cells/well, 96-well plate (for labile iron and luminescence staining): 1,000 cells/well. Let the cells incubate at 37 °C overnight.
- Applying iron treatment to seeded cells
- On the day of treatment, add ferric ammonium citrate (FAC; formula = C₆H₁₁FeNO₇⁺3; MW = 265 g/mol) to complete DMEM at the following concentrations under sterile conditions: Severe: 180 µM (0.0477 mg/mL), Cytotoxic: 1,800 µM (0.477 mg/mL).
NOTE: Consider adding controls as well, including, but not limited to vehicle, severe + 150 µM deferoxamine (an iron chelator), vehicle + 150 µM deferoxamine, and/or vehicle + RSL3 (a ferroptosis inducer; positive control. Additionally, it is worth noting that DMEM may contain a small amount of iron (III) nitrate nonahydrate, a source of ferric iron, at baseline. The reader is to interpret the above recommended FAC concentrations as being in addition to any existing ferric iron already present in the vehicle culture medium. - Invert to mix until FAC dissolves in complete media.
NOTE: Since FAC is water-soluble, no DMSO or additional solvent is needed. Addition of FAC may alter the pH of the solution, so if a drastic media color change is observed, measuring pH is recommended to ensure viability of cells when treated media is added to culture. - Aspirate media off the cells. Add the same volume of iron-supplemented complete media to the treatment conditions, and untreated complete media to the vehicle wells/plates. Incubate at 37 °C for the desired treatment duration before proceeding to the assay of choice: Labile iron assay: 2 h FAC treatment, qPCR and western blot: 12–24 h FAC treatment, Luminescence assay: 12 h FAC treatment.
- On the day of treatment, add ferric ammonium citrate (FAC; formula = C₆H₁₁FeNO₇⁺3; MW = 265 g/mol) to complete DMEM at the following concentrations under sterile conditions: Severe: 180 µM (0.0477 mg/mL), Cytotoxic: 1,800 µM (0.477 mg/mL).
2. qPCR
- Isolating mRNA for qPCR
CAUTION: The RNA extraction reagent and chloroform pose respiratory hazards. Only handle in a fume hood wearing proper PPE (lab coat, chemical-resistant disposable gloves, and eye protection).- At the bench, aspirate media from the cells. Wash cells 2x with sterile PBS and thoroughly aspirate off any remaining liquid.
- In a fume hood, add the RNA extraction reagent to the cells in the following volumes: 6-well plate: 250 µL/well, 10 cm dish: 1 mL/dish.
- Working on ice in the fume hood, use a cell scraper to gently scrape off lysed cells. Take care to thoroughly scrape all parts of the plate to maximize the RNA yield.
- Pipet the lysate into sterile, prechilled, RNAse-free microfuge tubes. Let them sit at room temperature for 5 min.
- For each mL of the extraction reagent, add 200 µL of chloroform INSIDE A FUME HOOD. Shake samples vigorously for at least 30 s to combine the extraction reagent and chloroform. Let them sit at room temperature for 5 min.
NOTE: After the time has elapsed, phase separation will occur, with the clear aqueous phase (which contains the RNA) on top. - Centrifuge samples for 15 min at 12,000 × g at 4 °C. Meanwhile, label new autoclaved tubes, and add 500 µL (per mL of extraction reagent) of isopropanol to tubes on ice.
- Transfer only the aqueous phase into each corresponding tube. Mix gently by inversion, then let sit at room temperature for 10 min. If a low yield is expected, add 2 µL of GlycoBlue to visualize the pellet.
- Centrifuge for 15 min at 12,000 × g at 4 °C.
NOTE: Precipitated RNA may be visible at the bottom of the tube. - Carefully pour excess isopropanol off into a designated waste beaker. Add 1 mL of molecular-grade, 100% ethanol dropwise to the tube, being careful not to dislodge the pellet. Centrifuge for 5 min at 7,500 × g at 4 °C.
- Pour off ethanol. Invert tubes and leave the cap open over a paper towel. Allow the pellet to dry until droplet-free (~15–30 min).
NOTE: The pellet may become translucent if GlycoBlue was not added. - Resuspend the pellet in 25 µL of sterile, RNAse-free water. Quantify RNA concentration by UV-visible spectrophotometry. Normalize to a uniform concentration across samples that will allow a maximum of 1 µg of RNA in 16 µL per sample.
- Synthesizing cDNA for qPCR
NOTE: Complete all steps on ice to maximize RNA/cDNA yield.- Thaw samples. Wash the work area with an RNAse cleaner.
- Add 1 µg of RNA from each sample to a corresponding PCR strip tube.
- Add 4 µL of the cDNA mixture to each tube. If needed, add sterile water to reach a total volume of 20 µL. Run the mixes under the following thermocycler parameters: 25 °C for 5 min, 42 °C for 30 min, 85 °C for 5 min, 4 °C infinitely.
- Running qPCR
- Dilute cDNA 1:10 in sterile water before carrying out further reactions.
NOTE: cDNA can be frozen at -20 °C for 1 month or -80 °C for 6 months. - Dilute primers to a concentration of 10 µM with sterile water. Include the proper controls and/or housekeeping genes (e.g., B2M, TBP1).
- Make master mixes for each housekeeping gene and gene of interest such that there is enough reaction mix to run each DNA condition in triplicate. The master mix recipe (per reaction) is as follows: 2x PCR mix: 10 µL, Forward primer (10 µM): 1 µL, Reverse primer (10 µM): 1 µL, Sterile water: 8 µL.
- Place a qPCR reaction plate in a 96-well chilled metal block. Add 5 µL of diluted cDNA to each sample well and 20 µL of the reaction master mix to each well. Inspect each well to make sure all receive the same volume, cover the plate with a plate sealer, and use a flat-edge tool to smooth out bubbles.
- Centrifuge the plate at 1,000 × g and 4 °C for 1 min. Place the plate in a qPCR machine, ensuring it is loaded in the proper orientation.
- On the qPCR software, designate sample and gene-of-interest identities for each well. Consider making a template if planning to run multiple replicates with the same setup.
- Run the qPCR program (duration: ~1:36 h) shown in Table 1.
- Export the results as a .CSV or .XLSX file. If the qPCR machine used allows the user to choose which values to export, check that the CT values are included in the exported file.
- Use the average CT values for each condition and gene of interest—as compared to the CT values of the housekeeping genes in the corresponding condition—to calculate the fold change of each gene. Normalize the fold change of the vehicle condition to 1.0.
- Dilute cDNA 1:10 in sterile water before carrying out further reactions.
3. Western blot
- Isolating protein for western blot
NOTE: Perform all steps on ice to maximize protein yield.- In a biosafety cabinet, aspirate off culture media. Rinse cells with enough cold PBS to cover the bottom of the culture plate. Aspirate, then repeat.
- Add RIPA buffer supplemented with protease inhibitor and phosphatase inhibitor cocktails to prevent degradation of protein. Use 75 µL of RIPA solution for culturing in a 6-well plate, or 200 µL of RIPA solution in a 10 cm plate.
- Working on ice, use a cell scraper to gently loosen the lysed cells from the plate. Take special care to remove cells from all parts of the plate, including the edges. The solution will appear clear and somewhat viscous.
- Pipet the RIPA-cell suspension into chilled microfuge tubes. Centrifuge samples for 10 min at maximum speed at 4 °C. Transfer the supernatant (the protein lysate) into a prechilled tube. Discard the pellet.
- Quantify protein concentration by running a Bradford or BCA assay. Normalize samples to 1 µg/µL in protease- and phosphatase-inhibitor cocktail-enriched pure water on ice.
- Dilute lysates in Laemmli buffer, ensuring final protein concentrations are uniform across samples. Boil lysates at 95 °C for 10 min to denature the protein. For the best results, use for western blotting immediately after preparation. Otherwise, store proteins in Laemmli at -20 °C short-term (≤ 1 month) or -80 °C long-term.
- Preparing acrylamide gels for SDS-PAGE
CAUTION: Acrylamide is a neurotoxin and should only be handled while wearing appropriate PPE (lab coat, chemical-resistant gloves, and eye protection).- Determine the proteins of interest and the size of these proteins by consulting the company website of the antibody/ies to be used. Use the predicted size of the protein(s) of interest to decide what percentage of acrylamide the gel(s) should be.
NOTE: 10%-15% acrylamide works well for most molecular weights. - Assemble the gel casting stand and frame according to the manufacturer's directions.
- For the resolving gel, combine acrylamide, sterile water, 1.5 M Tris/HCl pH8.8 buffer, and 10% sodium dodecyl sulfate in a conical tube in the appropriate volumes for the number and percentage of acrylamide of the gels to be prepared, according to Table 2, which lists the components required for 2 gels. Mix by inversion.
- Add 10% ammonium persulfate solution and TEMED to the mixture. Invert to mix.
- Immediately add the solution to the gel casting frame, filling until the volume of the solution in the gel casting frame is just below the amount required to reach the bottom of the comb, if the comb were to be inserted.
- Immediately add 100–200 µL of pure ethanol dropwise on top of the hardening gel. If protein lysates need to be thawed and/or denatured, complete this during this incubation period. Thaw proteins on ice.
NOTE: This will disperse the solution so that the gel does not harden unevenly. - Once hardened, pour off the ethanol. For the stacking gel, combine acrylamide, sterile water, 0.5 M Tris/HCl pH6.8 buffer, and 10% sodium dodecyl sulfate in a conical tube in the appropriate volumes for the number and percentage of acrylamide of the gels to be prepared, according to Table 2, which lists the components required for two gels. Mix by inversion.
- Add the 10% ammonium persulfate solution and TEMED to the mixture. Mix by inversion.
- Immediately add the stacking solution to the gel casting frame until the volume reaches the top. Add the gel comb immediately after pouring the gel. Let rest for ~1 h or until the shape of the wells does not change when the gel casting stand is lightly rocked.
- Determine the proteins of interest and the size of these proteins by consulting the company website of the antibody/ies to be used. Use the predicted size of the protein(s) of interest to decide what percentage of acrylamide the gel(s) should be.
- Loading gels
- Fill the electrophoresis chamber(s) with run buffer to the appropriate fill line for the number of gels to be run.
- Transfer the gel frame with the combs still inside to the electrophoresis chamber. Add more run buffer to the space between the gels until that reservoir is full. Gently pull the combs out of the immersed gels.
- Pipet 5–10 µL of ladder into one well of each gel.
- Pipet 5–20 µL of extracted protein and Laemmli buffer samples into each well. Add 5–10 µL of 1x Laemmli buffer to any empty wells.
NOTE: The volume you add may require optimization based on the prevalence of the protein(s) of interest and/or efficacy of the antibody(ies).
- Running SDS-PAGE
- Connect the electrophoresis chamber to a power pack. Set to run at 150 V for 45 min.
NOTE: Depending on the setup, more time or a higher voltage may be required for complete migration to occur, so adjust as needed. - Once the protein has migrated to the end of the gel (where the gel caster and gel frame meet at the bottom of the apparatus), stop the run and turn off the power pack.
- Connect the electrophoresis chamber to a power pack. Set to run at 150 V for 45 min.
- Completing protein transfer
NOTE: This section was developed using a rapid protein transfer apparatus.- Pour transfer buffer into a gel tray. Add a transfer stack, followed by a nitrocellulose membrane and another transfer stack to the liquid to form a sandwich with the membrane in the middle. Ensure that the sandwich stack is completely immersed in the transfer buffer.
- Turn on the rapid protein transfer apparatus and select the proper protocol for the number of gels and size of the protein(s) of interest.
NOTE: 1.3 A and 25 V for 10 min has been found to work well, but optimization may be required. - Remove the top transfer stack with forceps and allow excess liquid to run into the gel tray. Move the stack to the protein transfer apparatus and lay it as flat and straight as possible; use a roller or conical tube to smooth out any wrinkles. Repeat with the membrane.
- Use a blunt-ended tool to gently separate the top and bottom halves of the casting frame. Transfer the gel to the membrane in the protein transfer apparatus.
- Use forceps to lift the remaining transfer stack from the gel tray. Drain off excess liquid, then place on top of the membrane and the other stack. Close the gel box and run the program.
- Blocking and staining with antibodies
- Open the gel box and use forceps to remove the top stack, then lift off the gel. Confirm that there are bands from the ladder on the membrane. Cut the membrane to only include the size range of interest.
- Transfer the membrane to a clean blot box. Add 5 mL of blocking buffer, or enough to cover the membrane. Block under room temperature agitation for 1 h.
- Meanwhile, prepare for antibody staining by adding the recommended concentration of primary antibody(ies) to 5 mL of 2% bovine serum albumin in wash buffer per membrane. Stain for housekeeping protein(s) as well (i.e., GAPDH, β-actin).
- Remove from agitation and pour off the blocking buffer. Add 5 mL of the primary antibody solution. Incubate in darkness under agitation at 4 °C overnight (~12–16 h).
NOTE: Moving forward, all steps should be completed in darkness. - Wash the membrane 3 x 5 min under room temperature agitation with wash buffer.
- Add the recommended concentration of secondary antibody to 5% BSA in wash buffer. Prepare 5 mL of solution for each membrane.
- Pour off excess wash buffer. Add 5 mL of secondary antibody solution to each blot. Incubate in darkness under room temperature agitation for 1 h.
- Wash the membrane 3 x 10 min under room temperature agitation with wash buffer. Image immediately.
- Detecting and analyzing proteins of interest
- Image proteins using the platform of choice.
- Use ImageJ or another platform to quantify the intensity of each band of interest.
4. Labile iron dye assay
- Labile iron dye staining
- Complete all of section 1, seeding cells in a 96-well plate under iron treatment for 2 h. Ensure there are at least three wells for each iron treatment condition, as well as negative (vehicle; culture media + 150 µM of the iron chelator deferoxamine) and positive (culture media + 180 µM FAC + labile iron dye co-treatment) controls.
- Prepare a sufficient 1:200 dilution of the 1 mM stock solution of labile iron dye in serum-free media to have 200 µL for each sample well.
- Aspirate off the culture medium. Wash 2x with PBS.
- Add the staining solution to each well and incubate for 1 h at 37 °C.
- Wash once with PBS. Replace with PBS.
- Image the cells using the far-red channel of a fluorescence microscope (646/662 nm). Save and export the images as .TIF files.
- Staining analysis
- Open the images in ImageJ.
- Open the measurement window by pressing m. Within the measurement window, under Results | Set Measurements, select Area, Integrated Density, and Mean Gray Value. Select OK.
- Use the Polygon Tool to draw around each cell in the image. Press m after each cell to add the measurements to the measurement window.
- Once all the cells in the image are quantified, copy and paste all the values into a spreadsheet. Use the circle tool to take at least three background measurements in areas unoccupied by cells.
- Use the following formula to calculate the corrected total cell fluorescence (CTCF) for each cell:
CTCF = integrated density – (area of selected cell x mean gray value of background readings) - Compare the CTCF values of the iron-treated cells to those of the vehicle cells. Increased CTCF indicates increased labile iron levels.
5. Cell luminescence assay
- Treating cells for luminescence assay
- Complete section 1, ensuring the number of wells corresponds to n = 3 for each condition you wish to include. Add at least three cell-free (complete media only) control wells. 100 µL of cells and media total should be added to each well.
- After incubating untreated cells overnight, apply treatments and controls as desired. Be sure to include a vehicle (untreated) condition, conditions with FAC only, cytotoxic + 10 µM ferrostatin-1 (an anti-ferroptotic agent), vehicle + 1 µM RSL3, and/or vehicle + 10 µM ferrostatin-1 + 1 µM RSL3. Incubate for the desired duration (12–24 h for maximizing treatment effects while preventing excessive cell death).
- Completing the luminescence assay
- Upon treating the cells, thaw the luminescence buffer components to room temperature. Combine the required components and store in darkness until ready to use. See kit directions for temperature storage requirements.
- Once cells have completed treatment, follow the kit instructions for treating cells.
NOTE: This will likely include room-temperature equilibration, followed by the addition of the luminescence buffer and a final, short room-temperature incubation period. Once the luminescence buffer is added, all steps should be performed in darkness. - Complete and record the luminescence using a plate reader or similar instrument.
NOTE: For this protocol, an integration time of 0.3 s was used. - Normalize luminescence values of the experimental wells to the average luminescence of the cell-free control wells.
NOTE: Higher luminescence values indicate a higher number of living cells.
Results
Based on previous work by us and others, we hypothesized that increasing extracellular iron would generate intracellular iron overload in murine muscle cells and allow us to monitor downstream ferroptosis-associated responses. We therefore developed the C2C12 workflow outlined in Figure 1, in which cells were exposed to defined concentrations of ferric ammonium citrate for 2–24 h, depending on the downstream assay.
The first step to validating our model was to confirm that FAC could enter the cells. Using the validated primers described in Table 3, we conducted qPCR for both the heavy and light chains of ferritin and determined that increasing iron input correlated with elevated ferritin mRNA levels (Figure 2A,B). At the protein level, a similar increase in ferritin levels was visible with increasing FAC concentration, though this did not appear to be dose-dependent (Figure 2C). Similarly, staining live, FAC-treated C2C12 cells showed that those treated with a cytotoxic dose of iron—as well as cells treated with the severe dose and labile iron stain concurrently as a positive control—visually and quantitatively display increased iron storage compared to untreated cells and those exposed to the iron chelator deferoxamine alone (DFO; Figure 2D). Overall, these results suggest that the iron introduced via FAC into the cell media is, in fact, entering the cells.
Having established that FAC increased intracellular iron burden, we next sought to determine whether iron overloading was accompanied by molecular and functional changes associated with ferroptosis. FAC increased Slc40a1 (ferroportin) expression (Figure 3A) and elevated Hmox1 (Figure 3B). FAC also decreased GPX4 protein, and this reduction was partially reversed by deferoxamine (Figure 3C). Treatment with RSL3 produced a similar reduction in GPX4, placing the FAC response within a broader ferroptosis-associated molecular context. Functionally, a cytotoxic FAC dose reduced luminescence-based viability at 12 h, and this early loss of viability was rescued by ferrostatin-1 (Figure 3D). In contrast, at 24 h, the separation between conditions becomes less pronounced and more variable (Figure 3E). While ferrostatin-1-treated samples remain elevated relative to cytotoxic FAC alone, the overall assay dynamic range is reduced at this later point. Together, these data show that FAC treatment produces iron overload, ferroptosis-associated molecular changes, and a time-dependent ferrostatin-sensitive reduction in viability in C2C12 cells.
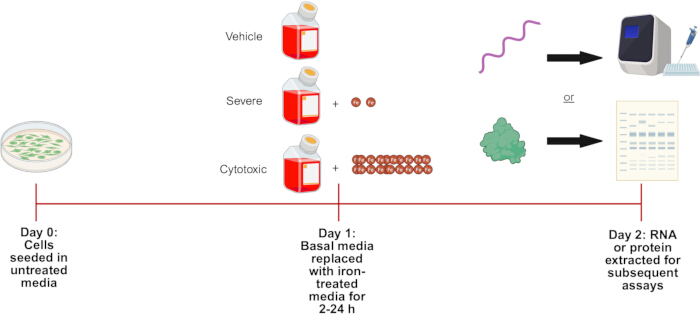
Figure 1: Graphical abstract of the iron overload model. In this model, C2C12 cells are seeded and allowed to incubate overnight before treatment with various physiologically significant doses of iron-infused culture medium and direct molecular analysis. Please click here to view a larger version of this figure.
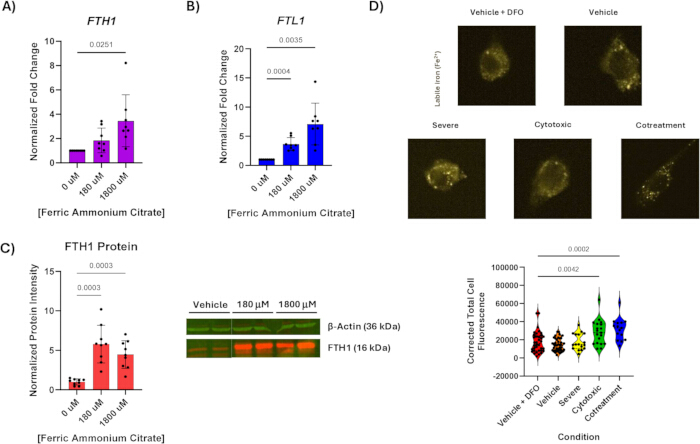
Figure 2: Increased labile iron storage and ferritin synthesis post ferric ammonium citrate addition. mRNA levels of (A) ferritin heavy chain and (B) ferritin light chain increase with the addition of ferric ammonium citrate into the system. (C) FTH1 protein levels increase with the addition of ferric iron to the system. (D) Labile iron levels increase in C2C12 cells treated with ferric iron before and concurrent with staining with a far-red labile iron dye, as compared to vehicle + deferoxamine control. The cotreatment condition indicates simultaneous treatment with culture media + 180 µM FAC + labile iron dye. Error bars are +/- SD. Abbreviations: FTH1 = ferritin heavy chain; FTL1 = ferritin light chain; DFO = deferoxamine. Please click here to view a larger version of this figure.
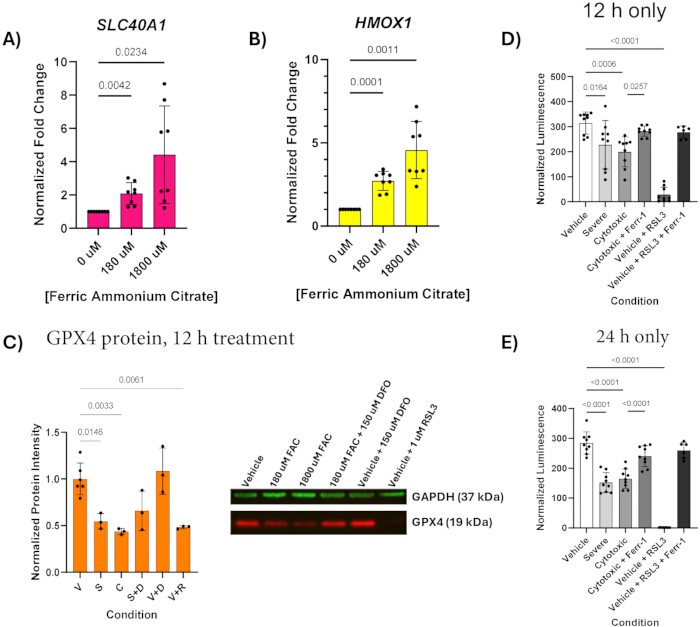
Figure 3: Ferroptosis-associated molecular changes and a time-dependent reduction in cell viability after FAC addition. mRNA levels of (A) ferroportin (Slc40a1) and (B) Hmox1 increase after FAC treatment. (C) GPX4 protein decreases after FAC treatment and in the presence of the positive control RSL3; deferoxamine partially reverses the FAC-associated decrease in GPX4. (D) Luminescence of C2C12 cells after 12 h treatment with FAC, RSL3, and/or ferrostatin-1, normalized to cell-free (media only) wells. (E) Normalized luminescence of treated C2C12 cells after 24 h treatment with FAC, RSL3, and/or ferrostatin-1. Error bars are +/- SD. Please click here to view a larger version of this figure.
| Hold stage | ||||
| 1 | Increase to 50 °C at 1.6 °C/s, hold for 2 min | |||
| 2 | Increase to 95 °C at 1.6 °C/s, hold for 10 min | |||
| PCR Stage (Run x 40) | ||||
| 1 | Hold at 95 °C for 15 s | |||
| 2 | Decrease to 60 °C at 1.6 °C/s, hold for 1 min | |||
| Melt Curve Stage | ||||
| 1 | Increase to 95 °C at 1.6 °C/s, hold for 15 s | |||
| 2 | Decrease to 60 °C at 1.6 °C/s, hold for 1 min | |||
| 3 | Increase to 95 °C at 0.15 °C/s, hold for 1 s | |||
Table 1: qPCR program (duration: ~1:36 h) in protocol section 2.
| Resolving gel | Stacking gel | |||
| Component | 10% | 12.50% | 15% | |
| Acrylamide (mL) | 5.6 | 6.9 | 8.3 | 0.65 |
| Sterile water (mL) | 6.9 | 5.3 | 3.9 | 3.05 |
| Tris/HCl, 1.5 M pH 8.8 (mL) | 4.2 | - | ||
| Tris/HCl, 0.5 M pH 6.8 (mL) | - | 1.25 | ||
| 10% Sodium dodecyl sulfate (µL) | 166 | 50 | ||
| 0.1 g/mL Ammonium persulfate (µL) | 80 | 25 | ||
| TEMED | 8.3 | 5 | ||
Table 2: Summary of components and volumes required for successful setup of resolving and stacking gels for western blot. Volumes provided are sufficient for two gels and can be scaled accordingly. Percentages indicate the amount of acrylamide in the mixture. NOTE: APS and TEMED should be added last and only when ready to cast as they will trigger the gel polymerization process.
| Gene Target | Gene Symbol | Function | Species | Forward Sequence | Reverse Sequence |
| Beta-2-microglobulin | B2m | Housekeeping gene | Mouse | TCACACTGAA TTCACCCCCA | TCACATGTCT CGATCCCAGT |
| TATA box-binding protein | Tbp | Housekeeping gene | Mouse | CAGATGTGC GTCAGGCGTT | CCATGAAATAGT GATGCTGGGCAC |
| Ferritin heavy chain | Fth1 | Subunit of the iron storage protein ferritin | Mouse | TGGCTCTGAA GAACTTTGCCA | TCATCACGGTC TGGTTTCTTTA |
| Ferritin light chain | Ftl1 | Subunit of the iron storage protein ferritin | Mouse | AATGGGGTAAA ACCCAGGAGG | AGGAAGTCACA GAGATGAGGGT |
| Heme oxygenase 1 | Hmox1 | Converts biliverdin to bilirubin in the presence of heme, CO2, and iron; high levels are present in ferroptosis | Mouse | CTAGCCTGGT GCAAGATACTG | TGTCTGGGAT GAGCTAGTGC |
| Ferroportin 1 | Slc40a1 | Transports excessive iron out of cells | Mouse | GCTGCTAGAA TCGGTCTTTGG | TGGAGTTCTG CACACCATTGA |
Table 3: List of validated qPCR primers for iron transport and ferroptosis genes of interest. Primers are mouse-specific due to their use in mRNA originating from C2C12 cells.
Discussion
The goal of this study was to establish a practical in vitro model of iron overload in murine muscle progenitors and define conditions under which ferroptosis-associated responses can be reliably detected. Using this workflow, we show that ferric ammonium citrate treatment leads to robust intracellular iron accumulation, accompanied by increased ferritin expression and elevated labile iron signal. Iron loading is further associated with molecular changes consistent with ferroptosis-related stress, including increased Slc40a1 and Hmox1 expression and decreased GPX4 protein. Functionally, cytotoxic FAC exposure induces a reduction in cell viability that is rescued by ferrostatin-1 at early time points, supporting the presence of a ferroptosis-sensitive component contributing to the observed cell death.
Iron dose and treatment duration are critical parameters that directly influence the interpretability of this system. In our hands, early time points (approximately 12 h) provide the clearest separation between conditions, allowing ferrostatin-1 to rescue FAC-induced cytotoxicity in a reproducible manner. At later time points (e.g., 24 h), overall viability decreases and variability increases across conditions, reducing assay dynamic range. This is consistent with cumulative cell loss and adaptation of the surviving population, such as increased antioxidant capacity or altered iron handling.
The administration of ferric iron (Fe3+) rather than ferrous iron (Fe2+), as well as the concentration of administered iron and duration of treatment, are also critical aspects of the protocol. Using ferric iron is essential because ferric iron is readily taken up by transferrin, the main transporter responsible for ferric iron import11. Though ferrous iron can be taken up by other transporters (most notably the divalent metal transporter DMT1), in this context, ferric iron appeared to be incorporated more effectively than ferrous iron12. The concentrations of FAC chosen for this protocol were selected due to their physiological relevance and use in past similar models13,14. The duration of iron treatment, being 24 h, was also based on similar models by us and others. However, in some contexts (namely the labile iron staining and cell luminescence assays), 24 hours proved too long a treatment duration. In these cases, a 24 h treatment resulted in such significant cell death that no conclusions could be drawn due to the destruction of cellular material. For instance, RSL3 is such a potent lipid peroxidation agent that a treatment duration of 12 h was sufficient to induce lipid peroxidation while also ensuring the effects of iron overload were visible simultaneously (Figure 3C-E). Additionally, for the labile iron dye, cells were only treated with FAC for a duration of 2 h before staining (after attempting to stain following 2, 4, and 24 h iron treatments) to capture the initial response to iron overload before excessive cell destruction could occur (Figure 2D). Overall, it appears that gene- and protein-level changes were best measured after 12–24 h of iron treatment, likely because these changes take longer for the cells to enact, while staining was best undertaken after a shorter treatment duration.
Others have developed similar models. One group generated a ferric iron-treated C2C12 model to study the role of the p53-Slc7a11 axis in ferroptosis. They found that ferric iron treatment for 48 h increased lipid peroxidation and decreased Slc7a11 levels, indicating ferroptosis13. Another similar model—this time using ferrous sulfate-treated C2C12 cells to study the relationship between the Akt-FoxO3-E3 ubiquitin ligase pathway and ferroptosis—involved treatment with iron over 4 h14. A common thread between these is that they involve iron treatment of C2C12 cells that have been differentiated into myotubes, rather than remaining in their more stem cell-like myoblast state. This makes our system particularly relevant to the previously observed iron accumulation in MuSCs.
Despite being a straightforward way to study the effects of iron overload on muscle in vitro, the method has limitations in that it has only been used in the context of C2C12 cells. Past work has shown that muscle stem cells are susceptible to iron overload during aging, suggesting a similar method may be valid in that context9.
Taken together, this model demonstrates that iron overload is sufficient to induce a reproducible set of ferroptosis-associated molecular changes and a ferrostatin-sensitive reduction in viability in C2C12 cells. While additional orthogonal assays can further refine cell death classification in specific contexts, the combined molecular and pharmacologic responses observed here are consistent with ferroptosis-associated cell stress. We anticipate that this approach will facilitate mechanistic studies of iron dysregulation in muscle aging and disease.
Disclosures
The authors have no conflicts of interest to declare.
Acknowledgements
This work was funded by NIH R00AG071736-04, University of Wisconsin School of Medicine and Public Health, and the University of Wisconsin Carbone Cancer Center. The authors would like to extend their gratitude to these funding sources, without whom this project would not have been possible. We would also like to thank the F. Jeffrey Dilworth lab at the University of Wisconsin for their critical insights into C2C12 cell culture.
Materials
| Name | Company | Catalog Number | Comments |
|---|---|---|---|
| 1 kb Protein Ladder, 500 µL size | Bio-Rad | 1610374 | Store at -20 °C. Thaw on ice. |
| 15 mL Centrifuge Tubes CS500 | Avantor/VWR | 89039-664 | |
| 30% Acrylamide/Bisphosphate solution, 29:1, 500 mL size | Bio-Rad | 1610156 | Is a neurotoxin. Handle only when wearing appropriate PPE (lab coat, gloves, eye protection). |
| 5425 / 5425 R Microcentrifuge | Eppendorf | 05-414-052 | |
| 5910 Ri centrifuge | Eppendorf | 05-414-459PM2 | |
| 96 Well Black/Clear Bottom Plate, TC Surface | Thermo Fisher Scientific | 165305 | |
| Ammonium persulfate, 10 g | Bio-Rad | 1610700 | Polymerizing agent for acrylamide gel casting as a 10% weight/volume solution in sterile water. Powder is room temperature stable, but solution should be stored long-term at -20 °C and short-term at 4 °C. |
| Anti-GAPDH, mouse antibody, 100 µg size | Thermo Fisher Scientific | AM4300 | Use at a 1:2000 concentration in 2% BSA + wash buffer. Runs at 37 kDa. |
| BCA Protein Assay Kit with Dilution-Free BSA Protein Standards | Thermo Fisher Scientific | A55865 | Follow manufacturer's instructions for use. Be advised that standards must be kept at 4 °C after first use. |
| Beta Actin Loading Control Monoclonal Antibody (BA3R), DyLight 800 4X PEG | Thermo Fisher Scientific | MA515739D800 | Use at a 1:1000 concentration in 2% BSA + wash buffer. Runs at 42 kDa. |
| BioLite 6 Well Multidish Cell Culture-Treated Surface | Thermo Fisher Scientific | 130184 | |
| Blot Box, Black, 9x6.5 cm, 5/pk | Fisher Scientific | 501870983 | |
| Bromophenol blue | Sigma-Aldrich | B0126 | Use in preparation of Laemmli buffer. |
| BSA, solid, 100 g | Fisher Scientific | BP9703100 | Store at 4 °C. |
| C2C12 cells | ATCC | CRL-1772 | Store in the vapor phase of liquid nitrogen. |
| cDNA Supermix QScript 500 reactions | Avantor/VWR | 101414-108 | Store at -20 °C. Thaw on ice. |
| Cell lifter, 100pk | Fisher Scientific | 8100240 | Since larger, use for extraction of cells from 10 cm and larger dishes. |
| Cell scrapers, 10 inch handle, 100pk | Fisher Scientific | 08-100-241 | Since they have a small head, they are best suited for removing cells from multi-well plates. |
| CellTiter-Glo Luminescent Cell Viability Kit, 10 mL | Promega | G7570 | |
| Chloroform, 99.9% | Thermo Fisher Scientific | 610281000 | Use in a fume hood only, and dispose of waste in a separate container. |
| COMPLETE EDTA-free protease inhibitor tabs | Sigma-Aldrich | 4693132001 | Dissolve 1 tablet in 500 µL of sterile water to create a 100× solution. |
| CO2 100-120 V Incubator | Binder | 9640-0002 | Model version CBS 170-120 V. Use for cell culture. |
| Deferoxamine mesylate, 50 mg | Fisher Scientific | 5764/50 | DFO is an iron chelator, so adding it to cells decreases iron content. Dissolve in water for a stock concentration of 1 M. |
| Dimethyl sulfoxide, 100 mL | Fisher Scientific | D5879-100ML | Use in labile iron staining and reconstitution. |
| DMEM, high glucose, pyruvate, 500 mL | Thermo Fisher Scientific | 11995065 | |
| Dylight 680 conjugated Goat anti-Rabbit IgG (H&L) | Thermo Fisher Scientific | 35568 | Add to 5% BSA in wash buffer at a ratio of 1:5000. |
| DyLight 800 4× PEG conjugate Goat anti-Mouse IgG (H&L) Secondary Antibody | Thermo Fisher Scientific | SA535521 | Add to 5% BSA in wash buffer at a ratio of 1:5000. |
| Easypet 3 1-channel pipet aid | Eppendorf | 4430000018 | |
| Far-red Labile Fe2+ Dye | Sigma-Aldrich | SCT037 | Prepare stock solution by adding 50 µL DMSO to a room temperatureerature aliquot. Light sensitive. Stock concentration: 1 mM |
| Ferric Ammonium Citrate, 500 g | MP Biomedicals | 158040 | |
| Ferrostatin 10 mg | Fisher Scientific | 502259214 | Sequesters lipid peroxidation byproducts, inhibiting ferroptosis in vitro. Dissolve in DMSO for a stock concentration of 10 mM. |
| Fetal Bovine Serum, Premium Plus, bottle, 500 mL | Thermo Fisher Scientific | A5669701 | Use to supplement DMEM for C2C12 cell culture. Added at 10% by volume. |
| Flex-Tube 1.5 mL PCR clean, colorless, 500 pcs. | Eppendorf | 22364120 | |
| FTH1 (D1D4) Rabbit mAb 100 µL | Cell Signaling Technology | 4393 | Use at a 1:1000 concentration in 2% BSA + wash buffer. Runs at ~20 kDa. |
| Glycerol, ultrapure | Thermo Fisher Scientific | 15514011 | Use in 6x Laemmli buffer prep. |
| GlycoBlue Coprecipitant (15 mg/mL), 300 μL | Thermo Fisher Scientific | AM9515 | Use to visualize pellet during RNA purification. |
| Image-iT Lipid Peroxidation Kit | Thermo Fisher Scientific | C10445 | Ready to use. Light sensitive. Stock concentration: 10 mM |
| ImageJ software | National Institutes of Health | N/A | Use to quantify western blot band intensity and corrected total cell fluorescence from microscopy images. |
| Inverted Light Microscope | Zeiss | 415510-1100-000 | Use in cell culture applications. |
| Isopropanol, 99.5%, 1 L bottle | Thermo Fisher Scientific | 327270010 | |
| MicroAmp Optical 96-Well Reaction Plate, 10 /cs | Thermo Fisher Scientific | N8010560 | Use in qPCR. |
| MicroAmp Optical Adhesive Film | Applied Biosystems | 4311971 | |
| Mini-PROTEAN Tetra Vertical Electrophoresis Cell System | Bio-Rad | 1658007FC | Includes gel casting stand, gel casting frames, electrophoresis box, and electrodes. |
| Molecular grade ethanol 200 proof, 1 L size | Sigma-Aldrich | E7023-1L | Use for RNA purification, and leveling out the resolving gel during preparation for SDS-PAGE. |
| Nanodrop One Spectrophotometer | Fisher Scientific | 134005181P4 | |
| Pasteur Pipets 1000 count | Fisher Scientific | 22183632 | |
| PBS, pH 7.4, 500 mL bottle | Thermo Fisher Scientific | 10010023 | |
| PCR tubes and domed caps, strips of 8, 0.2 mL volume | Avantor/VWR | 53509-304 | |
| Penicillin-Streptomycin | Thermo Fisher Scientific | 15140122 | Used to supplement DMEM for C2C12 cell culture. Added at 1% by volume. |
| PHOSSTOP phosphatase inhibitor 20 tablets | Sigma-Aldrich | 4906837001 | Dissolve 1 tablet in 1 mL of sterile water to create a 10× solution. |
| Pipet Sterilizing Can | Fisher Scientific | 50-212-141 | Used to autoclave Pasteur pipets for sterile applications. |
| PIPET TIP FLTR ST 1000µL PACK960 | Avantor/VWR | 76322-154 | |
| PIPET TIP UNIV FLTR ST 200µL PACK960 | Avantor/VWR | 76322-150 | |
| PIPET TIP UNIV FLTR ST 20µL PACK960 | Avantor/VWR | 76322-134 | |
| PIPET TIP XL FLR PS 0.5-10µL PK 960 | Avantor/VWR | 76322-132 | |
| Plate reader or luminometer | N/A | N/A | Use to record luminescence for the cell viability assay; an integration time of 0.3 s was used in this protocol. |
| Ponceau Staining Solution | Sigma-Aldrich | P7170-1L | Ready to use. Use to visualize protein content. Recommended to use on a tester blot, since it can interfere with downstream blocking and antibody staining. |
| Power SYBR Green Master Mix, 5 mL | Thermo Fisher Scientific | 4367659 | Stock is at 2x concentration. Use for qPCR. |
| PowerPac HC Power Supply | Bio-Rad | 1645052 | |
| QuantStudio 3 Real-Time PCR Instrument (96-Well 0.2 mL block) | Applied Biosystems | A28132 | Use for qPCR. |
| Quick Start Bradford Protein Assay Kit | Bio-Rad | 5000202 | Follow manufacturer instructions for use. |
| Rabbit mAb to glutathione peroxidase 4 (GPX4), 100 µL | Abcam | AB125066 | Use at a 1:1000 concentration in 2% BSA + wash buffer. Runs at ~19 kDa. |
| Research Plus 4-pack Option 2 pipets | Eppendorf | 2231001168 | |
| Resolving Gel Buffer for PAGE - 1 L 1-5 M Tris-HCl pH 8.8 | Bio-Rad | 1610798 | Use for resolving gel setup. |
| Revolve R4 Fluorescent Microscope | Echo | 8816455212 | Use for lipid peroxidation and labile iron dye imaging. |
| RIPA Cell Lysis Buffer | Fisher Scientific | 895347 | |
| RNAse Zap cleaning spray 250 mL | Fisher Scientific | SIGMA R2020250ML | |
| RSL3, 25 mg | Fisher Scientific | 502259412 | Is an inhibitor of GPX4. Since GPX4 protects against the excessive lipid peroxidation associated with ferroptosis, adding RSL3 to cells induces ferroptosis. Prepare stock solution in DMSO, and freeze at -80 °C for up to 1 year. Initial stock concentration: 10 mM. |
| Serological Pipet 10 mL Paper/Plastic | Avantor/VWR | 75816-100 | |
| Serological Pipet 5 mL Paper/Plastic | Avantor/VWR | 76201-710 | |
| Sodium bisulfite, ultra pure, solid, 500 g | Sigma-Aldrich | 243973-500G | Use in western blot running buffer. |
| Sodium chloride | Sigma-Aldrich | S9888 | Use in western blot wash buffer. |
| Sodium dodecyl sulfate (SDS), 500 g | Thermo Fisher Scientific | J18220-36 | Use in preparation of Laemmli buffer, Western blot running buffer, and for acrylamide gel assembly. For gel assembly, it is added as a 10% weight/volume solution in sterile water. |
| Stacking Gel Buffer for PAGE - 1 L 0-5 M Tris-HCl pH 6.8 | Bio-Rad | 1610799 | Use for stacking gel setup. |
| SuperBlock T20 TBS Blocking Buffer, 1 L | Thermo Fisher Scientific | 37536 | |
| T100 Thermal Cycler | Bio-Rad | 1861096 | |
| TEMED - 5 mL | Bio-Rad | 1610800 | Polymerizing agent for acrylamide gel casting. |
| Tissue Culture 100 mm dish CS300 | Avantor/VWR | 10062-880 | |
| Trans-Blot Turbo 5x Transfer Buffer, 1 L | Bio-Rad | 10026938 | Follow manufacturer's instructions to prepare 1× solution with ethanol and sterile water. Store both stock and 1× solution at 4 °C. |
| Trans-Blot Turbo RTA Midi 0.2 µm Nitrocellulose Transfer kit, 40 blots | Bio-Rad | 1704271 | Includes transfer stacks, nitrocellulose membranes, combs, gel trays, scrapers, and transfer apparatus. |
| Tricine, ultrapure, solid, 25 g | Sigma-Aldrich | T0377-25G | Use in western blot wash and running buffers. |
| Tris, ultrapure, solid, 1 kg | Fisher Scientific | BP152-1 | Use in western blot wash and running buffers. |
| TRIzol Reagent | Thermo Fisher Scientific | 15596026 | Use in a fume hood only, and dispose of waste in a separate container. |
| Trypsin-EDTA (0.25%), phenol red | Thermo Fisher Scientific | 25200056 | |
| Tween 20 | Sigma-Aldrich | P1379 | Use in western blot wash buffer. |
| Ultra-Pure DNase/RNase-Free Distilled Water, 500 mL | Thermo Fisher Scientific | 10977015 | |
| Western Blot Roller | Fisher Scientific | PI84747 |