B-Cell ELISpot is a validated method for quantifying the magnitude and durability of antigen-specific IgG, IgM, and IgA long-lived plasma cells, as well as total antibody-secreting cells (ASCs), in both blood (reflecting short-lived plasmablasts following immunization) and more durable bone marrow ASCs.
Method Article
ELISpot Assay for Quantifying Antigen-Specific and Total Antibody-Secreting Cells in Blood and Bone Marrow of Immunized Rhesus Macaques
In This Article
Summary
Abstract
Evaluation of novel vaccine antigens and adjuvants traditionally relies on measuring antibody titers, which require time to develop following immunization. Quantification of antibody-secreting cells (ASCs) after primary and booster immunizations provides an earlier, mechanistically informative measure of vaccine-induced humoral immunity and can facilitate the optimization of vaccine formulations and immunization strategies. Here, a protocol for enumerating ASCs from peripheral blood mononuclear cells (PBMCs) and bone marrow (BM) cells of rhesus macaques is described; rhesus macaques are an important preclinical model for HIV vaccine research. This enzyme-linked immunospot (ELISpot) assay enables the quantification of both antigen-specific and total IgG, IgM, and IgA ASCs by measuring their absolute and relative frequencies. In peripheral blood, the assay captures the peak plasmablast response following immunization, whereas in bone marrow it detects the accumulation of antigen-specific plasma cells of different isotypes, thereby assessing the durability of long-lived ASCs. This protocol offers a robust and reproducible approach for evaluating immunogen and adjuvant combinations in preclinical vaccine studies and provides valuable data to support the translation of promising vaccine candidates into clinical development.
Introduction
Antibody-secreting cells (ASCs) are key components of adaptive immunity and include both short-lived plasmablasts, which are generated rapidly following immunization, and long-lived plasma cells, which are responsible for sustained antibody production. Plasmablasts are transiently detectable in peripheral blood and secondary lymphoid organs, reaching peak frequencies at defined time points following immunization that vary according to the vaccine formulation and host species (typically days 4–5 in rhesus macaques and approximately day 7 in humans). In contrast, mature plasma cells are long-lived and primarily reside within secondary lymphoid tissues and the bone marrow (BM). An effective vaccine should elicit both robust humoral and cell-mediated immune responses. Measurement of recall responses, reflected by the rapid expansion of plasmablasts in peripheral blood mononuclear cells (PBMCs) following booster immunization, provides valuable insight into the magnitude of the vaccine-induced immune response. The overall goal of this protocol is to provide a robust method for quantifying early plasmablast and long-lived plasma cell responses following Env-specific immunization in rhesus macaques.
In an enzyme-linked immunospot (ELISpot) assay, ASCs are cultured in polyvinylidene fluoride (PVDF) or mixed cellulose ester (MCE) membrane-bottom 96-well plates coated with antigen (Ag), allowing viable cells to secrete proteins that are captured directly on the membrane surface. The captured proteins are subsequently detected using antibodies in a conventional sandwich immunoassay format. In chromogenic ELISpot assays, spots are generated through the conversion of the substrate 3-amino-9-ethylcarbazole (AEC) by horseradish peroxidase (HRP) into an insoluble colored precipitate, enabling visualization and enumeration of individual ASCs. ELISpot offers several important advantages, including the ability to detect antigen-specific responses ex vivo, highly sensitive functional assessment of individual immune cells, and quantitative monitoring of T- and B-cell immune responses in both preclinical and clinical studies1,2,3.
Here, a B-cell ELISpot protocol is described for quantifying total and antigen-specific IgG, IgM, and IgA ASCs in PBMCs and BM cells from rhesus macaques. The protocol details all critical steps, including plate coating, blocking, cell seeding, assay development, spot enumeration, and data analysis, to characterize the kinetics of total and Env-specific plasmablast and plasma cell responses. This method provides a reproducible approach for evaluating and comparing the immunogenicity of different antigen and adjuvant formulations in preclinical vaccine studies and supports the optimization of vaccine strategies for subsequent clinical translation.
Protocol
The rhesus macaques used in this protocol were sourced from the specific pathogen-free (SPF) colonies of the New Iberia Research Center and housed at the Michale E. Keeling Center for Comparative Medicine and Research, the University of Texas MD Anderson Cancer Center. Animal care and all experimental procedures complied with the Guide for the Care and Use of Laboratory Animals and were approved by the University of Texas MD Anderson Cancer Center Institutional Animal Care and Use Committee (Protocol #2616RN00).
This protocol represents an optimization of the technique described in previous immunization pre-clinical studies4,5,6,7, developed to detect ASC responses. The protocol below describes the ELISpot procedure using fresh PBMCs and BM cell preparations from rhesus macaques involved in an HIV experimental vaccine protocol.
NOTE: Perform all procedures from Sections 1–4 in a certified Class II biosafety cabinet using aseptic technique. Use multichannel pipettes whenever possible.
1. Preparation of ELISpot plates
- Coat the ELISpot plates
- Coat the total immunoglobulin (Ig) plates 1 and 3 with 100 µL/well of 5 µg/mL unconjugated goat anti-monkey IgG + IgM + IgA diluted in sterile DPBS. Incubate the plates at 4 °C for at least 8 h, preferably overnight (Figure 1A,C).
- Coat the antigen-specific plates 2 and 4 with 100 µL/well of 20 µg/mL Galanthus nivalis lectin (GNL) diluted in DPBS. Incubate the plates at 4 °C for at least 8 h, preferably overnight (Figure 1B,D).
- Store the coated plates at 4 °C until use.
- Wash and block the total immunoglobulin plates
- Remove the coating solution from plates 1 and 3 by rapidly inverting each plate over a waste container. Tap the inverted plate firmly on absorbent paper to remove residual liquid.
- Wash each plate twice with 200 µL/well PBS containing 0.05% Tween 20. Then wash the plates twice with 200 µL/well DPBS to remove residual detergent.
NOTE: Tween 20 is cytotoxic. Remove it completely before seeding cells. - Add 200 µL/well RPMI-10 to each well. Incubate the plates for 2 h at 37 °C in a humidified incubator.
- Wash and block the antigen-specific plates
- Remove the GNL coating solution from plates 2 and 4 by rapidly inverting each plate over a waste container. Tap the inverted plates firmly on absorbent paper to remove residual liquid.
- Wash each plate four times with 200 µL/well DPBS.
NOTE: Do not use PBS containing Tween 20 for GNL-coated plates. - Add 200 µL/well RPMI-10 to each well. Incubate the plates for 2 h at 37 °C in a humidified incubator.
- Discard the blocking solution. Wash each plate four times with 200 µL/well DPBS.
- Add 100 µL/well CH505 SOSIP antigen at a final concentration of 5 µg/mL. Incubate the plates for 2 h at 37 °C.
- Discard the antigen solution and wash each plate four times with sterile DPBS.
NOTE: Leave DPBS in the wells after the final wash to prevent the MCE membrane from drying before cell seeding.
2. Preparation of samples: Isolation of PBMCs and bone marrow mononuclear cells
- Isolate PBMCs from whole blood
- Centrifuge 10 mL EDTA blood tubes at 450 x g for 20 min at room temperature without applying the brake.
- Remove the plasma and add 4 mL DPBS without Ca2+ and Mg2+. Mix gently using a 10 mL serological pipette.
- Carefully layer the diluted blood over 4 mL Ficoll in a 15 mL centrifuge tube. Centrifuge at 800 x g for 30 min at room temperature using slow acceleration and slow deceleration.
- Transfer the buffy coat containing peripheral blood mononuclear cells to a fresh 15 mL tube. Add 8–10 mL DPBS and centrifuge at 450 x g for 10 min at room temperature.
- Discard the supernatant and gently resuspend the cell pellet.
- Add 2 mL ammonium chloride potassium (ACK) lysis buffer to the cell suspension. Incubate for 5 min at room temperature.
CAUTION: Do not exceed the 5 min incubation period, as prolonged exposure to ACK lysis buffer reduces cell viability. - Stop erythrocyte lysis by adding 10 mL DPBS containing 2% fetal bovine serum (FBS). Centrifuge the cells at 300 x g for 10 min at room temperature.
- Discard the supernatant and resuspend the cells in RPMI-10.
- Count the PBMCs using an appropriate cell-counting method and ensure that the viability is >90%, e.g., via trypan blue staining.
- Adjust one aliquot to 5 × 10⁶ cells/mL for antigen-specific ELISpot assays. Adjust a second aliquot to 1 × 10⁶ cells/mL for total immunoglobulin ELISpot assays.
- Isolate bone marrow mononuclear cells
- Place a 70 µm cell strainer into a 50 mL centrifuge tube. Pre-wet the strainer with 1 mL DPBS.
- Add 4 mL DPBS to 1 mL bone marrow aspirate. Mix thoroughly using a serological pipette.
- Pass the bone marrow suspension through the 70 µm cell strainer. Rinse the strainer with 2 mL DPBS before discarding it.
- Layer the filtered suspension over 4 mL Ficoll in a 15 mL centrifuge tube. Centrifuge at 800 x g for 30 min at room temperature using slow acceleration and slow deceleration.
- Transfer the mononuclear cell layer to a fresh 15 mL tube. Add 8–10 mL DPBS and centrifuge at 450 x g for 10 min at room temperature.
- Discard the supernatant and gently resuspend the cell pellet.
- Add 2 mL ACK lysis buffer to the cell suspension. Incubate for 5 min at room temperature.
CAUTION: Do not exceed the recommended lysis time to preserve cell viability. - Stop erythrocyte lysis by adding 10 mL DPBS containing 2% FBS. Centrifuge the cells at 300 x g for 10 min at room temperature.
- Discard the supernatant and resuspend the cells in RPMI-10.
- Count the bone marrow mononuclear cells using an appropriate cell-counting method and ensure that the viability is >90%, e.g., via trypan blue staining.
- Adjust one aliquot to 5 × 10⁶ cells/mL for antigen-specific ELISpot assays. Adjust a second aliquot to 1 × 10⁶ cells/mL for total immunoglobulin ELISpot assays.
3. Seeding and incubation of cells
- Seed the total immunoglobulin plates
- Remove the blocking medium from plates 1 and 3 by rapidly inverting each plate over a waste container. Tap the inverted plates firmly on absorbent paper to remove residual medium.
- Add 100 µL RPMI-10 to each well in the first row and 133 µL RPMI-10 to each well in the second and third rows. These are done in technical duplicates.
- Add 100 µL PBMC suspension (1 × 10⁶ cells/mL) to the first well of each column in plate 1. Arrange the samples according to the plate layout [e.g., wells A1–A6 for rhesus macaque 1 (RM1) and A7–A12 for rhesus macaque 2 (RM2)].
- Add 100 µL bone marrow cell suspension (1 × 10⁶ cells/mL) to the first well of each column in plate 3. Arrange the samples according to the plate layout.
- Prepare three-fold serial dilutions by transferring 67 µL from one well to the next and mixing thoroughly after each transfer. Continue the serial dilution into the designated wells, then discard the final 67 µL to maintain a final volume of 133 µL per well.
- Incubate the plates overnight at 37 °C in a humidified incubator containing 5% CO2.
NOTE: Avoid moving or disturbing the plates during incubation to prevent double spots.
- Seed the antigen-specific plates
- Remove the DPBS from plates 2 and 4 by rapidly inverting each plate over a waste container. Tap the inverted plates firmly on absorbent paper to remove residual buffer.
- Add 100 µL RPMI-10 to each well in the first row and 133 µL RPMI-10 to each well in the second and third rows.
- Add 100 µL PBMC suspension (5 × 10⁶ cells/mL) to the first well of each column in plate 2. Add the samples according to the plate layout.
- Add 100 µL bone marrow cell suspension (5 × 10⁶ cells/mL) to the first well of each column in plate 4. Add the samples according to the plate layout.
- Prepare three-fold serial dilutions by transferring 67 µL from one well to the next and mixing thoroughly after each transfer. Continue the serial dilution into the designated wells, then discard the final 67 µL to maintain a final volume of 133 µL per well.
- Incubate the plates overnight at 37 °C in a humidified incubator containing 5% CO2.
NOTE: Avoid disturbing the incubator during incubation, as vibration can produce double spots or comet-tail artifacts.
4. Process the ELISpot plates
- Process the total immunoglobulin plates
- Remove the plates from the incubator after approximately 18 h of incubation.
- Discard the cells and culture medium by rapidly inverting each plate over a waste container containing 10% bleach. Tap the inverted plates firmly on absorbent paper to remove residual liquid.
NOTE: Perform the remaining processing steps under non-sterile conditions. - Wash each plate four times with 200 µL/well DPBS containing 0.05% Tween 20.
NOTE: Leave the final wash buffer in the wells to prevent the membranes from drying. - Alternatively, wash the plates using an automated microplate washer when processing large numbers of plates.
- Prepare the detection antibody solution by diluting biotinylated anti-monkey IgG and IgM antibodies 1:1,000 and biotinylated anti-monkey IgA antibody 1:500 in DPBS containing 0.05% Tween 20 and 1% FBS.
- Remove the final wash buffer by tapping the plates on absorbent paper. Add 100 µL/well of diluted anti-IgG antibody to columns 1 and 2, 7 and 8, anti-IgM antibody to columns 3 and 4, 9 and 10, and anti-IgA antibody to columns 5 and 6, 11 and 12.
NOTE: Process one plate at a time to prevent the membranes from drying. - Incubate the plates for 2 h at room temperature.
- Discard the detection antibody solution and wash the plates four times with DPBS containing 0.05% Tween 20.
- Prepare the enzyme conjugate by diluting HRP-avidin 1:1,000 in DPBS containing 0.05% Tween 20 and 1% FBS.
- Add 100 µL/well diluted HRP-avidin to each well. Incubate the plates for 2 h at room temperature, protected from light.
- Discard the HRP-avidin solution and wash the plates four times with DPBS containing 0.05% Tween-20.
NOTE: Leave the final wash buffer in the wells until substrate development is complete.
- Process the antigen-specific plates
NOTE: The procedure is similar to that used for the total immunoglobulin plates. However, perform all washing steps using DPBS without Tween 20 to preserve the GNL coating.- Remove the plates from the incubator after approximately 18 h of incubation.
- Discard the cells and culture medium by rapidly inverting each plate over a waste container containing 10% bleach. Tap the inverted plates firmly on absorbent paper to remove residual liquid.
NOTE: Perform the remaining processing steps under non-sterile conditions. - Wash each plate four times with 200 µL/well DPBS.
NOTE: Leave the final wash buffer in the wells to prevent the membranes from drying. - Prepare the detection antibody solution by diluting biotinylated anti-monkey IgG and IgM antibodies 1:1,000 and biotinylated anti-monkey IgA antibody 1:500 in DPBS containing 1% FBS.
- Remove the final wash buffer by tapping the plates on absorbent paper. Add 100 µL/well of diluted anti-IgG antibody to columns 1 and 2, 7 and 8, anti-IgM antibody to columns 3 and 4, 9 and 10, and anti-IgA antibody to columns 5 and 6, 11 and 12.
NOTE: Process one plate at a time to prevent the membranes from drying. - Incubate the plates for 2 h at room temperature.
- Discard the detection antibody solution and wash the plates four times with 200 µL/well DPBS.
- Prepare the enzyme conjugate by diluting HRP-avidin 1:1,000 in DPBS containing 1% FBS.
- Add 100 µL/well diluted HRP-avidin to each well. Incubate the plates for 2 h at room temperature, protected from light.
- Discard the HRP-avidin solution and wash the plates four times with 200 µL/well DPBS.
NOTE: Leave the final wash buffer in the wells until substrate development is complete.
- Perform automated washing (Optional)
- Prime the automated microplate washer with DPBS according to the manufacturer's instructions.
- Select the predefined ELISpot wash program and perform all washing steps using DPBS.
NOTE: Use DPBS for all automated washes to eliminate repeated priming of the instrument with different wash buffers. - Use the washer settings listed in Table 1 for the microplate washer.
5. Detection
- Prepare the substrate solution
- Prepare the AEC working substrate immediately before use by adding one drop of chromogen solution to every 1 mL of substrate solution. Mix thoroughly by vortexing.
NOTE: Prepare approximately 40 mL of working substrate for four 96-well plates.
- Prepare the AEC working substrate immediately before use by adding one drop of chromogen solution to every 1 mL of substrate solution. Mix thoroughly by vortexing.
- Develop the ELISpot plates at room temperature
- Process one plate at a time. Discard the final wash buffer and immediately add 100 µL/well AEC working substrate.
- Monitor spot development visually until distinct red spots become visible, typically within 2–4 min.
CAUTION: Do not overdevelop the plates, as excessive development increases background staining and compromises spot resolution. - Stop the enzymatic reaction by rinsing the plate thoroughly under running tap water.
- Wash the plate four to five times with tap water. Remove excess water using absorbent paper towels.
- Remove the underdrain of the plate and allow the plates to air-dry for approximately 24 h before counting the spots.
NOTE: Stop the reaction as soon as spots become visible in wells containing the highest cell concentrations to avoid overdevelopment. - Repeat Steps 5.2.1–5.2.5 for each remaining plate.
6. Quantification of spots
- Acquire ELISpot images
- Scan each plate using an ELISpot reader equipped with image acquisition software.
- Select the appropriate plate template, define the wells to be analyzed, and acquire images according to the software instructions.
- Save the raw data and export the plate images in TIFF format for archival purposes.
- Count antibody-secreting cells
- Review the automated spot counts for each well.
- Manually verify each well to identify incorrectly merged or split spots. Mark individual spots manually when necessary to obtain accurate counts.
NOTE: Manual verification is recommended because large spots may be counted multiple times by automated analysis software. - Record the spot counts together with the corresponding dilution factors in a spreadsheet as described in Table 2.
- Analyze duplicate wells separately for IgG, IgM, and IgA before calculating the average spot count for each dilution.
- Calculate antibody-secreting cells per million input cells by multiplying the average spot count by the corresponding dilution factor.
NOTE: Use dilution factors of 15×, 45×, and 135× for total immunoglobulin assays and 3×, 9×, and 27× for antigen-specific assays. - Perform all calculations in spreadsheet software and generate graphs using statistical graphing software.
Results
In this B-cell ELISpot assay, antibody-secreting cells (ASCs) were detected using CH505 SOSIP, a soluble HIV-1 envelope glycoprotein (Env) trimer, as the coating antigen in a vaccine study aimed at eliciting broadly neutralizing antibodies (bnAbs) against HIV-1. Figure 1 illustrates the ELISpot plate layout used to quantify total and antigen-specific ASCs on separate plates. The layout identifies individual animals and the well positions assigned for IgG, IgM, and IgA analyses. Plate labels also include the study number, sampling time point, and date. In addition, the layout specifies the coating concentrations, cell suspension volumes, and serial dilution scheme used for the assay.
Figure 2 presents representative antigen-specific ASC responses in bone marrow, showing spots of varying size and intensity corresponding to individual ASCs secreting different amounts of antibody. IgG-producing ASCs generated the greatest number of spots, followed by IgM, whereas IgA responses were comparatively low. Automated spot enumeration was based on a predefined spot diameter and tended to overestimate the number of spots when large spots were present. Consequently, manual spot counting was performed to accurately enumerate ASCs, as demonstrated in the magnified representative wells from a single animal.
Table 2 lists the dilution factors (15×, 45×, and 135× for total immunoglobulin assays; 3×, 9×, and 27× for antigen-specific assays) used for the calculation of the total immunoglobulin plate and antigen-specific plate. Table 3 summarizes the manually counted antigen-specific (CH505) ASC spots for IgG, IgM, and IgA obtained from individual wells for four rhesus macaques (RH1–RH4). Wells containing excessive spot numbers at the highest cell concentration were excluded from analysis when individual spots could not be reliably distinguished.
Table 4 presents the mean ASC counts calculated from duplicate wells shown in Table 3. When the highest cell concentration produced an uncountable number of spots, the average was calculated using the remaining countable dilutions. Table 5 shows the calculated ASC frequencies per million input cells. These values were obtained by multiplying the average spot counts by the appropriate dilution factors (15×, 45×, and 135× for total immunoglobulin assays; 3×, 9×, and 27× for antigen-specific assays). Table 6 summarizes the calculated ASC frequencies per million cells for each individual animal together with the mean responses for the immunized animal group.
Figure 3 compares baseline and post-booster (5 days after immunization) plasmablast responses in PBMCs. Total ASC responses (Figure 3A) and antigen-specific CH505 ASC responses (Figure 3B) increased markedly following booster immunization for IgG, IgM, and IgA compared with baseline. These findings are consistent with the transient expansion of circulating plasmablasts released from draining lymph nodes following booster immunization. Figure 3C shows the ratio of antigen-specific to total ASCs at baseline and after boosting. The increased ratio observed after booster immunization reflects an enhanced antigen-specific response and provides a useful measure for comparing the immunogenicity of different vaccine formulations and adjuvants. The total number of plasmablasts observed after booster immunizations is consistently higher than at baseline, likely reflecting adjuvant-mediated immune activation. This, combined with higher background antigen-specific plasmablast values, may result in inflated ratios for individual animals, though the mean ratios across the four animals clearly increased post-immunization.
Similarly, Figure 4 shows an increased frequency of antigen-specific (CH505) ASCs in bone marrow following booster immunization, consistent with the establishment of long-lived plasma cells (LLPCs). The ratio of antigen-specific to total bone marrow ASCs also increased after boosting compared with baseline (Figure 4C), indicating successful accumulation of antigen-specific plasma cells within the bone marrow compartment.
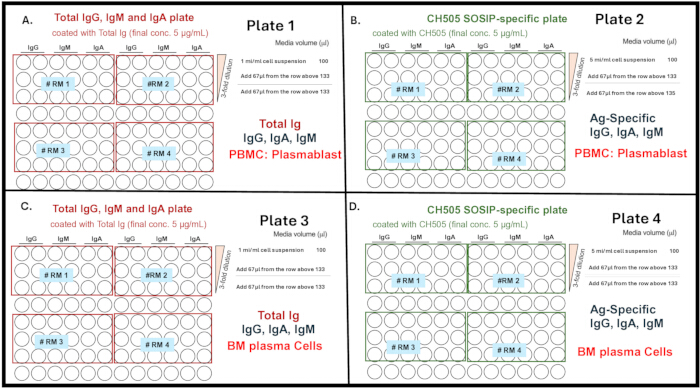
Figure 1: ELISpot plate layout for the quantification of total and antigen-specific antibody-secreting cells. Plate layouts showing the detection of (A) total immunoglobulin (Ig) plasmablasts, (B) antigen-specific plasmablasts, (C) total Ig plasma cells, and (D) antigen-specific plasma cells. Please click here to view a larger version of this figure.
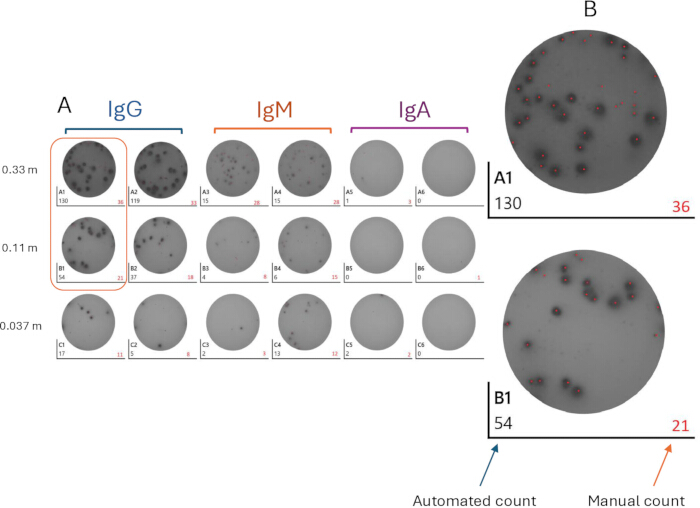
Figure 2: ELISpot detection of antigen-specific IgG, IgM, and IgA antibody-secreting cells in a bone marrow sample. (A) Representative IgG, IgM, and IgA ASC responses to CH505 antigen from a single rhesus macaque (RH1) bone marrow sample. Each dark spot represents an individual ASC secreting antigen-specific antibody. Three cell dilutions (0.33, 0.11, and 0.037 million cells per well) were analyzed in duplicate. (B) Magnified images compare automated spot counts (black) with manually corrected counts (red), illustrating the need for manual enumeration when spot size varies substantially. Please click here to view a larger version of this figure.
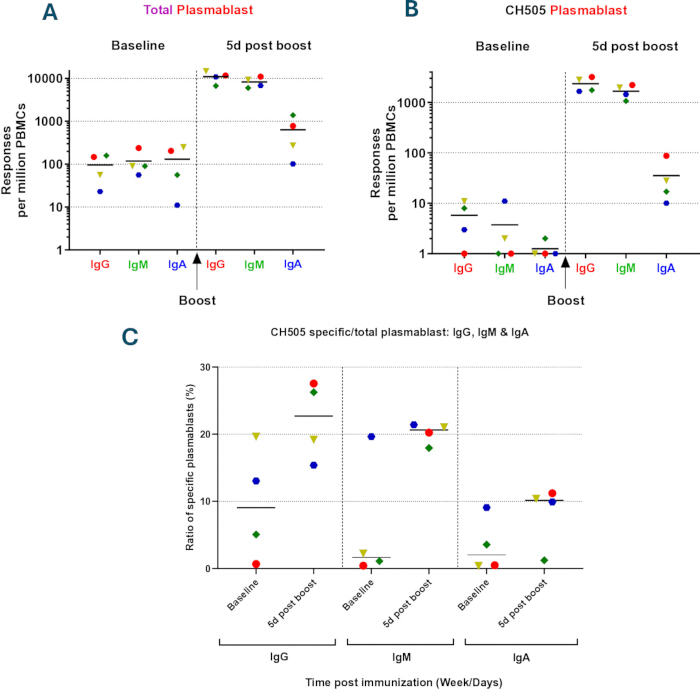
Figure 3: Total and antigen-specific IgG, IgM, and IgA antibody-secreting cells in peripheral blood mononuclear cells. (A) Total plasmablast responses and (B) CH505-specific plasmablast responses for IgG, IgM, and IgA were measured at baseline and 5 days after booster immunization. Values represent the mean spot counts from duplicate wells normalized using the appropriate serial dilution factors (15×, 45×, and 135× for total ASCs; 3×, 9×, and 27× for antigen-specific ASCs). (C) Ratio of antigen-specific to total ASC responses at baseline and after booster immunization. Please click here to view a larger version of this figure.
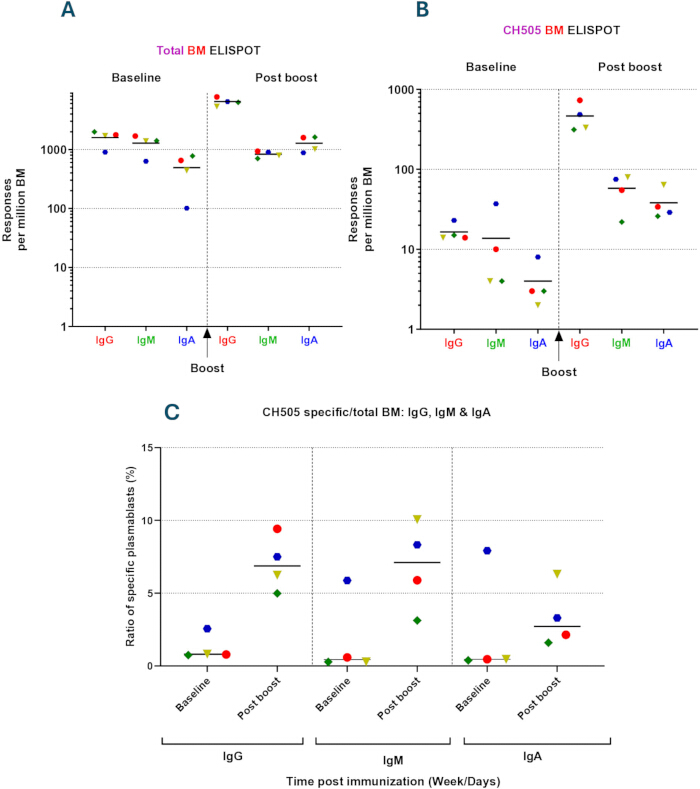
Figure 4: Total and antigen-specific IgG, IgM, and IgA antibody-secreting cell responses in bone marrow. (A) Total and (B) antigen-specific antibody-secreting cell (ASC) responses in bone marrow were measured at baseline and 1 month after booster immunization. Values represent the mean spot counts from duplicate wells normalized using the appropriate serial dilution factors (15×, 45×, and 135× for total ASCs; 3×, 9×, and 27× for antigen-specific ASCs). (C) Ratio of antigen-specific to total ASC responses for each immunoglobulin isotype at baseline and after booster immunization. Please click here to view a larger version of this figure.
| Method | Wash |
| Plate Type | 96-well |
| Number of Cycles | 4 |
| Predispense Before Washing | No |
| Bottom wash before First Cycle | No |
| Wash Format | Plate |
| Soak/Shake After Dispense | No |
| Predispense between the cycle | No |
| Shake before Soak | No |
| Prime | No (The washer was primed before use) |
| Dispense Parameter | |
| Volume | 200µl/well |
| Flow Rate | 3 |
| Advance Options | Z: Dispense height: 200(25.41mm above carrier |
| X: Offset: 0 (Center of the well) | |
| Y: Offset: 0 (Center of the well) | |
| Delay Start of Vacuum During Dispense | 0 µl/well |
| Aspiration Parameter | |
| Flow Rate | 2 |
| Delay | 0 msec |
| Advanced Options | Z: Aspiration height: 40(5.08 mm above carrier) |
| X: Offset: 0 (Center of the well) | |
| Y: Offset: 0 (Center of the well) | |
| Perform Secondary aspirate | NO |
| Final Aspiration | Yes |
Table 1: Automated ELISpot plate washer settings used for assay processing.
| For Total Immunoglobulin plates starting with 1 million cells/ml | |||
| 3- fold dilution | Cells/well | Volume | Factor/Million |
| A | 0.066 million | 133 µL | 15 X |
| B | 0.022 million | 133 µL | 45 X |
| C | 0.007 million | 133 µL | 135 X |
| For Antigen Specific plates starting with 5 million cells/ml | |||
| 3- fold dilution | Cells/well | Volume | Factor/Million |
| A | 0.33 million | 133 µL | 3 X |
| B | 0.11 million | 133 µL | 9 X |
| C | 0.037 million | 133 µL | 27 X |
Table 2: Calculation worksheet for determining antibody-secreting cells per million input cells from ELISpot spot counts.
| Plate-2: Gp1, CH505-specific IgG, IgM and IgA | ||||||||||||
| 1 | 2 | 3 | 4 | 5 | 6 | 7 | 8 | 9 | 10 | 11 | 12 | |
| Monkey# | #RH1 | #RH2 | ||||||||||
| Ab-isotype | IgG | IgG | IgM | IgM | IgA | IgA | IgG | IgG | IgM | IgM | IgA | IgA |
| A | 28 | 28 | 29 | 23 | 2 | 0 | 40 | 25 | 23 | 16 | 0 | 5 |
| B | 16 | 15 | 7 | 14 | 0 | 1 | 15 | 17 | 8 | 15 | 0 | 1 |
| C | 8 | 6 | 3 | 12 | 3 | 0 | 8 | 2 | 3 | 5 | 0 | 0 |
| Monkey# | #RH3 | #RH4 | ||||||||||
| Ab-isotype | IgG | IgG | IgM | IgM | IgA | IgA | IgG | IgG | IgM | IgM | IgA | IgA |
| E | 54 | 32 | 28 | 35 | 7 | 7 | NC | NC | 30 | 30 | 0 | 6 |
| F | 25 | 19 | 13 | 23 | 0 | 0 | 21 | 24 | 18 | 13 | 2 | 0 |
| G | 13 | 9 | 7 | 9 | 1 | 3 | 18 | 19 | 10 | 11 | 0 | 0 |
Table 3: Manual spot counts of CH505-specific IgG, IgM, and IgA antibody-secreting cells from individual ELISpot wells.
| CH505-specific (Average) | ||||||
| #RH1 | #RH2 | |||||
| IgG | IgM | IgA | IgG | IgM | IgA | |
| A | 28 | 26 | 1 | 33 | 20 | 3 |
| B | 16 | 11 | 1 | 16 | 12 | 1 |
| C | 7 | 8 | 2 | 5 | 4 | 0 |
| #RH3 | #RH4 | |||||
| IgG | IgM | IgA | IgG | IgM | IgA | |
| E | 43 | 32 | 7 | NC | 30 | 3 |
| F | 22 | 18 | 0 | 23 | 16 | 1 |
| G | 11 | 8 | 2 | 19 | 11 | 0 |
Table 4: Mean antibody-secreting cell counts calculated from duplicate ELISpot wells.
| CH505-specific responses per million BM | |||||||
| #RH1 | #RH2 | ||||||
| IgG | IgM | IgA | IgG | IgM | IgA | Dilution factor | |
| A | 84 | 78 | 3 | 98 | 59 | 8 | ×3 |
| B | 140 | 95 | 5 | 144 | 104 | 5 | ×9 |
| C | 189 | 203 | 41 | 135 | 108 | 0 | ×27 |
| Average | 138 | 125 | 16 | 126 | 90 | 4 | Responses |
| #RH3 | #RH4 | ||||||
| IgG | IgM | IgA | IgG | IgM | IgA | ||
| E | 129 | 95 | 21 | NC | 90 | 9 | ×3 |
| F | 198 | 162 | 0 | 203 | 140 | 9 | ×9 |
| G | 297 | 216 | 54 | 500 | 284 | 0 | ×27 |
| Average | 208 | 158 | 25 | 351 | 171 | 6 | Responses |
Table 5: Calculated frequencies of total and antigen-specific antibody-secreting cells per million input cells after application of dilution factors.
| BM ELISpot: CH505-specific responses | |||||
| CH505-spec IgG | CH505 IgM | CH505 IgA | |||
| #RH1 | 138 | #RH1 | 125 | #RH1 | 16 |
| #RH2 | 126 | #RH2 | 90 | #RH2 | 4 |
| #RH3 | 208 | #RH3 | 158 | #RH3 | 25 |
| #RH4 | 351 | #RH4 | 171 | #RH4 | 6 |
| Average | 206 | Average | 136 | Average | 13 |
| SEM | 46 | SEM | 16 | SEM | 4 |
| Let 0=1, in the graph with Log | |||||
Table 6: Summary of antibody-secreting cell frequencies per million cells for individual rhesus macaques and group mean responses.
Discussion
B-cell ELISpot is a sensitive method for detecting total immunoglobulin and antigen-specific antibody-secreting cell (ASC) responses in blood, plasma, and bone marrow cells8,9,10,11. Several steps are critical to ensuring the protocol's reproducibility. First, membranes should be precisely coated with the optimal concentration of the capture antibody. Membrane blocking is essential to prevent non-specific binding and is preferably performed overnight at 4 °C, as described in this protocol. Alternatively, when time is limited, blocking can be performed for at least 2 h at 37 °C.
Another critical factor is maintaining high cell viability by using freshly harvested cells. Unlike T cells, B-cell lineages, particularly plasmablasts and plasma cells, are highly susceptible to functional loss following cryopreservation (data not shown). Therefore, using freshly isolated cells with viability exceeding 90%, and ideally 95–99%, is recommended to ensure reliable results. In addition, peripheral blood mononuclear cells (PBMCs) and bone marrow (BM) cells should contain little to no red blood cell contamination. Precise control of incubation temperature and CO2 concentration is also essential for optimal cell stimulation. The incubation period should not exceed 18–20 h, and plates should be incubated in stable incubators with minimal vibration. Gentle opening and closing of incubator doors helps prevent cells from becoming dislodged from the membrane surface, which can generate artifactual spots.
Weak or diffuse spots may occur during the assay. These can often be improved by optimizing antigen density on the membrane and ensuring that ambient laboratory temperatures are sufficiently warm (>18 °C) to support efficient enzymatic color development. Extending the incubation period has not improved signal intensity in our experience, but can substantially increase background staining (data not shown). Conversely, excessive spot density can be addressed by analyzing wells plated at lower cell densities.
Thorough washing at multiple stages of the protocol is essential for removing cells and unbound reagents, regardless of whether manual or automated washing methods are used, and helps minimize background. Proper plate development is equally important. Development time should be adjusted based on laboratory temperature to achieve optimal spot visualization, particularly in wells with the highest cell concentrations. Plates should also be completely dry before quantification, as residual moisture can adversely affect spot counting.
Modest adjustments to the timing of certain protocol steps, made to accommodate personnel availability, do not substantially affect assay performance. For example, membrane blocking can be performed either for 2 h at 37 °C or overnight at 4 °C with comparable results. Similarly, incubation with biotin-conjugated anti-monkey IgG, IgM, and IgA antibodies can be extended overnight at 4 °C without compromising assay performance. When implementing these assays for the first time, it is essential to include appropriate controls, particularly negative control wells containing cells without antigen and antigen without cells. In our experience, these control wells are consistently devoid of spots.
The most common challenge encountered is obtaining cell counts below 5 × 10⁶ cells/mL, particularly when BM aspirates yield fewer cells than expected. In such cases, calculations should be adjusted according to the actual starting cell count. Although not ideal, when cell numbers are limiting, duplicate wells may be omitted for a particular time point or antibody isotype. As illustrated in Figure 2, automated spot counting should be interpreted cautiously in the context of ASC enumeration because spot sizes vary considerably. The automated counter appears to apply a fixed spot-size threshold, which can cause large spots to be counted multiple times, thereby overestimating ASC frequencies, particularly in wells with high spot densities. One strategy is to calculate spot-forming cells per million using only wells with sufficiently diluted cell concentrations that produce a manageable number of clearly distinguishable spots. However, provided individual spots remain visually distinct, averaging counts across multiple dilutions and wells yields a more accurate estimate of ASC frequency. Other ELISpot counting systems may provide more accurate automated quantification, although these were not evaluated here.
Multiple preclinical and clinical B-cell ELISpot protocols have been previously described that address various cell types, including small-animal models for preclinical studies, detection of RBD-specific antibodies in SARS-CoV-2 clinical studies, and detection of Hepatitis B surface antibodies in healthy and infected individuals in clinical settings12,13,14. The proposed protocol is specific to pre-clinical NHP studies. This protocol provides a valuable tool for measuring the effectiveness of immunogen and adjuvant combinations in preclinical vaccine studies, with potential downstream translation to clinical studies.
Disclosures
The authors have no financial interest to declare.
Acknowledgements
The authors would like to thank the animals and the research care staff at the Keeling Center for Comparative Medicine and Research for their care, and many former team members and collaborators for successive improvements to the procedure. Funding for this NHP HIV vaccine project was provided by NIH awards 5R01AI183472 to MBZ and R24OD010947 to FJV.
Materials
| Name | Company | Catalog Number | Comments |
|---|---|---|---|
| ACK Lysis | Quality Biological | 118-156-101 | 500 ml |
| 70µm strainer | Fisher | 22363548 | Sterile cell strainer, fit for 50 mL conical tubes |
| AEC working Substrate | BD Biosciences | 551951 | Reagents for 10 plate(s) |
| Analysis: Excel | Microsoft office | Version 2508 Build 16.0.19127.20678 | Microsoft Excel for Microsoft 365 |
| Analysis: GraphPad Prism | GraphPad Software, LLC | Version 10.6.1 (892) | GraphPad Prism 10 |
| Anti Rhesus IgA biotin | NHPRR | AB-3086851 | lyophilized |
| Anti-monkey IgG biotin | Rockland | P/N 617-106-012 | lyophilized |
| Anti-monkey IgM biotin | Rockland | P/N 617-106-007 | lyophilized |
| Blocking media | Lab prepared reagents | formulated in-house | RPMI-10 |
| Buffer for diluting the secondary antibody and HRP | Lab prepared reagents | formulated in-house | 1X DPBS with 1%FBS |
| Centrifuge | Thermo Scientific | 75004521 | Sorvall Legend XTR, Make: 2013, TX-750 rotor and 75003608 (Round bucket) |
| Coating buffer | Lab prepared reagents | formulated in-house | 1X DPBS |
| DPBS | Gibco | 14190-136 | 1X |
| ELISpot plates | Millipore Sigma | MSHAN4B50 | 50 plates pack |
| Fetal Bovine Serum (FBS) | Omega Scientific | FB-01 | 1X |
| Ficoll | STEMCELL Technologies | 18061 | 500 ml |
| GNL Unconjugated | Vector Laboratories | L-1240-5 | lyophilized |
| Horseradish Peroxidase (HRP) - Avidin | Vector Laboratories | A-2004 | 5mg/ml ready to use |
| Mabtech IRIS Fluorospot/ELISpot reader | Mabtech AB | P/N: 2000 | Automated imaging and analysis for ELISpot and Flurospot assay |
| Penicillin/Streptomycin | Gibco | 15140-122 | 100X |
| Plate washer | BioTek Instruments, Inc. | REF# 405TSRS | 405 TS Microplate washer |
| RPMI-10 | Lab prepared reagents | formulated in-house | RPMI-1640 + 10% Fetal Bovine Serum and 1% Penicillin/Streptomycin |
| RPMI-1640 | Gibco | 22400-071 | 1X |
| Tween20 | Sigma Life sciences | P7949 | 500ml |
| Unconjugated Polyclonal Goat anti monkey IgG+IgA+IgM Antibody IgG/IgM/IgA | LS-Bio | C347340 | lyophilized |
| Wash buffer (Antigen Specific Plates) | Lab prepared reagents | formulated in-house | (DPBS 1X only) |
| Wash buffer (Total Ig Plates) | Lab prepared reagents | formulated in-house | ( DPBS 1X + 0.05% Tween 20) |
References
- Hwai H, Chen YY, Tzeng SJ. B-Cell ELISpot Assay to Quantify Antigen-Specific Antibody-Secreting Cells in Human Peripheral Blood Mononuclear Cells. Methods Mol Biol. 2018;1808:133-141.
- Haralambieva IH, Ovsyannikova IG, Kennedy RB, Poland GA. Detection and Quantification of Influenza A/H1N1 Virus-Specific Memory B Cells in Human PBMCs Using ELISpot Assay. Methods Mol Biol. 2018;1808:221-236.
- Sahay B, Aranyos AM, McAvoy A, Yamamoto JK. Utilization of Feline ELISpot to Evaluate the Immunogenicity of a T Cell-Based FIV MAP Vaccine. Methods Mol Biol. 2018;1808:197-219.
- Silveira EL, et al. Vaccine-induced plasmablast responses in rhesus macaques: Phenotypic characterization and a source for generating antigen-specific monoclonal antibodies. J Immunol Methods. 2015;416:69-83.
- Arunachalam PS, et al. A comparative immunological assessment of multiple clinical-stage adjuvants for the R21 malaria vaccine in nonhuman primates. Sci Transl Med. 2024;16(758):eadn6605.
- Kasturi SP, et al. 3M-052, a synthetic TLR-7/8 agonist, induces durable HIV-1 envelope-specific plasma cells and humoral immunity in nonhuman primates. Sci Immunol. 2020;5(48):eabb1025.
- Kasturi SP, et al. Adjuvanting a Simian Immunodeficiency Virus Vaccine with Toll-Like Receptor Ligands Encapsulated in Nanoparticles Induces Persistent Antibody Responses and Enhanced Protection in TRIM5alpha Restrictive Macaques. J Virol. 2017;91(4):e01844-16.
- Shah HB, Koelsch KA. B-Cell ELISPOT: For the Identification of Antigen-Specific Antibody-Secreting Cells. Methods Mol Biol. 2015;1312:419-426.
- Czerkinsky CC, et al. A solid-phase enzyme-linked immunospot (ELISPOT) assay for enumeration of specific antibody-secreting cells. J Immunol Methods. 1983;65(1-2):109-121.
- Saletti G, et al. Enzyme-linked immunospot assays for direct ex vivo measurement of vaccine-induced human humoral immune responses in blood. Nat Protoc. 2013;8(6):1073-1087.
- Walsh PN, et al. Optimization and qualification of a memory B-cell ELISpot for the detection of vaccine-induced memory responses in HIV vaccine trials. J Immunol Methods. 2013;394(1-2):84-93.
- Brunner C, et al. Cell-based ELISpot protocol to detect and quantify antigen-specific antibody-secreting cells in murine whole-organ single-cell suspensions. STAR Protoc. 2025;6(3):103797.
- Rouers A, Tay MZ, Ng LFP, Renia L. B-cell ELISpot assay to analyze human memory B cell and plasmablast responses specific to SARS-CoV-2 receptor-binding domain. STAR Protoc. 2023;4(1):102130.
- Tian C, et al. Use of ELISpot assay to study HBs-specific B cell responses in vaccinated and HBV-infected humans. Emerg Microbes Infect. 2018;7(1):16.
Reprints and Permissions
This article has been published
Video Coming Soon