This study employed network pharmacology and molecular dynamics simulations to investigate the molecular mechanisms and pathways of plumbagin in the treatment of prostate cancer. The results demonstrate that plumbagin may stably bind to AKT1, ESR1, BCL2, EGFR, TNF, MAPK3, HSP90AA1, SRC, and PPARG.
Research Article
Computational Analysis of Plumbagin in Prostate Cancer Using Network Pharmacology and Molecular Dynamics Simulations
61 views
⸱
September 11th, 2026
* These authors contributed equally
In This Article
Summary
Abstract
Prostate cancer is a major contributor to cancer-related mortality among men. Because many patients are diagnosed only after the disease has progressed to a locally advanced or metastatic stage, curative treatment is often no longer possible. In the present study, we applied an integrated computational approach combining network pharmacology, molecular docking, and molecular dynamics simulations to explore the potential molecular mechanisms underlying the therapeutic effects of plumbagin in prostate cancer. Potential therapeutic targets were identified through integrated database analysis, followed by protein-protein interaction network construction, functional enrichment analysis, molecular docking, and molecular dynamics simulations to evaluate the stability of protein-ligand interactions. Our computational analyses identified that plumbagin may form stable interactions with multiple hub targets, including AKT serine/threonine kinase 1 (AKT1), estrogen receptor 1 (ESR1), BCL2 apoptosis regulator (BCL2), epidermal growth factor receptor (EGFR), tumor necrosis factor (TNF), mitogen-activated protein kinase 3 (MAPK3), heat shock protein 90 alpha family class A member 1 (HSP90AA1), SRC proto-oncogene, non-receptor tyrosine kinase (SRC), and peroxisome proliferator activated receptor gamma (PPARG), suggesting its potential to modulate key pathways involved in prostate cancer progression. These in silico findings provide new insights into the possible molecular mechanisms of plumbagin and offer a rationale for future experimental validation. However, further in vitro and in vivo studies are warranted to confirm its functional activity and therapeutic efficacy.
Introduction
Prostate cancer is heterogeneous, with clinical manifestations ranging from asymptomatic screen-detected lesions that may never progress to aggressive malignancies, and it is a leading cause of morbidity and mortality worldwide1,2. Globally, the number of new cases of prostate cancer is projected to double from 1.4 million in 2020 to 2.9 million in 2040, while the annual number of deaths is expected to increase from 375,000 in 2020 to approximately 700,000 in 20403. Initially diagnosed as an androgen-dependent malignancy, prostate cancer is treatable with androgen deprivation therapy. Nevertheless, despite an effective initial response, the disease inevitably progresses to an androgen-independent form. Patients with hormone-refractory prostate cancer are at a significantly increased risk of developing bone metastases, leading to clinically significant skeletal lesions4,5,6,7. Furthermore, while early-stage prostate cancer can be cured with surgery or radiotherapy, many patients already present with locally advanced or metastatic disease at the time of diagnosis, for which no curative treatment currently exists8,9. Therefore, there is an urgent need to develop effective and highly selective agents for the prevention and/or treatment of prostate cancer metastasis.
A variety of natural extracts, such as lycopene, soy products, green tea, pomegranate phenolics, apigenin, as well as vitamins D and E, have been shown to effectively prevent the development of prostate cancer10,11,12,13. Plumbagin (PLB), a naturally occurring naphthoquinone compound widely found in nature and a major component of Plumbago zeylanica, possesses anti-infective14, anti-inflammatory15, anti-atherosclerotic16, and anti-tumor17,18 properties. Studies have demonstrated that PLB exerts anti-tumor effects in various cancer cell types, including breast cancer, non-small cell lung cancer, liver cancer, pancreatic cancer, colorectal cancer, ovarian cancer, prostate cancer, glioma, and retinoblastoma19,20,21. In vitro experiments have shown that PLB inhibits the proliferation of prostate cancer cells22,23. PLB also regulates microprotein expression, which in turn affects multiple cellular behaviors in prostate cancer cells, including cell cycle control, apoptosis, autophagy, and epithelial-to-mesenchymal transition24,25. In addition, PLB delays the growth of androgen-independent cancer cells in subcutaneous xenograft mouse models22,26.
Although numerous studies have shown that PLB inhibits the proliferation and invasion of prostate cancer cells, there is currently no systematic investigation of the targets and pathways by which PLB acts on these cells. Using network pharmacology, molecular docking, and molecular dynamics simulations, this study sought to elucidate the potential targets and pathways underlying PLB's therapeutic effects in prostate cancer.
Protocol
Prediction and screening of potential targets of PLB
The chemical structure information of PLB was obtained from the PubChem database (https://pubchem.ncbi.nlm.nih.gov/). Molecular targets of PLB were predicted based on ligand-based two-dimensional and three-dimensional similarity using the SwissTarget (https://swisstargetprediction.ch/index.php), SEA (https://sea.bkslab.org/), TargetNet (http://targetnet.scbdd.com/calcnet/index/), PharmMapper (https://www.lilab-ecust.cn/pharmmapper/index.html), Comparative Toxicogenomics Database (CTD, https://ctdbase.org/), Traditional Chinese Medicine Systems Pharmacology Database and Analysis Platform (TCMSP, https://www.tcmsp-e.com/index.php), and HERB (http://herb.ac.cn/) databases. To ensure data reliability and reproducibility, database‑specific filtering thresholds were applied as follows: TCMSP retained targets with oral bioavailability (OB) ≥ 30% and drug‑likeness (DL) ≥ 0.18; SwissTargetPrediction kept entries with a prediction probability ≥ 0.5; PharmMapper selected targets with a normalized fit score ≥ 4.0; SEA included only targets with an E‑value < 0.001 as significantly enriched; TargetNet retained targets with a prediction probability > 0.5; CTD included only targets with curated evidence (inferred from chemical–gene interactions) and an interaction score > 0.3; and HERB retained targets with a literature‑supported score ≥ 0.4. All retrieved protein identifiers from the above databases were standardized to official human HGNC gene symbols using the UniProt database (https://www.uniprot.org/), with species restricted to Homo sapiens. After removing duplicate entries across all sources, a total of 500 unique PLB‑related targets were obtained for subsequent analysis.
Retrieval of prostate cancer-associated genes
Disease-related genes for prostate cancer were obtained from GeneCards (https://www.GeneCardss.org/), DrugBank (https://go.drugbank.com/), CTD, and HERB. Database-specific inclusion criteria were applied to ensure data reliability. GeneCardss retained genes with a relevance score ≥ 0.5, as this threshold captures genes with moderate-to-strong evidence linking them to the disease query. DrugBank included only entries with experimental evidence (e.g., FDA-approved or investigational drugs for prostate cancer) and excluded computationally predicted or theoretical interactions. CTD retained only records with evidence levels classified as "marker" or "mechanism" based on curated chemical-gene-disease interactions. HERB included targets with a literature-supported confidence score ≥ 0.4 to ensure sufficient experimental or text-mining evidence. All gene symbols were unified to the HGNC nomenclature via the UniProt database (https://www.uniprot.org/), with species restricted to Homo sapiens, and duplicates were removed, yielding 1,199 unique prostate cancer–related targets for subsequent analysis.
Overlapping target identification and conflict annotation correction
The 500 PLB targets and 1,199 prostate cancer targets were intersected using standardized HGNC symbols in Venny 2.1 (https://bioinfogp.cnb.csic.es/tools/venny/index.html), yielding 151 overlapping candidate targets. To resolve cross‑database annotation conflicts, a three‑step correction pipeline was implemented: (i) gene alias inconsistencies were unified via the UniProt ID mapping tool; (ii) paralogous redundant genes were excluded using CD‑HIT with a sequence similarity threshold > 0.4; and (iii) contradictory functional annotations were retained only if supported by at least two independent databases, while unique conflicting descriptions from a single source were discarded.
Network construction and hub identification
A protein-protein interaction (PPI) network was constructed by submitting the overlapping targets to the STRING database (version 12.0, https://cn.string-db.org/), with the search restricted to Homo sapiens. Only interactions with a combined confidence score ≥ 0.700 were retained to ensure high reliability, and all nodes lacking any connections were excluded from the network. The constructed PPI network was visualized and analyzed topologically in Cytoscape (version 3.10.2), after which hub genes were determined using the cytoHubba plugin, employing MCC (Maximal Clique Centrality) as the primary ranking algorithm and Degree as an auxiliary cross‑validation metric.
Functional enrichment analysis
Gene Ontology (GO) functional annotation and Kyoto Encyclopedia of Genes and Genomes (KEGG) pathway enrichment analyses for the differentially expressed genes were performed using the Bioinformatics Online Analysis Platform (https://www.bioinformatics.com.cn, last accessed on May 4, 2026). The platform employs Fisher's exact test to calculate raw P‑values, and the Benjamini-Hochberg (BH) method was used for multiple-testing correction to control the false discovery rate (FDR). GO terms (biological process, cellular component, and molecular function) and KEGG pathways with an FDR < 0.05 were considered significantly enriched.
Molecular docking
Crystal structures of the selected target proteins, representing active conformations, were obtained from the RCSB Protein Data Bank (https://www.rcsb.org/). Protein preparation was performed in Discovery Studio, including removal of water molecules and heteroatoms, deletion of redundant chains, repair of missing residues, addition of hydrogen atoms at pH 7.4, assignment of Gasteiger charges, and energy minimization. The binding pocket was defined based on the co‑crystallized ligand coordinates, using a grid that encompassed all critical substrate‑binding residues. Molecular docking of PLB was carried out using the SwissDock web server (http://www.swissdock.ch/) via the Attracting Cavities module. Binding free energies were calculated to assess affinity, and the lowest‑energy conformation for each target was selected as the final docking pose. The results of the molecular docking simulations were visualized to validate them.
Molecular dynamics simulation
Molecular dynamics (MD) simulations were carried out using GROMACS 2022.2. The Amber14SB force field was used to describe the protein, with the system solvated in TIP3P water. Plumbagin parameters, including AM1-BCC partial charges and GAFF2 atom types, were generated using Antechamber, followed by topology conversion with ACPYPE and assignment of Joung-Cheatham ion parameters. Each protein-ligand complex was embedded in a truncated dodecahedral simulation box with a minimum protein-to-box distance of 1.2 nm, solvated with TIP3P water molecules, and neutralized by adding 0.15 M Na⁺/Cl⁻. After energy minimization using the steepest descent algorithm (Fmax < 1,000 kJ·mol⁻1·nm⁻1), the system underwent sequential NVT and NPT equilibration for 200 ps each at 298 K. Production simulations were then performed for 200 ns under NPT conditions with a 2 fs integration time step using the Verlet cutoff scheme. Long-range electrostatic interactions were calculated with the particle mesh Ewald (PME) method, while both electrostatic and van der Waals interactions employed a cutoff distance of 1.2 nm. The LINCS algorithm was used to constrain hydrogen-containing bonds. Temperature was maintained at 298 K using the Nosé-Hoover thermostat and pressure at 1 bar using the Parrinello-Rahman barostat. Coordinates were saved every 10 ps for subsequent analyses. Trajectory analysis and visualization were performed using GROMACS utilities, VMD, and PyMOL, whereas MM-PBSA binding free energy calculations were carried out with gmx_MMPBSA where appropriate.
Equilibration assessment of molecular dynamics trajectories and MM-PBSA free energy sampling protocol
For each protein–plumbagin complex, a 200 ns all-atom production molecular dynamics simulation was performed using GROMACS. The 100 ns time point was set as the equilibration boundary: the 0–100 ns segment was designated as the conformational relaxation phase, during which the protein backbone and ligand-binding pocket underwent continuous conformational adjustments; the 100–200 ns segment was identified as the thermodynamically stable plateau, as evidenced by the absence of unidirectional drift in RMSD, radius of gyration (Rg), residue-wise RMSF, buried SASA of the ligand, intermolecular hydrogen bonds, and ligand–receptor interaction energies, which exhibited only minor steady-state fluctuations. All quantitative kinetic parameters and MM/PBSA binding free energies were calculated exclusively from the 100–200 ns equilibrium phase, from which frames were uniformly extracted every 100 ps, yielding 1,000 equilibrium snapshots per system for gmx_MMPBSA input. The first 100 ns of relaxation trajectories were discarded to eliminate interference from conformational drift in free-energy calculations.
Prognostic analysis of target genes in prostate cancer
Prognostic analyses were conducted using prostate cancer datasets from The Cancer Genome Atlas (TCGA). RNA sequencing (STAR-counts) data and corresponding clinical information were obtained from the Genomic Data Commons portal (https://portal.gdc.cancer.gov). Gene expression counts were converted to transcripts per million (TPM) and normalized using log2(TPM + 1). Following the exclusion of samples with incomplete clinical information, 498 cases were included in the analysis. The median expression level of each gene was used to divide patients into high- and low-expression groups. Kaplan-Meier survival analysis with the log-rank test and univariate Cox proportional hazards regression were performed to evaluate overall survival (OS) for SRC and progression-free survival (PFS) for MAPK3, with hazard ratios (HRs) and 95% confidence intervals (CIs) reported. Predictive performance was further assessed by generating time-dependent receiver operating characteristic (ROC) curves at 1, 3, and 5 years. Statistical analyses were carried out in R version 4.0.3, with P < 0.05 considered statistically significant.
Results
Prediction results of PLB and prostate cancer targets
The PubChem CID of PLB is 10205, with the IUPAC name: 5-hydroxy-2-methylnaphthalene-1,4-dione, SMILES: CC1=CC(=O)C2=C(C1=O)C=CC=C2O, InChIKey: VCMMXZQDRFWYSE-UHFFFAOYSA-N, InChI: InChI=1S/C11H8O3/c1-6-5-9(13)10-7(11(6)14)3-2-4-8(10)12/h2-5,12H,1H3, molecular weight: 188.18, molecular formula: C11H8O3, CAS number: 481-42-5. After removing duplicates, this study predicted 500 potential PLB targets using the SwissTarget, SEA, TargetNet, PharmMapper, CTD, TCMSP, and HERB databases (Supplementary Table S1). After removing duplicates, 1,199 potential targets for prostate cancer were predicted using the GeneCards, DrugBank, TCMSP, CTD, and HERB databases (Supplementary Table S2).
Mechanism of action of PLB in prostate cancer predicted by network pharmacology
A Venn diagram was constructed to analyze the intersection of targets, revealing 151 overlapping targets (Figure 1). A protein-protein interaction (PPI) network was subsequently constructed for these intersecting genes (Figure 2) and visualized by node degree, with darker red and larger node sizes indicating higher degree (Figure 3). Cytoscape software was used to analyze the core target genes (top 20) among the intersecting genes, with TP53 showing the highest degree of 112, followed by AKT1 with a degree of 111 (Figure 4).
Subsequently, the intersecting genes were uploaded to the DAVID database for Gene Ontology (GO) and KEGG pathway enrichment analyses. The GO analysis yielded 4,156 biological processes (Supplementary Table S3), 292 cellular components (Supplementary Table S4), and 562 molecular functions (Supplementary Table S5). The top 10 most significantly enriched terms in each category were visualized (Figure 5A-C). According to KEGG analysis, 187 pathways were significantly enriched (Supplementary Table S6), and the top 10 most relevant ones are presented in Figure 5D. These included pathways associated with prostate cancer, hepatitis B, proteoglycans in cancer, resistance to EGFR tyrosine kinase inhibitors, lipid metabolism and atherosclerosis, human cytomegalovirus infection, colorectal cancer, endocrine resistance, the AGE-RAGE pathway in diabetic complications, and the PI3K-Akt signaling pathway.
Core targets of PLB in the treatment of prostate cancer
Network pharmacology analysis identified 151 intersecting genes between PLB and prostate cancer. Based on the PPI network, we screened the top 20 potential core target genes with the highest connectivity: tumor protein p53 (TP53), AKT serine/threonine kinase 1 (AKT1), signal transducer and activator of transcription 3 (STAT3), estrogen receptor 1 (ESR1), BCL2 apoptosis regulator (BCL2), interleukin 6 (IL6), epidermal growth factor receptor (EGFR), catenin beta 1 (CTNNB1), tumor necrosis factor (TNF), phosphatase and tensin homolog (PTEN), caspase 3 (CASP3), mitogen-activated protein kinase 3 (MAPK3), heat shock protein 90 alpha family class A member 1 (HSP90AA1), SRC proto-oncogene, non-receptor tyrosine kinase (SRC), peroxisome proliferator activated receptor gamma (PPARG), mechanistic target of rapamycin kinase (MTOR), heat shock protein 90 alpha family class B member 1 (HSP90AB1), glycogen synthase kinase 3 beta (GSK3B), prostaglandin-endoperoxide synthase 2 (PTGS2), and matrix metallopeptidase 9 (MMP9). TP53 exhibited the highest connectivity, followed by AKT1, suggesting these may be key targets.
To select final targets for docking and molecular dynamics simulations, we prioritized genes encoding pro-oncogenic proteins with available crystal structures and defined binding pockets, including AKT1, STAT3, ESR1, BCL2, IL6, EGFR, TNF, MAPK3, HSP90AA1, SRC, PPARG, MTOR, HSP90AB1, GSK3B, PTGS2, and MMP9. Conversely, tumor suppressor genes, including TP53, were excluded as they do not align with the therapeutic strategy of target inhibition.
Therefore, further molecular docking studies were conducted. The results showed that PLB interacts with AKT1 via TRP80, SER205, LEU210, LEU264, and LYS268, with a binding energy (BE) of -7.764 kcal/mol27; PLB interacts with STAT3 via GLU612, SER613, ARG609, and PRO639, with a BE of -5.149 kcal/mol28; PLB interacts with ESR1 via LEU346, PHE404, ALA350, LEU387, and LEU391, with a BE of -7.165 kcal/mol29; PLB interacts with BCL2 via LYS53, PHE54, and HIS50, with a BE of -5.564 kcal/mol30; PLB interacts with IL6 via GLN28, LYS27, and ARG24, with a BE of -4.462 kcal/mol31; PLB interacts with EGFR via LEU778, LEU707, and LEU789, with a BE of -6.255 kcal/mol32; PLB interacts with TNF via TYR59, GLY121, and LEU120, with a BE of -6.570 kcal/mol33; PLB interacts with MAPK3 via ALA69, VAL56, ILE48, LEU124, MET125, and LEU173, with a BE of -7.369 kcal/mol34; PLB interacts with HSP90AA1 via LEU107, PHE138, TYR139, and TRP162, with a BE of -8.947 kcal/mol35; PLB interacts with SRC via LEU276, TYR343, MET344, ALA296, LEU396, and VAL284, with a BE of -7.469 kcal/mol36; PLB interacts with PPARG via LEU330, ARG288, ILE326, MET329, and ALA292, with a BE of -6.538 kcal/mol37; PLB interacts with MTOR via ALA2073, SER2069, and HIS2024, with a BE of -4.672 kcal/mol38; PLB interacts with HSP90AB1 via TYR134, PHE133, TRP157, and LEU102, with a BE of -6.928 kcal/mol39; PLB interacts with GSK3B via VAL70, VAL135, and ALA83, with a BE of -6.799 kcal/mol40; PLB interacts with PTGS2 via VAL315, THR561, ARG311, and ILE558, with a BE of -5.081 kcal/mol41; PLB interacts with MMP9 via LEU187, ALA189, MET247, TYR248, LEU188, HIS226, and VAL223, with a BE of -7.101 kcal/mol42. Except for IL6 and MTOR, the binding energies of PLB with the other proteins were below -5 kcal/mol, indicating that PLB may stably bind to these proteins (Table 1).
Subsequently, molecular dynamics simulations were performed to further analyze PLB interactions with these target proteins and to verify binding stability. Although some compounds ranked highly in docking scores, preliminary molecular dynamics simulations revealed early ligand drift or severe conformational distortions in several systems. Therefore, we excluded these unstable complexes and retained only those that maintained consistent binding poses after initial relaxation, proceeding with them as candidates for extended molecular dynamics simulations. The final retained targets were AKT1 (Supplementary File 1—Supplementary Figure S1), ESR1 (Supplementary File 1—Supplementary Figure S2), BCL2 (Supplementary File 1—Supplementary Figure S3), EGFR (Supplementary File 1—Supplementary Figure S4), TNF (Supplementary File 1—Supplementary Figure S5), MAPK3 (Supplementary File 1—Supplementary Figure S6), HSP90AA1 (Supplementary File 1—Supplementary Figure S7), SRC (Supplementary File 1—Supplementary Figure S8), and PPARG (Supplementary File 1—Supplementary Figure S9). After 200 ns of simulation, the RMSD of the complex structures of PLB with AKT1, ESR1, BCL2, EGFR, TNF, MAPK3, HSP90AA1, SRC, and PPARG gradually stabilized over the course of the simulation (see Supplementary File 1—Supplementary Figure S1-S9, panel A). Concurrently, metrics such as Rg (see Supplementary File 1—Supplementary Figure S1-S9, panel B), root mean square fluctuation (RMSF) (see Supplementary File 1—Supplementary Figure S1-S9, panel C), the distance between the protein and the ligand binding site (Dock site-ligand) (see Supplementary File 1—Supplementary Figure S1-S9, panel D), buried solvent accessible surface area (Buried SASA) (see Supplementary File 1—Supplementary Figure S1-S9, panel E), and binding conformation superposition (see Supplementary File 1—Supplementary Figure S1-S9, panel F) gradually stabilized as the simulation progressed. These results suggest that the protein-ligand complexes maintained structural stability throughout the simulations. RMSD, Rg, RMSF, protein-ligand distance, and buried SASA gradually reached stable values, indicating a compact complex with limited atomic fluctuations and sustained ligand occupancy within the binding pocket. In addition, the contact area between plumbagin and the protein remained relatively constant over time. Van der Waals, hydrophobic, and electrostatic interactions also exhibited stable profiles throughout the simulations, further supporting the overall stability of the protein-plumbagin complexes (see Supplementary File 1—Supplementary Figure S1-S9, panel G).
Considering solvation energy and comprehensively evaluating RMSD, Rg, Distance, Buried SASA, and interaction energies, stable-state complex trajectories were selected to calculate BE-related terms using the MM-PBSA (Molecular Mechanics-Poisson Boltzmann Surface Area) method. To provide confidence measures for the reported affinity rankings, all binding free energies are reported as mean ± SEM calculated from snapshots extracted over the equilibrated MD trajectories (Table 2). Among these, AKT1 exhibited the most negative binding free energy, followed by ESR1, HSP90AA1, SRC, and PPARG, suggesting that PLB may stably bind to these target proteins.
Moreover, this study analyzed the interacting residues between PLB and the targets (detailed in Table 3), finding that PLB binds stably to the target proteins primarily through hydrogen bonds (see Supplementary File 1—Supplementary Figure S1-S9, panel I), hydrophobic interactions, and van der Waals forces. By analyzing the contribution of amino acid binding energies (see Supplementary File 1—Supplementary Figure S1-S9, panel H) and the protein-PLB interactions, this study revealed: for AKT1, the key amino acids for PLB binding are TRP80 and LEU264, with van der Waals forces playing the major role, and electrostatic and hydrophobic interactions playing minor roles; for ESR1, the key amino acids are LEU346 and LEU525, with van der Waals forces playing the major role, hydrophobic interactions a secondary role, and electrostatic interactions a supplementary role; for BCL2, the key amino acids are TYR108 and PHE104, with van der Waals forces playing the major role, and electrostatic and hydrophobic interactions playing minor roles; for EGFR, the key amino acids are MET1002 and TYR998, with van der Waals forces playing the major role, and electrostatic and hydrophobic interactions playing minor roles; for TNF-α, the key amino acids are TYR59 and HIE15, with van der Waals forces playing the major role, and electrostatic and hydrophobic interactions playing minor roles; for MAPK3, the key amino acids are TYR53 and LEU173, with van der Waals forces playing the major role, and electrostatic and hydrophobic interactions playing minor roles; for HSP90AA1, the key amino acids are PHE138 and LEU107, with van der Waals forces playing the major role, and electrostatic and hydrophobic interactions playing minor roles; for SRC, the key amino acids are LEU276 and LEU396, with van der Waals forces playing the major role, and electrostatic and hydrophobic interactions playing minor roles; for PPARG, the key amino acids are LEU330 and ILE326, with van der Waals forces playing the major role, and electrostatic and hydrophobic interactions playing minor roles.
All protein crystal structures used in this study, except for BCL2, were co-crystallized with known inhibitors. To further validate the reliability of our docking approach and the binding potential of PLB, we defined the active binding pockets based on the original inhibitor binding sites. Both PLB and the respective native inhibitors were docked into the same pockets, and their binding free energies were calculated and compared. For each target, only those docking poses of the native inhibitor that closely reproduced the crystallographic binding conformation were considered for energy comparison. As shown in Table 4, the docking binding free energies of PLB were comparable to those of the respective native inhibitors across all eight targets, suggesting that PLB possesses similar pocket-binding affinity to these validated active compounds. This finding indicates that PLB, as a novel scaffold molecule, may serve as a promising chemical template for the development of new anti-prostate cancer agents targeting these oncogenic hubs.
Prognostic value of target genes in prostate cancer
As representative targets, we evaluated the prognostic significance of SRC and MAPK3 in prostate cancer using TCGA datasets. For SRC, gradient distribution analysis showed that higher SRC expression was associated with increased mortality and significantly shorter follow-up survival times (Figure 6A). Kaplan-Meier survival analysis (Figure 6B) confirmed that the high expression group had markedly poorer overall survival than the low expression group (Log-rank P = 0.0317, HR = 9.708, 95% CI: 1.22–77.234). Cumulative hazard curves indicated a higher probability of death at any time point in the high expression cohort, identifying SRC as a risk factor for poor prognosis. Time-dependent ROC curves (Figure 6C) demonstrated AUC values of 0.99, 0.878, and 0.829 at 1, 3, and 5 years, respectively, all exceeding 0.7, indicating excellent predictive performance for both short-term and long-term survival. Collectively, these findings suggest that high SRC expression may serve as an independent molecular marker for unfavorable prognosis in prostate cancer.
For MAPK3, the gradient distribution revealed that elevated expression was associated with greater tumor progression and shorter progression-free survival, preliminarily suggesting MAPK3 as a potential risk gene (Figure 7A). Kaplan-Meier progression-free survival analysis (Figure 7B) showed that the high-expression group had significantly shorter progression-free survival than the low-expression group (Log-rank P = 0.0298, HR = 1.581, 95% CI: 1.046–2.391), with a median progression-free survival of only 5.8 years in the high-expression group. Cumulative hazard curves further validated a higher probability of progression at any time point. However, time-dependent ROC curves (Figure 7C) revealed AUC values of only 0.568, 0.563, and 0.574 at 1, 3, and 5 years, all well below 0.7, indicating that MAPK3 alone has limited independent predictive value for prostate cancer progression risk. Overall, while high MAPK3 expression correlates with worse progression-free survival in prostate cancer, its utility as a sole prognostic indicator is constrained by modest predictive accuracy.
Data Availability Statement
The original contributions presented in this study are included in the article or Supplementary Materials.
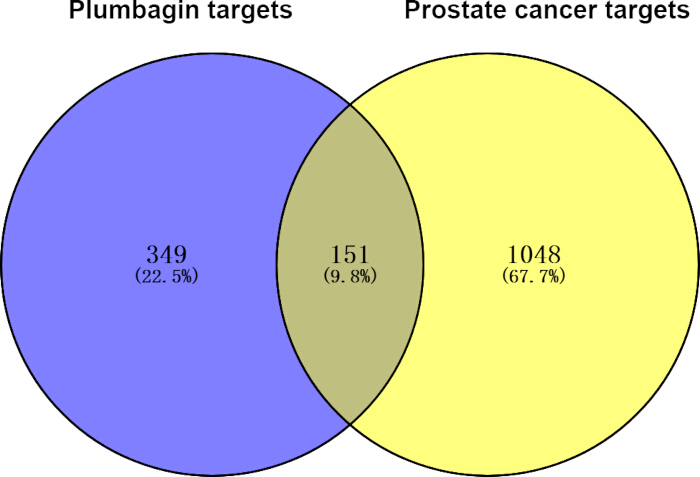
Figure 1: Intersection of plumbagin and prostate cancer targets. Blue represents the number of plumbagin targets, and yellow represents the number of prostate cancer targets.
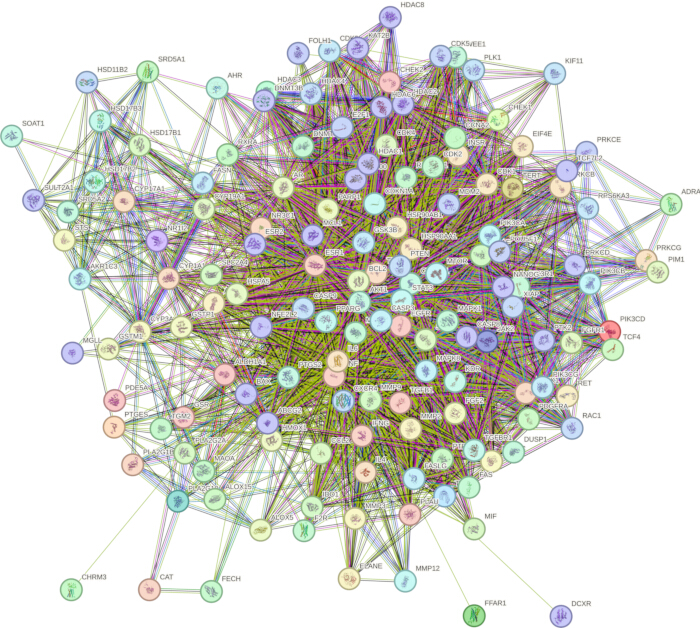
Figure 2: Protein-protein interaction network of the 151 intersecting targets. Please click here to view a larger version of this figure.
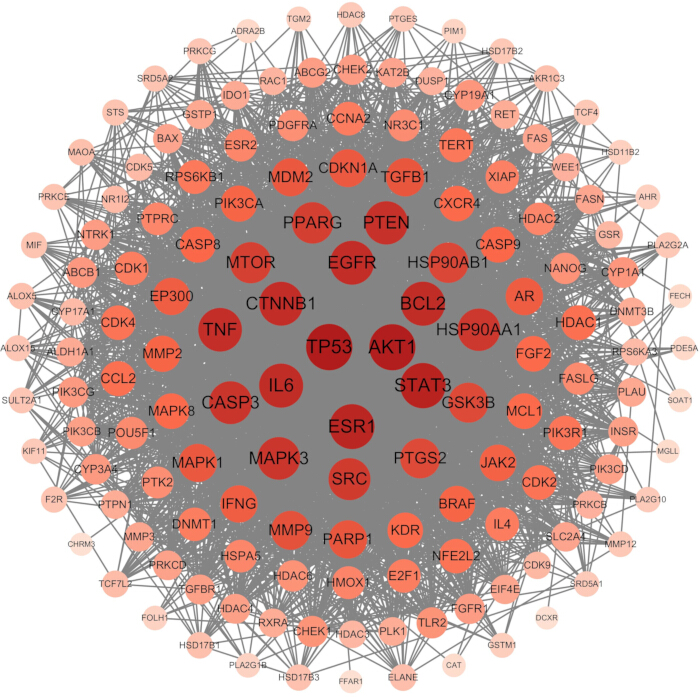
Figure 3: Visualization of the 151 core targets based on node degree in the protein-protein interaction network. The larger size and deeper color of circles represent higher degree values in the network. Please click here to view a larger version of this figure.
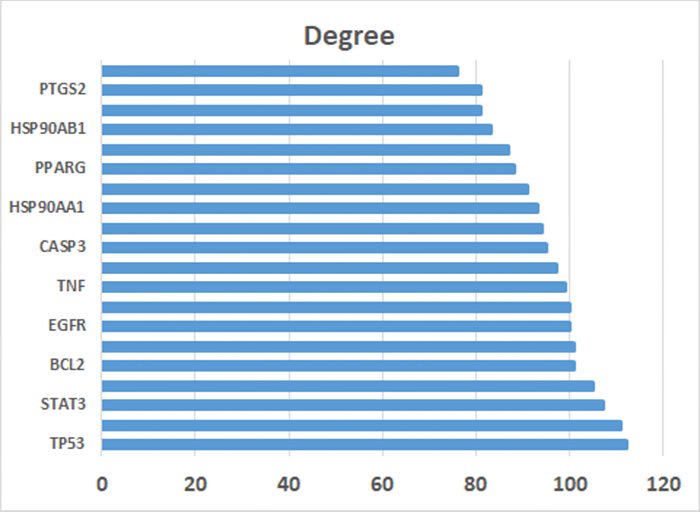
Figure 4: Degree values of the top 20 core targets. Please click here to view a larger version of this figure.
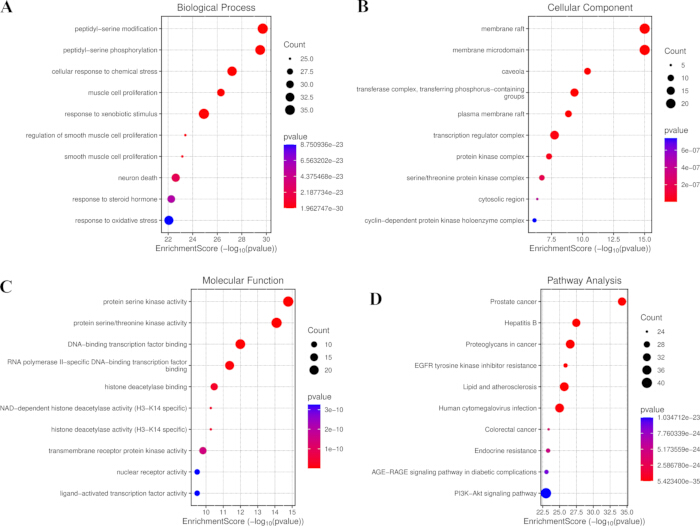
Figure 5: Enrichment analysis of the 151 core targets. (A) Top 10 terms in the biological process category of GO analysis, (B) top 10 terms in the cellular component category of GO analysis, and (C) top 10 terms in the molecular function category of GO analysis. (D) Top 10 KEGG enriched pathways of the 151 core targets. Abbreviations: GO = Gene Ontology; KEGG = Kyoto Encyclopedia of Genes and Genomes. Please click here to view a larger version of this figure.
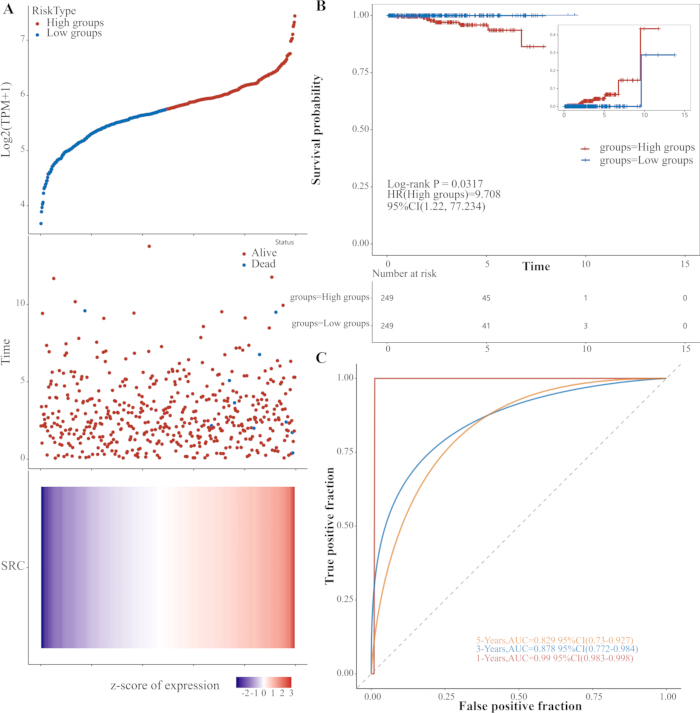
Figure 6: Prognostic analysis of SRC in prostate cancer (TCGA). (A) Gradient distribution of SRC expression by survival status and follow-up time. (B) Kaplan–Meier overall survival curves for SRC high- vs. low-expression groups (Log-rank P = 0.0317, HR = 9.708, 95% CI: 1.22–77.234). (C) Time-dependent ROC curves at 1, 3, and 5 years (AUC = 0.990, 0.878, and 0.829). Abbreviations: TCGA = The Cancer Genome Atlas; HR = hazard ratio; CI = confidence interval; ROC = receiver operating characteristic; AUC = area under the curve. Please click here to view a larger version of this figure.
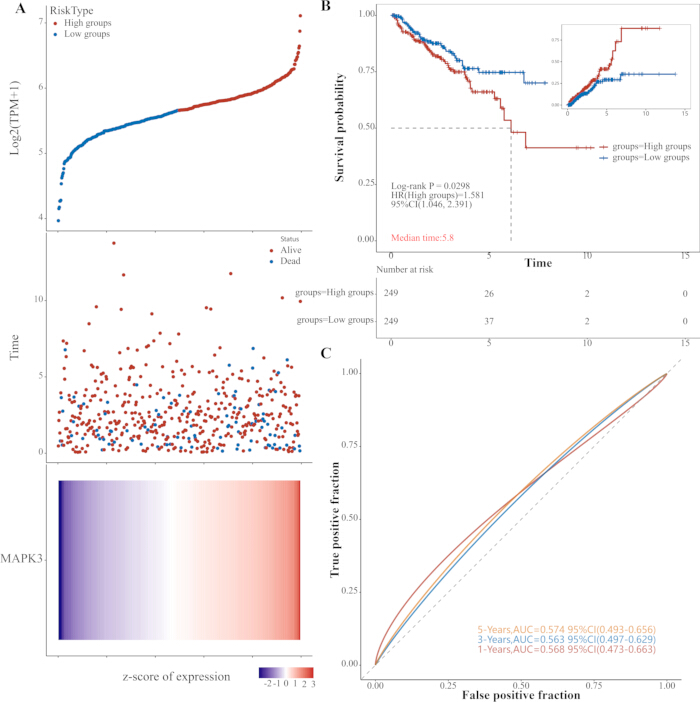
Figure 7: Prognostic analysis of MAPK3 in prostate cancer (TCGA). (A) Gradient distribution of MAPK3 expression by progression status and progression-free time. (B) Kaplan-Meier progression-free survival curves for MAPK3 high- vs. low-expression groups (Log-rank P = 0.0298, HR = 1.581, 95% CI: 1.046-2.391). (C) Time-dependent ROC curves at 1, 3, and 5 years (AUC = 0.568, 0.563, and 0.574). Abbreviations: TCGA = The Cancer Genome Atlas; HR = hazard ratio; CI = confidence interval; ROC = receiver operating characteristic; AUC = area under the curve. Please click here to view a larger version of this figure.
Table 1: Binding energies and interacting residues of plumbagin in molecular docking with key target molecules. The cited references correspond to PDB structure entries (crystallographic ligand-binding pocket assignments) rather than biological validation studies, with the corresponding PDB IDs explicitly indicated. Please click here to download this Table.
Table 2: Binding energies and their components of plumbagin-target complexes under steady-state conditions (kJ/mol). Only a single 200 ns trajectory per complex was performed with a single random velocity seed, without parallel replicates. All conformational sampling was extracted from the equilibrated plateau region spanning 100–200 ns of each trajectory. ΔEele represents the electrostatic interaction between the small molecule and the protein, ΔEvdw represents the van der Waals interaction, ΔEpol is the polar solvation energy, which can represent the electrostatic potential energy, and ΔEnonpol is the non-polar solvation energy, which can represent the hydrophobic interaction. ΔEMMPBSA = ΔEele + ΔEvdw + ΔEpol + ΔEnonpol. The Gibbs binding energy, ΔGbind = ΔEMMPBSA + -TΔS. Please click here to download this Table.
Table 3: Schematic diagram of interacting residues from molecular dynamics simulation of plumbagin with target proteins. Please click here to download this Table.
Table 4: Docking binding free energies of plumbagin and native co‑crystallized inhibitors for the nine target proteins. Please click here to download this Table.
Supplementary File 1: Molecular dynamics simulation analyses of the complexes of plumbagin with AKT1, ESR1, BCL2, EGFR, TNF-α, MAPK3, HSP90AA1, SRC, and PPARG. Please click here to download this file.
Supplementary Table S1: Potential targets of PLB predicted by SwissTarget, SEA, TargetNet, PharmMapper, CTD, TCMSP, and HERB databases.Please click here to download this file.
Supplementary Table S2: Potential targets of prostate cancer predicted by the GeneCards, DrugBank, TCMSP, CTD, and HERB databases.Please click here to download this file.
Supplementary Table S3: GO biological processes enriched for the 151 overlapping targets of PLB and prostate cancer.Please click here to download this file.
Supplementary Table S4: GO cellular components enriched for the 151 overlapping targets of PLB and prostate cancer.Please click here to download this file.
Supplementary Table S5: GO molecular functions enriched for the 151 overlapping targets of PLB and prostate cancer.Please click here to download this file.
Supplementary Table S6: KEGG pathways significantly enriched for the 151 overlapping targets of PLB and prostate cancer.Please click here to download this file.
Discussion
Studies have shown that AKT1, ESR1, BCL2, EGFR, TNF, MAPK3, HSP90AA1, SRC, and PPARG play diverse roles in promoting cancer progression. The phosphatidylinositol 3-kinase (PI3K)/serine/threonine protein kinase (AKT)/mechanistic target of rapamycin (mTOR) signaling pathway is a crucial intracellular signal transduction pathway that regulates various pathophysiological processes, including cell growth, proliferation, apoptosis, angiogenesis, inflammatory responses, and chemotaxis43. AKT is an important downstream target kinase of PI3K, and p-AKT is essential for the signaling pathway. p-AKT exerts its anti-apoptotic effects by activating the anti-apoptotic protein Bcl-2 and reducing the activation of the pro-apoptotic protein Bax44. GSK3β is a major intracellular serine/threonine family kinase and an important downstream target molecule of AKT, regulating the cell cycle, apoptosis, cell invasion/metastasis, and angiogenesis by participating in multiple signaling pathways45. mTOR is a highly conserved serine/threonine protein kinase and a downstream target of the PI3K/AKT signaling pathway. AKT phosphorylates mTOR to form p-mTOR and activate it, which subsequently promotes mRNA translation and regulates physiological activities such as cell metabolism, growth, proliferation, and survival46.
EGFR and its ligands EGF and TGFα are present in both benign and malignant cells of the prostate. The interaction between the ligands EGF/TGFα and EGFR plays an important role in prostate growth and development as well as in prostate cancer initiation and progression47. Visacorpi et al.48 found that high EGFR expression is closely associated with high-grade prostate cancer and poor prognosis. Ibrahim et al.49 reported that EGFR expression is higher in normal or benign hyperplastic prostate tissues than in prostate cancer tissues. Davies et al.50 found a negative correlation between androgen receptor expression and EGF binding affinity to EGFR in prostate cancer specimens, indirectly suggesting that activation of the EGF/EGFR signaling system is involved in the development and progression of androgen-independent prostate cancer.
The mitogen-activated protein kinase (MAPK) pathway, also known as the RAS/RAF/MEK/ERK cascade, is a critical signaling pathway involved in cell growth, proliferation, and survival. Mutations in its core components, including RAS, RAF, MEK, and ERK, are frequently observed in various cancers and significantly impact tumor development and progression51. MAPK signaling is mediated by ERKs, which are serine/threonine protein kinases that act as key signal-transduction molecules regulating the transmission of signals from growth factors, hormones, neurotransmitters, and other extracellular stimuli52. Hyperactivation of components of this pathway, particularly through mutations or aberrant signaling, has been implicated in numerous cancer types. The upstream kinases MEK1/2 directly activate ERK1/2 at the terminal end of the pathway. Activated ERK1/2 subsequently phosphorylate a range of nuclear and cytoplasmic substrates, including transcription factors and regulatory molecules, thereby rapidly inducing the expression of early response genes that control cell proliferation53,54. Ultimately, these activated proteins promote the expression of downstream effector molecules, triggering and regulating oncogenic transformation or uncontrolled cell proliferation. Among these, ERK1 (MAPK3), as a closely related kinase in the MAPK/ERK signaling pathway, plays a key role in cellular signal transduction and is essential for regulating processes such as cell proliferation, differentiation, and survival in cancers, including prostate cancer55.
Heat shock proteins (HSPs) are molecular chaperones that prevent degradation of their client proteins. In human cancers, HSPs are often upregulated and intimately linked to tumor progression, contributing to tumorigenesis, angiogenesis, apoptosis resistance, and metastasis56,57. Through maintaining the stability of client proteins, including the androgen receptor (AR), estrogen receptor (ER), and MYC, HSPs regulate critical signaling pathways such as PI3K/Akt, JAK/STAT3, PKL1, and MAPK, ultimately promoting uncontrolled cell growth, persistent angiogenesis, evasion of apoptosis, tumor invasion, and metastasis58,59,60. HSP90, a key member of this family, has been identified as a potential therapeutic target in prostate cancer59,61,62. In prostate cancer cells, HSP90 interacts with and stabilizes both AR-FL and AR-V7, preserving their ligand-binding capacity, and HSP90 expression positively correlates with disease progression and AR-FL/AR-V7 levels63. Pharmacological inhibition of HSP90 promotes proteasomal degradation of AR-FL and AR-V7, thereby reducing tumor growth and metastasis in castration-resistant prostate cancer cells63. HSP90AA1 acts as a chaperone during AR activation, and its inhibition suppresses the AKT/mTOR and PLK1 pathways. Furthermore, decreased HSP90AA1 expression significantly reduces the migration, invasion, and proliferation of prostate cancer cells64.
ESR1 is one component of the dual estrogen receptor system in the human prostate. ESR1 is upregulated in high-grade prostatic intraepithelial neoplasia (HGPIN), likely mediating the carcinogenic effects of estradiol, and is involved in prostate cancer development and tumor progression. Preliminary clinical studies using the ESR1 antagonist toremifene have identified ESR1 as a promising target for prostate cancer prevention. The use of ESR1 antagonists holds great potential for preventing prostate cancer and delaying disease progression65.
PPARG, a nuclear receptor superfamily member, is a key regulator of inflammatory processes66. Upon ligand-induced heterodimerization with the retinoid X receptor, PPARG binds to PPAR response elements in DNA to regulate the transcription of various genes. PPARG activation suppresses NF-κB and MAPK signaling, decreases TNF-α and IL-6 production, and thus alleviates inflammatory responses67. Previous studies have shown that targeting PPARG can be used for the treatment of prostate cancer68. The PTGS2 protein is localized in the perinuclear region, associated with the nuclear and endoplasmic reticulum membranes. It is rapidly expressed in selected cells upon specific stimulation and participates in the mediation of inflammatory responses69.
PLB is one of the major anticancer agents against various cancer types, including prostate, lung, breast, melanoma, and ovarian cancer19. PLB exerts its anticancer effects by interacting with multiple targets and influencing key signaling pathways, including AMPK, NFκB, PI3K/AKT/mTOR, and STAT3/PLK1/AKT, thereby inducing apoptosis, arresting the cell cycle, and inhibiting metastasis and angiogenesis19,70. PLB can also induce apoptosis and inhibit tumor cell proliferation and migration by reducing the mitochondrial membrane potential, increasing ROS levels, and downregulating Bcl-2 protein expression71,72. These results indicated that PLB may regulate multiple cellular processes, including the cell cycle, apoptosis, reactive oxygen species formation, autophagy, and the PI3K/Akt/mTOR pathway. Given the positive role of the PI3K/Akt/mTOR signaling pathway in prostate cancer cell/tissue proliferation, targeting this pathway has become an obvious choice. Furthermore, Hafeez et al. reported that PLB treatment in a PTEN knockout mouse model of prostate cancer inhibited epithelial-mesenchymal transition, STAT3, and AKT pathways, which are critical for prostate cancer progression73.
The translational potential of PLB is influenced by its pharmacokinetic properties and bioavailability. As a highly lipophilic naphthoquinone, PLB exhibits poor aqueous solubility and a short elimination half-life (35.89 ± 7.95 min) with rapid clearance, which limits its clinical application74. However, various drug delivery systems have been developed to overcome these limitations. PEGylated liposomes extended the half-life by 36.38-fold (1,305.76 ± 278.16 min) and AUC by 3.13-fold compared with free PLB, while demonstrating superior antitumor efficacy and extended median survival in melanoma-bearing mice without significant toxicity.74 Other strategies, including chitosan microspheres (22.2-fold extension of half-life), temperature-sensitive liposomes, and PLB-conjugated gold nanoparticles and nanoemulsions, have similarly demonstrated improved pharmacokinetic profiles and enhanced antitumor activity75,76,77. Importantly, PLB demonstrates a favorable safety profile in preclinical models, with no significant toxicity observed in hematological parameters or major organs at therapeutic doses74. Collectively, our computational findings suggest that PLB may stably interact with AKT1, ESR1, BCL2, EGFR, TNF, MAPK3, HSP90AA1, SRC, and PPARG, potentially modulating their functional activity and thereby influencing downstream processes, including cancer cell growth, proliferation, apoptosis, angiogenesis, inflammatory responses, and chemotaxis. While these findings are computational in nature and should be interpreted as hypothesis-generating, the existing preclinical evidence of PLB's antitumor activity, along with advanced formulation strategies, provides a strong rationale for further experimental validation. Future in vitro, in vivo, and prospective cohort studies are warranted to confirm the predicted interactions and therapeutic potential of PLB in prostate cancer.
The present study found that, in addition to potentially modulating pathways involving AKT1, ESR1, BCL2, EGFR, TNF, MAPK3, HSP90AA1, SRC, and PPARG, PLB may also interact with these proteins, potentially affecting their functional activity and thereby influencing downstream processes such as cancer cell growth, proliferation, apoptosis, angiogenesis, inflammatory responses, and chemotaxis. However, these findings are computational in nature and should be interpreted as hypothesis-generating. Further in vitro, in vivo, and prospective cohort studies are warranted to validate the predicted interactions and to confirm the therapeutic potential of PLB in prostate cancer.
Despite the valuable insights provided by network pharmacology and molecular dynamics simulations, this study has several limitations. We acknowledge that reliance on public databases may introduce bias due to uneven gene annotation and literature coverage. Although multi‑database cross‑validation was applied to minimize this issue, all computational predictions require experimental confirmation. It should be noted that only a single 200 ns trajectory per complex was performed with a single random velocity seed, without parallel replicates. This limitation may affect the statistical robustness of the MM-PBSA free energies, although we mitigated this by extending the simulation length and discarding the first 100 ns as equilibration. The reported binding affinities should therefore be interpreted as qualitative estimates, and future replicate simulations would be valuable for validation. As a pure computational analysis, this study lacks in vitro or in vivo validation; therefore, the predicted binding of PLB to AKT1, ESR1, BCL2, EGFR, TNF, MAPK3, HSP90AA1, SRC, and PPARG does not confirm functional inhibition in biological systems. Additionally, the study does not address target specificity, cellular bioavailability, or in vivo pharmacokinetics. To validate or replace the current findings, alternative experimental approaches should include surface plasmon resonance or isothermal titration calorimetry to measure direct binding affinity, kinase activity assays to confirm enzymatic inhibition, western blotting to assess downstream signaling (e.g., p-AKT, p-EGFR), and cell-based functional assays (such as MTT, flow cytometry) to evaluate proliferation and apoptosis in prostate cancer cells. Furthermore, CRISPR-Cas9 or siRNA-mediated knockdown of individual targets, along with in vivo mouse xenograft models, are essential to establish causal roles and therapeutic relevance. These experimental validations are necessary to move beyond computational predictions toward biologically meaningful conclusions.
In conclusion, using network pharmacology, molecular docking, and molecular dynamics simulations, this study suggests that PLB may interact with and modulate the activities of AKT1, ESR1, BCL2, EGFR, TNF, MAPK3, HSP90AA1, SRC, and PPARG, thereby influencing tumor cell biological functions. However, as these findings are purely computational, they should be interpreted as hypothesis-generating rather than conclusive. Overall, our results provide new insights and a theoretical foundation for future experimental investigations into the mechanisms of PLB in prostate cancer treatment, though in vitro and in vivo studies are essential to confirm its actual inhibitory effects and therapeutic potential.
Disclosures
The authors have no conflicts of interest to declare.
Materials
| Name | Company | Catalog Number | Comments |
|---|---|---|---|
| Comparative Toxicogenomics Database | National Institute of Environment Health Studies, National Institute of Neurological Disorders and Stroke | https://ctdbase.org/ | CTD is a robust, publicly available database that aims to advance understanding about how environmental exposures affect human health. It provides manually curated information about chemical-gene/protein interactions, chemical-disease and gene-disease relationships. These data are integrated with functional and pathway data to aid in development of hypotheses about the mechanisms underlying environmentally influenced diseases. |
| Cytoscape | Institute for Systems Biology, ISB, Leroy Hood | https://cytoscape.org/ | Initially designed specifically for biomolecular interaction networks, the software has now evolved into a versatile platform for analyzing complex networks, widely applied in fields such as bioinformatics, systems medicine, social networks, and semantic networks |
| DAVID database | National Institutes of Health (NIH) | https://davidbioinformatics.nih.gov/list.jsp | DAVID, short for Database for Annotation, Visualization and Integrated Discovery, is the most classic and widely used free online platform for gene set functional annotation and enrichment analysis |
| DrugBank | University of Alberta, Canada | https://go.drugbank.com/ | DrugBank is the intelligence operating system for biopharma, delivering the most comprehensive, structured biomedical knowledge to help advance therapies from discovery to patient impact |
| GeneCard | LifeMap Sciences | https://www.genecards.org/ | GeneCards is a searchable, integrative database that provides comprehensive, user-friendly information on all annotated and predicted human genes. The knowledgebase automatically integrates gene-centric data from 193 web sources, including genomic, transcriptomic, proteomic, genetic, clinical and functional information. |
| gmx_MMPBSA | Columbia University of Medellin | https://valdes-tresanco-ms.github.io/gmx_MMPBSA/ | gmx_MMPBSA, an open-source free energy calculation tool developed by Valdés-Tresanco et al., was adopted to compute binding free energies based on MM/PBSA and MM/GBSA methodologies. Built upon the MMPBSA.py engine from AmberTools, it directly processes trajectory files generated by GROMACS without manual format conversion. Residue-wise energy decomposition, computational alanine scanning and entropy correction were performed to quantify binding contributions of key amino acids, and the built-in gmx_MMPBSA_ana module was used for statistical analysis and visualization of energy components. |
| GROMACS | Royal Institute of Technology (KTH), Uppsala University | www.gromacs.org | GROMACS is a versatile package to perform molecular dynamics, i.e. simulate the Newtonian equations of motion for systems with hundreds to millions of particles and is a community-driven project. Contributions are welcome in many forms, including improvements to documentation, patches to fix bugs, advice on the forums, bug reports that let us reproduce the issue, and new functionality |
| HERB | Beijing University of Chinese Medicine, Beijing University of Chinese Medicine. | http://herb.ac.cn/ | A high-throughput experiment- and reference-guided database of traditional Chinese medicine. |
| PharmMapper | School of Pharmaceutical Science and Technology / School of Information Science and Engineering, East China University of Science and Technology | https://www.lilab-ecust.cn/pharmmapper/index.html | PharmMapper Server is a freely accessed web-server designed to identify potential target candidates for the given probe small molecules (drugs, natural products, or other newly discovered compounds with binding targets unidentified) using pharmacophore mapping approach. Benefited from the highly efficient and robust mapping method, PharmMapper bears high throughput ability and can identify the potential target candidates from the database within a few hours. |
| PubChem | National Institutes of Health (NIH) | https://pubchem.ncbi.nlm.nih.gov/ | PubChem is an open chemistry database at the National Institutes of Health (NIH) |
| PyMOL | Schrödinger | https://pymol.org | PyMOL, initially developed by Warren Lyford DeLano and currently maintained by Schrödinger, Inc., is a cross-platform molecular visualization tool widely adopted in structural biology and computer-aided drug discovery. Protein-ligand complex structures downloaded from RCSB PDB were loaded into PyMOL to visualize binding conformations, hydrogen bonds and key interacting residues. Structural superimposition, surface rendering and high-resolution publication-quality molecular graphics were generated via built-in Python scripting interface. |
| RCSB Protein Data Bank | Research Collaboratory for Structural Bioinformatics | https://www.rcsb.org/ | RCSB PDB (Research Collaboratory for Structural Bioinformatics Protein Data Bank) serves as the US data center of the Worldwide Protein Data Bank (wwPDB) consortium, established and led by Helen M. Berman in 1998. It archives experimentally determined three-dimensional atomic structures of proteins, nucleic acids and their complexes resolved by X-ray crystallography, cryo-electron microscopy and NMR spectroscopy, and integrates millions of AI-predicted protein structure models from AlphaFold. The web portal supports multi-dimensional search, real-time 3D molecular visualization, batch coordinate file download, and cross-reference annotations linking structural data to gene function, disease and small-molecule ligands, widely utilized for target identification and molecular docking studies. |
| SEA | Shoichet Laboratory in the Department of Pharmaceutical Chemistry at the University of California, San Francisco (UCSF | https://sea.bkslab.org/ | the Similarity Ensemble Approach (SEA) relates proteins based on the set-wise chemical similarity among their ligands. It can be used to rapidly search large compound databases and to build cross-target similarity maps |
| STRING database | Global Biodata Coalition and ELIXIR. | https://cn.string-db.org/ | STRING is a database of known and predicted protein-protein interactions. The interactions include direct (physical) and indirect (functional) associations; they stem from computational prediction, from knowledge transfer between organisms, and from interactions aggregated from other (primary) databases. |
| Swiss Dock web server | Molecular Modelling Group of the University of Lausanne and the SIB Swiss Institute of Bioinformatics | https://www.swissdock.ch/ | SwissDock is a web service that predicts the molecular interactions likely to occur between a target protein and a small molecule. |
| SwissTarget | Molecular Modeling Group of the SIB | Swiss Institute of Bioinformatics | https://swisstargetprediction.ch/index.php | This website allows you to estimate the most probable macromolecular targets of a small molecule, assumed as bioactive. The prediction is founded on a combination of 2D and 3D similarity with a library of 37 0'000 known actives on more than 3000 proteins from three different species. |
| TargetNet | Computational Biology & Drug Design Group | http://targetnet.scbdd.com/calcnet/index/ | TargetNet is an open web server that could be used for netting or predicting the binding of multiple targets for any given molecule |
| Traditional Chinese Medicine Systems Pharmacology Database and Analysis Platform | Zhejiang Jiwei Health Co., Ltd | https://www.tcmsp-e.com/index.php | TCMSP is a unique systems pharmacology platform of Chinese herbal medicines that captures the relationships between drugs, targets and diseases. The database includes chemicals, targets and drug-target networks, and associated drug-target-disease networks, as well as pharmacokinetic properties for natural compounds involving oral bioavailability, drug-likeness,intestinal epithelial permeability, blood-brain-barrier, aqueous solubility and etc. This breakthrough has sparked a new interest in the search of candidate drugs in various types of traditional Chinese herbs. |
| UniProt database | European Bioinformatics Institute (EMBL-EBI), the SIB Swiss Institute of Bioinformatics and the Protein Information Resource (PIR) | https://www.uniprot.org/ | UniProt is the world’s leading high-quality, comprehensive and freely accessible resource of protein sequence and functional information |
| Venny 2.1 online tool | Centro Nacional de Biotecnología, (CNB-CSIC) | https://bioinfogp.cnb.csic.es/tools/venny/index.html | Venny consists on a single standard html file. Feel free to save it to your hard disk, open it with your favorite browser, and start drawing nice Venn's diagrams in seconds, even without internet connection. |
| VMD | Theoretical and Computational Biophysics Research Group (TCBG) at Beckman Institute, University of Illinois at Urbana Champaign, USA | https://www.ks.uiuc.edu/Research/vmd/ | VMD (Visual Molecular Dynamics) is a free cross-platform molecular visualization and trajectory analysis software developed by the Theoretical and Computational Biophysics Group led by Professor Klaus Schulten at the University of Illinois Urbana-Champaign. It supports standard PDB structures and MD trajectories generated by GROMACS, NAMD and Amber, with diverse molecular rendering styles and built-in Tcl scripting interface. Quantitative analyses including RMSD, hydrogen bond occupancy, SASA and ligand binding pocket geometry were performed to characterize dynamic protein-ligand interactions and conformational fluctuations. |
References
- Bray F, et al. Global cancer statistics 2022: GLOBOCAN estimates of incidence and mortality worldwide for 36 cancers in 185 countries. CA Cancer J Clin. 2024;74(3):229-63.
- Loeb S, et al. Overdiagnosis and overtreatment of prostate cancer. Eur Urol. 2014;65(6):1046-55.
- James ND, et al. The Lancet Commission on prostate cancer: planning for the surge in cases. Lancet. 2024;403(10437):1683-722.
- Bussard KM, Gay CV, Mastro AM. The bone microenvironment in metastasis: what is special about bone? Cancer Metastasis Rev. 2008;27(1):41-55.
- Keller ET, et al. New trends in the treatment of bone metastasis. J Cell Biochem. 2007;102(5):1095-102.
- Kingsley LA, Fournier PG, Chirgwin JM, Guise TA. Molecular biology of bone metastasis. Mol Cancer Ther. 2007;6(10):2609-17.
- Valdespino V, Tsagozis P, Pisa P. Current perspectives in the treatment of advanced prostate cancer. Med Oncol. 2007;24(3):273-86.
- Albertsen P. Predicting survival for men with clinically localized prostate cancer: what do we need in contemporary practice? Cancer. 2008;112(1):1-3.
- So A, Gleave M, Hurtado-Col A, Nelson C. Mechanisms of the development of androgen independence in prostate cancer. World J Urol. 2005;23(1):1-9.
- Gupta S. Prostate cancer chemoprevention: current status and future prospects. Toxicol Appl Pharmacol. 2007;224(3):369-76.
- Patel D, Shukla S, Gupta S. Apigenin and cancer chemoprevention: progress, potential, and promise. Int J Oncol. 2007;30(1):233-45.
- Kallifatidis G, Hoy JJ, Lokeshwar BL. Bioactive natural products for chemoprevention and treatment of castration-resistant prostate cancer. Semin Cancer Biol. 2016;40-41:160-9.
- Montuori E, et al. Marine natural products with activities against prostate cancer: recent discoveries. Int J Mol Sci. 2023;24(2):1435.
- de Paiva SR, Figueiredo MR, Aragão TV, Kaplan MAC. Antimicrobial activity in vitro of plumbagin isolated from Plumbago species. Mem Inst Oswaldo Cruz. 2003;98(7):959-61.
- Luo P, et al. Anti-inflammatory and analgesic effect of plumbagin through inhibition of nuclear factor-κB activation. J Pharmacol Exp Ther. 2010;335(3):735-42.
- Sharma I, Gusain D, Dixit VP. Hypolipidaemic and antiatherosclerotic effects of plumbagin in rabbits. Indian J Physiol Pharmacol. 1991;35(1):10-4.
- Awale S, et al. Targeting pancreatic cancer with novel plumbagin derivatives: design, synthesis, molecular mechanism, in vitro and in vivo evaluation. J Med Chem. 2023;66(12):8054-65.
- Zhang R, Jiang Q, Guo R, Guo K, Qiu J. Unveiling the power of plumbagin: revitalizing exhausted T cells to combat tongue cancer. Cancer Cell Int. 2025;25(1):271.
- Panichayupakaranant P, Ahmad MI. Plumbagin and its role in chronic diseases. Adv Exp Med Biol. 2016;929:229-46.
- Kuete V, et al. Cytotoxicity of plumbagin, rapanone, and 12 other naturally occurring quinones from Kenyan flora towards human carcinoma cells. BMC Pharmacol Toxicol. 2016;17(1):60.
- Gharbaran R, Shi C, Onwumere O, Redenti S. Plumbagin induces cytotoxicity via loss of mitochondrial membrane potential and caspase activation in metastatic retinoblastoma. Anticancer Res. 2021;41(10):4725-32.
- Aziz MH, Dreckschmidt NE, Verma AK. Plumbagin, a medicinal plant-derived naphthoquinone, is a novel inhibitor of the growth and invasion of hormone-refractory prostate cancer. Cancer Res. 2008;68(21):9024-32.
- Powolny AA, Singh SV. Plumbagin-induced apoptosis in human prostate cancer cells is associated with modulation of cellular redox status and generation of reactive oxygen species. Pharm Res. 2008;25(9):2171-80.
- Qiu JX, et al. Plumbagin elicits differential proteomic responses mainly involving cell cycle, apoptosis, autophagy, and epithelial-to-mesenchymal transition pathways in human prostate cancer PC-3 and DU145 cells. Drug Des Devel Ther. 2015;9:349-417.
- Wang F, et al. Plumbagin induces cell cycle arrest and autophagy and suppresses epithelial-to-mesenchymal transition involving the PI3K/Akt/mTOR-mediated pathway in human pancreatic cancer cells. Drug Des Devel Ther. 2015;9:537-60.
- Lai L, et al. Plumbagin inhibits tumour angiogenesis and tumour growth through the Ras signalling pathway following activation of the VEGF receptor-2. Br J Pharmacol. 2012;165(4b):1084-96.
- Wu WI, et al. Crystal structure of human AKT1 with an allosteric inhibitor reveals a new mode of kinase inhibition. PLoS One. 2010;5(9):e12913.
- Bai L, et al. A potent and selective small-molecule degrader of STAT3 achieves complete tumor regression in vivo. Cancer Cell. 2019;36(5):498-511.e17.
- Fanning SW, et al. The SERM/SERD bazedoxifene disrupts ESR1 helix 12 to overcome acquired hormone resistance in breast cancer cells. Elife. 2018;7:e37161.
- Suraweera CD, Caria S, Järvå M, Hinds MG, Kvansakul M. A structural investigation of NRZ-mediated apoptosis regulation in zebrafish. Cell Death Dis. 2018;9(10):967.
- Boulanger MJ, Chow DC, Brevnova EE, Garcia KC. Hexameric structure and assembly of the interleukin-6/IL-6 α-receptor/gp130 complex. Science. 2003;300(5628):2101-4.
- Jia Y, et al. Overcoming EGFR(T790M) and EGFR(C797S) resistance with mutant-selective allosteric inhibitors. Nature. 2016;534(7605):129-32.
- Dos Santos Nascimento IJ, da Silva-Júnior EF. TNF-α inhibitors from natural compounds: an overview, CADD approaches, and their exploration as anti-inflammatory agents. Comb Chem High Throughput Screen. 2022;25(14):2317-40.
- Chaikuad A, et al. A unique inhibitor binding site in ERK1/2 is associated with slow binding kinetics. Nat Chem Biol. 2014;10(10):853-60.
- Brasca MG, et al. Discovery of NMS-E973 as a novel, selective, and potent inhibitor of heat shock protein 90. Bioorg Med Chem. 2013;21(22):7047-63.
- Gurbani D, et al. Structure and characterization of a covalent inhibitor of Src kinase. Front Mol Biosci. 2020;7:81.
- Gellrich L, et al. L-thyroxin and the nonclassical thyroid hormone TETRAC are potent activators of PPARγ. J Med Chem. 2020;63(13):6727-40.
- Weng Z, Shen X, Zheng J, Liang H, Liu Y. Structural basis of DEPTOR to recognize phosphatidic acid using its tandem DEP domains. J Mol Biol. 2021;433(13):166989.
- Huck JD, et al. Structures of Hsp90α and Hsp90β bound to a purine-scaffold inhibitor reveal an exploitable residue for drug selectivity. Proteins. 2019;87(10):869-77.
- Luo G, et al. Discovery of isonicotinamides as highly selective, brain-penetrable, and orally active glycogen synthase kinase-3 inhibitors. J Med Chem. 2016;59(3):1041-51.
- Orlando BJ, Malkowski MG. Crystal structure of rofecoxib bound to human cyclooxygenase-2. Acta Crystallogr F Struct Biol Commun. 2016;72(Pt 10):772-6.
- Nuti E, et al. Development of thioaryl-based matrix metalloproteinase-12 inhibitors with alternative zinc-binding groups: synthesis, potentiometric, NMR, and crystallographic studies. J Med Chem. 2018;61(10):4421-35.
- Li Q, Li Z, Luo T, Shi H. Targeting the PI3K/AKT/mTOR and RAF/MEK/ERK pathways for cancer therapy. Mol Biomed. 2022;3(1):47.
- Wang B, et al. Propofol protects against hydrogen peroxide-induced injury in cardiac H9c2 cells via Akt activation and Bcl-2 up-regulation. Biochem Biophys Res Commun. 2009;389(1):105-11.
- Majewska E, Szeliga M. AKT/GSK3β signaling in glioblastoma. Neurochem Res. 2017;42(3):918-24.
- Yang H, et al. mTOR kinase structure, mechanism, and regulation. Nature. 2013;497(7448):217-23.
- Fong CJ, Sherwood ER, Mendelsohn J, Lee C, Kozlowski JM. Epidermal growth factor receptor monoclonal antibody inhibits constitutive receptor phosphorylation, reduces autonomous growth, and sensitizes androgen-independent prostatic carcinoma cells to tumor necrosis factor α. Cancer Res. 1992;52(21):5887-92.
- Visakorpi T, Kallioniemi OP, Koivula T, Harvey J, Isola J. Expression of epidermal growth factor receptor and ERBB2 (HER-2/Neu) oncoprotein in prostatic carcinomas. Mod Pathol. 1992;5(6):643-8.
- Ibrahim GK, et al. Differential immunoreactivity of epidermal growth factor receptor in benign, dysplastic, and malignant prostatic tissues. J Urol. 1993;149(1):170-3.
- Davies P, Eaton CL. Binding of epidermal growth factor by human normal, hypertrophic, and carcinomatous prostate. Prostate. 1989;14(2):123-32.
- Bahar ME, Kim HJ, Kim DR. Targeting the RAS/RAF/MAPK pathway for cancer therapy: from mechanism to clinical studies. Signal Transduct Target Ther. 2023;8(1):455.
- Guo YJ, et al. ERK/MAPK signalling pathway and tumorigenesis. Exp Ther Med. 2020;19(3):1997-2007.
- Ullah R, Yin Q, Snell AH, Wan L. RAF-MEK-ERK pathway in cancer evolution and treatment. Semin Cancer Biol. 2022;85:123-54.
- Chambard JC, Lefloch R, Pouysségur J, Lenormand P. ERK implication in cell cycle regulation. Biochim Biophys Acta. 2007;1773(8):1299-310.
- Gesmundo I, et al. Proton pump inhibitors promote the growth of androgen-sensitive prostate cancer cells through ErbB2, ERK1/2, PI3K/Akt, GSK-3β signaling and inhibition of cellular prostatic acid phosphatase. Cancer Lett. 2019;449:252-62.
- Schopf FH, Biebl MM, Buchner J. The HSP90 chaperone machinery. Nat Rev Mol Cell Biol. 2017;18(6):345-60.
- García-Alonso S, et al. Structure of the RAF1-HSP90-CDC37 complex reveals the basis of RAF1 regulation. Mol Cell. 2022;82(18):3438-52.e8.
- Chiosis G, Digwal CS, Trepel JB, Neckers L. Structural and functional complexity of HSP90 in cellular homeostasis and disease. Nat Rev Mol Cell Biol. 2023;24(11):797-815.
- Li J, Buchner J. Structure, function, and regulation of the Hsp90 machinery. Biomed J. 2013;36(3):106-17.
- Youssef ME, et al. Role of ganetespib, an HSP90 inhibitor, in cancer therapy: from molecular mechanisms to clinical practice. Int J Mol Sci. 2023;24(5):5014.
- Solit DB, Scher HI, Rosen N. Hsp90 as a therapeutic target in prostate cancer. Semin Oncol. 2003;30(5):709-16.
- Hoter A, Rizk S, Naim HY. The multiple roles and therapeutic potential of molecular chaperones in prostate cancer. Cancers (Basel). 2019;11(8):1194.
- Moon SJ, et al. Bruceantin targets HSP90 to overcome resistance to hormone therapy in castration-resistant prostate cancer. Theranostics. 2021;11(2):958-73.
- Li J, et al. Androgen-targeted hsa_circ_0085121 encodes a novel protein and improves the development of prostate cancer through facilitating the activity of the PI3K/Akt/mTOR pathway and enhancing AR-V7 alternative splicing. Cell Death Dis. 2024;15(11):848.
- Taneja SS, et al. Toremifene: a promising therapy for the prevention of prostate cancer and complications of androgen deprivation therapy. Expert Opin Investig Drugs. 2006;15(3):293-305.
- Yang J, et al. Protective effect of Fuzi Lizhong decoction against non-alcoholic fatty liver disease via an anti-inflammatory response through regulation of p53 and PPARG signaling. Biol Pharm Bull. 2020;43(11):1626-33.
- Sui Q, et al. Ganoderic acid A: an in-depth review of pharmacological effects and molecular docking analysis. J Ethnopharmacol. 2025;349:119868.
- Zhang T, et al. PPARG is a potential target of Tanshinone IIA in prostate cancer treatment: a combination study of molecular docking and dynamic simulation based on transcriptomic bioinformatics. Eur J Med Res. 2023;28(1):487.
- Astakhova A, et al. Inhibitors of oxidative phosphorylation modulate astrocyte inflammatory responses through AMPK-dependent Ptgs2 mRNA stabilization. Cells. 2019;8(10):1185.
- Liu Y, Cai Y, He C, Chen M, Li H. Anticancer properties and pharmaceutical applications of plumbagin: a review. Am J Chin Med. 2017;45(3):423-41.
- Ahmad I, et al. Synergistic inhibition of colon cancer cell proliferation via p53, Bax, and Bcl-2 modulation by curcumin and plumbagin combination. ACS Omega. 2025;10(18):19045-60.
- Bello IJ, Oyebode OT, Olanlokun JO, Omodara TO, Olorunsogo OO. Plumbagin induces testicular damage via mitochondrial-dependent cell death. Chem Biol Interact. 2021;347:109582.
- Hafeez BB, et al. Plumbagin inhibits prostate carcinogenesis in intact and castrated PTEN knockout mice via targeting PKCε, Stat3, and epithelial-to-mesenchymal transition markers. Cancer Prev Res (Phila). 2015;8(5):375-86.
- Kumar MR, et al. Formulation of plumbagin-loaded long-circulating pegylated liposomes: in vivo evaluation in C57BL/6J mice bearing B16F1 melanoma. Drug Deliv. 2011;18(7):511-22.
- Mandala Rayabandla SK, et al. Preparation, in vitro characterization, pharmacokinetic, and pharmacodynamic evaluation of chitosan-based plumbagin microspheres in mice bearing B16F1 melanoma. Drug Deliv. 2010;17(3):103-13.
- Tiwari SB, Pai RM, Udupa N. Temperature-sensitive liposomes of plumbagin: characterization and in vivo evaluation in mice bearing melanoma B16F1. J Drug Target. 2002;10(8):585-91.
- Onoue S, Yamada S, Chan HK. Nanodrugs: pharmacokinetics and safety. Int J Nanomedicine. 2014;9:1025-37.