This study estimated stomach cancer medical costs by nutritional status in 1,102 patients. Half were at nutritional risk. Materials, medications, and examinations were the main cost drivers. Medication cost proportions declined more in well-nourished patients, although the between-group difference was not formally tested.
Research Article
Evaluation of Hospitalization Costs by Preoperative Nutritional Status Among Stomach Cancer Patients: A Retrospective Study in China
In This Article
Summary
Abstract
Stomach cancer (SC) is the third leading cause of cancer-related death in China, imposing a substantial burden on the healthcare system. Nutritional risk is common among patients with SC, yet evidence on associated medical costs and their composition remains limited in China. This retrospective observational study estimated SC-related medical costs and cost composition by preoperative nutritional status. Medical treatment costs were obtained for inpatients aged ≥18 years who were primarily diagnosed with SC and underwent surgical treatment between 2020 and 2023 at a tertiary hospital in Ningbo, China. Preoperative nutritional status was assessed using Nutrition Risk Screening 2002, classifying patients as at nutritional risk or well-nourished. Total treatment costs were categorized into five components: examination, surgery, medication, material, and hospital service costs. All costs were converted to 2020 Chinese yuan. Among 1,102 patients, 69.51% were male, 69.06% had stage I–II disease, and 50.18% were at nutritional risk. Materials, medications, and examinations accounted for 70%–75% of total costs, depending on year and nutritional status. From 2020 to 2023, the proportions of examination, surgery, and hospital service costs increased, while material costs declined at comparable rates in both groups. Medication cost proportions decreased in both groups; descriptively, the annual decrease was larger among well-nourished patients (-2.85% vs. -0.96%), although this between-group difference was not formally tested. In conclusion, SC-related medical costs varied across preoperative nutritional statuses. Subsidies for essential medications and medical materials may be considered to reduce the economic burden of SC treatment. The economic implications of nutritional support should be further evaluated in future studies with detailed information on nutritional interventions and their costs.
Introduction
Stomach cancer (SC), also known as gastric cancer, is a major global public health challenge, ranking as the fifth most prevalent cancer and the fifth leading cause of cancer-related death1. Although incidence and mortality rates have steadily declined since the 1980s, the numbers of cases and deaths are expected to increase because of global population aging, with 0.97 million new cases and 0.66 million deaths reported in 20201⁻3. The economic consequences of SC are also substantial. Global welfare losses attributable to SC were estimated at $2,470.34 billion in 2021, equivalent to 1.62% of global gross domestic product4. Eastern Asia was estimated to bear the largest welfare losses, with China carrying the highest burden at the national level4.
In China, SC is the third leading cause of cancer-related death, with 0.36 million new cases and 0.23 million deaths reported in 20225. Although the incidence and mortality rates in China are not the highest globally, the country has the highest absolute numbers of incident cases, deaths, and disability-adjusted life years (DALYs), given its large aging population6. Medical expenditures for SC treatment between 2012 and 2014 averaged $9,899 per patient, creating an unmanageable financial burden for 79.20% of affected families7. To address this economic burden and optimize medical resource allocation, the Chinese government has implemented multiple rounds of reforms to the diagnosis-related group (DRG) payment system to reduce unnecessary medical expenditures for patients with cancer8˒9. In Ningbo, the reform was implemented in 2021. These changes necessitate a detailed understanding of SC-related medical costs and their composition.
Preoperative nutritional status is an important factor in analyses of SC-related medical costs. Poor nutritional status is common among patients with SC, with estimates suggesting that 30%–80% become malnourished during the course of the disease, depending on tumor stage and the method used to assess nutritional status10⁻12. Poor nutritional status is associated with lower quality of life13, poorer prognosis13˒14, increased complications15, prolonged hospitalization16, and higher mortality risk17. Beyond these clinical consequences, a growing body of literature has examined the economic implications of nutritional risk and nutritional interventions. In China, higher Nutrition Risk Screening 2002 (NRS-2002) scores have been associated with greater hospital costs among older inpatients18, although that analysis did not specifically focus on patients with SC or separate costs into detailed subcategories. A Swiss study provided evidence that nutritional support reduced medical costs among patients with cancer at nutritional risk19, while another Chinese study documented the benefits of oral nutritional supplements in improving patient outcomes and preventing excess healthcare costs20. These studies have established links between nutritional status, nutritional interventions, and medical costs among patients with cancer. However, evidence remains limited regarding the composition of SC-related medical costs, including medication, material, and surgery costs, and how these costs differ across preoperative nutritional statuses. Year-by-year analyses of these cost compositions over recent periods are also limited. Such information may support nutritional status-stratified treatment strategies and the integration of routine nutritional support into cancer care.
The present study estimates medical costs among SC inpatients across five categories: hospital services, examinations, surgery, medications, and materials. It also examines whether associations between patient characteristics and these costs differ according to preoperative nutritional status. Retrospective data from a tertiary hospital in Ningbo, China, between 2020 and 2023 were analyzed, with preoperative nutritional status classified using NRS-2002. The study site is located in eastern coastal China, where SC incidence and mortality are higher than in most other regions21, and SC risk factors, including smoking, excessive salt consumption, and Helicobacter pylori infection, are prominent among local residents22–24.
Protocol
This retrospective observational study used pooled data from Ningbo No.2 Hospital, Ningbo, Zhejiang Province, China. Ethical approval was obtained from the Ethics Committee of Ningbo No.2 Hospital (No. PJ-NBEY-KY-2025-033-01). Given the retrospective observational design and the use of anonymized data that posed no risk to participants, the requirement for informed consent was waived in accordance with Article 39 of the Ethical Guidelines for Biomedical Research Involving Human Subjects issued by the National Health Commission of the People’s Republic of China.
1. Inclusion criteria of patients
Patients were eligible for inclusion if they had a primary diagnosis of SC, were hospitalized and treated surgically between January 1, 2020, and December 31, 2023, were 18 years of age or older at inclusion, and had available data on age, sex, tumor site, cancer stage, preoperative nutritional status, and SC-related medical costs during hospitalization.
2. Patient enrollment and flow
A total of 1,337 inpatients were diagnosed with SC between 2020 and 2023. Of these, 203 patients (15.2%) were excluded because of missing tumor stage data, and 32 patients (2.4%) were excluded because of missing tumor site data. The final analysis included 1,102 patients. As this retrospective study included all eligible patients during the study period, no a priori sample size calculation was performed (Figure 1).
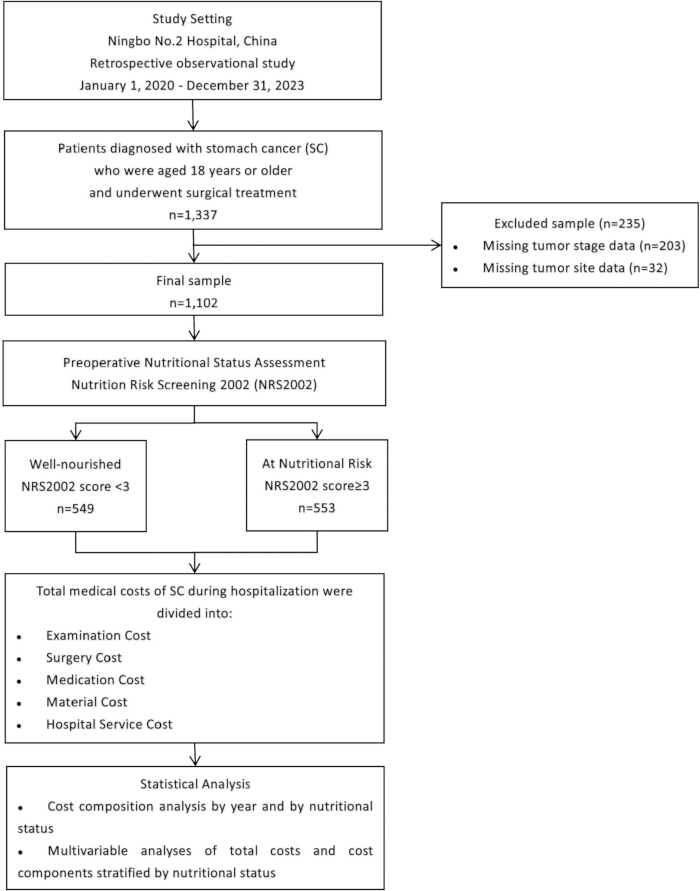
Figure 1: Flow diagram of the study design and patient inclusion. The diagram summarizes the study setting and period; the identification of 1,337 patients with stomach cancer; the exclusion of patients with missing tumor stage or tumor site data; and the inclusion of 1,102 patients in the final analysis. Patients were classified as well-nourished (NRS-2002 score < 3) or at nutritional risk (NRS-2002 score ≥ 3), followed by analyses of medical cost composition and factors associated with hospitalization costs. Please click here to view a larger version of this figure.
3. Preoperative nutritional status assessment
Preoperative nutritional status was assessed using the Nutrition Risk Screening 2002 (NRS-2002) framework25. Patients were classified as either well-nourished (NRS-2002 score < 3) or at nutritional risk (NRS-2002 score ≥ 3)26. The at-nutritional-risk group included patients who were at risk of malnutrition or were malnourished and for whom nutritional support was recommended.
4. Clinical characteristics and demographics
Patients were categorized into four cancer stage groups (I, II, III, and IV) according to the American Joint Committee on Cancer (AJCC) TNM system27. Based on the primary tumor site, patients were categorized into four groups: upper part (cardia and fundus), middle part (body), lower part (antrum and pylorus), and multicentric (two or more distinct tumors within the stomach)28. Age at diagnosis was categorized as older age (≥70 years) or non-older age (< 70 years). Patients were also stratified according to the presence or absence of hypertension, diabetes, and heart disease.
5. Stomach cancer medical costs
Total SC medical costs refer to the total inpatient medical expenses incurred during hospitalization. These costs were separated into five categories: material, medication, surgery, examination, and hospital service costs. The categories were mutually exclusive, and each expenditure item was assigned to only one category. The sum of the five subcategory costs for each patient equaled that patient's total medical cost.
Material costs included disposable medical supplies used for patient care, surgical procedures, and other treatments during hospitalization, including bandages, syringes, needles, and surgical instruments. Medication costs comprised the aggregate expenses for all drugs administered during hospitalization, including prescription and over-the-counter drugs delivered orally, intravenously, or by other routes. Nutritional interventions for patients with poor nutritional status, including nutritional supplements, enteral nutrition, and parenteral nutrition, were also included in medication costs.
Surgery costs included surgeon fees, anesthesia fees, and surgical facility charges. Examination costs included expenses for diagnostic and evaluative procedures performed during hospitalization, such as physical, endoscopic, imaging, and laboratory examinations. Hospital service costs included expenses for consultations, nursing services, rehabilitation services, hospital accommodation, and blood transfusions.
To ensure comparability of medical costs across years, all costs were reported in 2020 Chinese yuan (CNY) and deflated using the year-specific Consumer Price Index (CPI) of China. The general CPI was used because the cost categories in the hospital’s medical records system included both material- and service-related expenditures and could not be further disaggregated to apply separate healthcare-specific price indices.
6. Statistical analysis
- Descriptive statistics
The proportional breakdown of SC-related medical costs was estimated separately according to preoperative nutritional status. Continuous variables, including SC-related medical costs, were reported as medians with interquartile ranges (25th–75th percentiles). Categorical variables, including sex, age group, preoperative nutritional status, and cancer stage, were presented as frequencies and percentages.
Temporal trends in the proportions of the different cost categories relative to total costs were also described. For each nutritional status group and year, the proportion of each cost category was calculated by dividing the category's aggregated expenditure by the total aggregated medical expenditure. Changes in these proportions over time were evaluated descriptively. - Normality testing and comparative analysis
Normality of the cost data was assessed using the Shapiro-Wilk test and visual inspection of histograms. Because the cost data were non-normally distributed, nonparametric tests were used for group comparisons. The Kruskal-Wallis test was used to compare costs across groups, and the chi-square test was used to assess differences in categorical sociodemographic and clinical variables.
Multivariable generalized linear model (GLM) regressions with a Gaussian family and identity link were conducted to examine associations between SC-related costs and patient characteristics, stratified by preoperative nutritional status. As a supplementary analysis, pooled multivariable GLM regressions with the same family and link function were conducted to examine associations between preoperative nutritional status and total SC-related medical costs, adjusting for age, sex, tumor stage, tumor site, comorbidities, and year.
Costs were log-transformed for the regression analyses, and robust standard errors were used to mitigate heteroskedasticity. Year was controlled for in the regression models to account for potential temporal trends. Variance inflation factors were calculated to assess potential multicollinearity. All statistical tests were two-sided, and a p-value < 0.05 was considered statistically significant. Statistical analyses were performed using Stata 17.0 (2021).
Results
Patient characteristics and stomach cancer medical costs
Among the 1,102 patients, 69.51% were male (Table 1). The sample was evenly divided between the older and non-older age groups (50.00% each), with a significant decrease in the proportion of older patients from 2020–2023 (p = 0.011). Overall, 50.18% of patients were classified as being at nutritional risk, with the highest prevalence observed in 2021 (58.47%).
The lower part of the stomach was the most common tumor site (58.89%), followed by the middle part (28.13%). Most patients were diagnosed at earlier stages, with stage I (46.28%) and stage II (22.78%) accounting for more than 70% of the total sample. The prevalence of hypertension, heart disease, and diabetes was 38.84%, 2.99%, and 15.52%, respectively, with no significant yearly differences except for hypertension (p = 0.050).
The median total medical cost of SC treatment differed significantly across years (p < 0.001), increasing from ¥46,296.50 in 2020 to a peak of ¥50,595.14 in 2021 before declining to ¥45,732.30 in 2023. The individual cost categories also differed significantly across years (p < 0.001). Material costs represented the largest expenditure, with a median of ¥17,834.57, followed by medication costs and examination costs, with medians of ¥9,416.06 and ¥7,696.32, respectively.
Table 1: Characteristics and medical expenditures of stomach cancer patients by year. Values are expressed as frequency (%) or median [interquartile range, 25th–75th percentiles]. Costs are measured in 2020 CNY (¥). Comparisons between years were performed using the chi-square test for categorical variables and the Kruskal-Wallis test for continuous variables. Results are presented as p-values. Please click here to download this Table.
Cost composition by preoperative nutritional status from 2020 to 2023
Figure 2 presents the proportional breakdown of SC-related medical costs stratified by preoperative nutritional status. Table 2 presents changes in the proportions of different SC medical cost categories from 2020–2023. Material, medication, and examination costs collectively accounted for more than 70% of total costs in both well-nourished patients and patients at nutritional risk throughout the study period.
From 2020–2023, the proportions of medication and material costs declined in both groups. The annual decline in the proportion of medication costs was −2.85% among well-nourished patients and −0.96% among patients at nutritional risk. In contrast, the proportions of surgery and examination costs increased in both groups. The proportion of antibiotic costs in total medication costs also increased in both groups, with average annual growth rates of 7.33% among patients at nutritional risk and 6.83% among well-nourished patients. However, these between-group differences in annual changes were descriptive and were not formally tested.
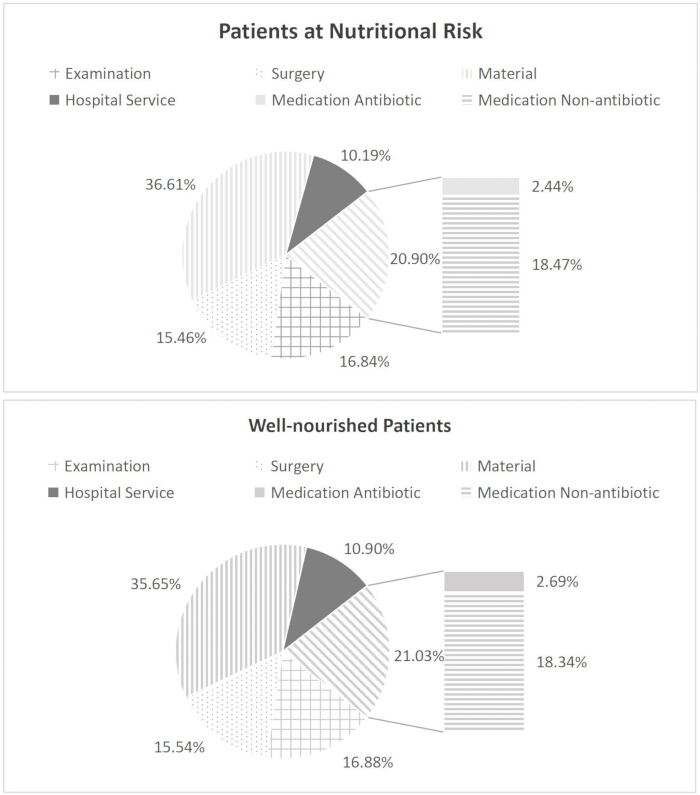
Figure 2: Proportional composition of stomach cancer-related medical costs by preoperative nutritional status. The figure shows the percentage contribution of material, medication, surgery, examination, and hospital service costs to total medical costs in well-nourished patients and patients at nutritional risk. Medication costs include antibiotic and non-antibiotic costs. Please click here to view a larger version of this figure.
Table 2: Composition of medical costs for stomach cancer by preoperative nutritional status from 2020–2023. Total medical costs were divided into five categories: material, medication, surgery, examination, and hospital service costs. Medication costs include antibiotic and non-antibiotic costs. Please click here to download this Table.
Factors associated with hospitalization costs by preoperative nutritional status
Table 3 presents the multivariable analysis results. SC-related medical costs increased significantly with age and tumor stage, particularly among patients at nutritional risk. Among patients at nutritional risk, hypertension was associated with higher medication and hospital service costs. Middle-part and multicentric tumors were associated with higher medication costs than upper-part tumors.
Among well-nourished patients, diabetes was associated with higher examination costs, while heart disease was associated with higher examination and hospital service costs. Upper-part tumors were associated with higher surgery and material costs than other tumor sites.
Table 3: Associations between stomach cancer costs and patient characteristics by cost category and preoperative nutritional status. Costs were measured in 2020 CNY (¥) and were log-transformed. Regression analyses were conducted using generalized linear models (GLMs), and results are presented as estimates (95% CI). Robust standard errors were used to address heteroskedasticity. Year was controlled for in the models. The variance inflation factor (VIF) for the regression models was 2.43. Total medical costs were divided into five categories: material, medication, surgery, examination, and hospital service costs. ap < 0.05; bp < 0.01. Please click here to download this Table.
Supplementary analysis
Supplementary Table 1 presents the association between preoperative nutritional status and SC-related medical costs. After adjustment for patient characteristics and year, nutritional risk was not significantly associated with total medical costs or most cost categories, except for a significant negative association with hospital service costs.
To assess potential selection bias due to missing clinical information, the available characteristics of patients included in the analysis and those excluded were compared (Supplementary Table 2). No significant differences were observed in sex, age group, hypertension, or heart disease, whereas the included patients had higher proportions of nutritional risk and diabetes.
DATA AVAILABILITY:
The de-identified data underlying the analysis reported in this study are provided as supplementary files. Supplementary Table 3 contains the patient-level data used to generate Tables 1–3, Figure 2, and Supplementary Table 1, while Supplementary Table 4 contains the data used to generate Supplementary Table 2.
Supplementary Table 1: Associations between stomach cancer costs and preoperative nutritional status. Costs were measured in 2020 CNY (¥) and were log-transformed. Regression analyses were conducted using generalized linear models (GLMs), and results are presented as estimates (95% CI). Robust standard errors were used to address heteroskedasticity. Year was controlled for in the models. The variance inflation factor (VIF) for the regression models was 2.40. Total medical costs were divided into five categories: material, medication, surgery, examination, and hospital service costs. ap < 0.05; bp < 0.01. Please click here to download this file.
Supplementary Table 2: Comparison of characteristics between patients included in and excluded from the analysis. Patient characteristics are presented as frequency (%). Comparisons between included and excluded patients were performed using the chi-square test. Characteristics compared included sex, age group, preoperative nutritional status, hypertension, diabetes, and heart disease. Results are presented as p-values. Please click here to download this file.
Supplementary Table 3: De-identified patient-level dataset used for the main analyses. This de-identified dataset contains the patient-level demographic, clinical, nutritional-status, and medical cost variables used to generate Tables 1–3, Figure 2, and Supplementary Table 1. All direct patient identifiers have been removed. Please click here to download this file.
Supplementary Table 4. De-identified dataset used for the comparison of included and excluded patients. This de-identified dataset contains the available demographic and clinical characteristics of patients included in and excluded from the final analysis and was used to generate Supplementary Table 2. All direct patient identifiers have been removed. Please click here to download this file.
Discussion
SC-related medical costs showed an inverted U-shaped trend from 2020–2023, with median costs peaking in 2021 and declining after the cancellation of COVID-19 control measures in late 2022. One possible explanation is the effect of pandemic prevention and control measures29. The Chinese zero-COVID policy implemented from 2021–2022 required repeated COVID-19 screening, the use of isolation rooms, and additional protective equipment, which may have increased the overall cost of cancer treatment. Disruptions to the supply of drugs and medical materials may also have contributed to higher costs during the pandemic30. As supply chains recovered, medication and material costs decreased in 2023. In contrast, median examination, surgery, and hospital service costs did not decline in the post-pandemic period. The COVID-19 pandemic strained healthcare systems and reduced access to cancer diagnosis and treatment31˒32. Following the cancellation of pandemic control measures, some patients may have presented with more advanced disease, requiring more extensive examinations, more complex surgical treatment, and more intensive hospital services. A higher proportion of stage IV disease was observed in 2023 than from 2020–2022.
Material, medication, and examination costs were the three major cost drivers regardless of preoperative nutritional status, consistent with previous studies in China33˒34. Material costs accounted for a greater proportion of total costs in the present study (32.85%–37.83%) than in a previous study from 2016 (25.20%), whereas medication costs accounted for a smaller proportion (19.75%–22.01%) than reported in studies from 2011 (53.00%) and 2016 (42.70%)33˒34.
These differences may reflect government regulation of the cancer drug market and reforms to the medical insurance system. The relatively high proportion of early-stage patients may also have contributed to the lower medication-cost proportion. Approximately 70% of patients had stage I or II disease, which may partly reflect the gastrointestinal cancer screening program implemented in Zhejiang Province in 201335. From 2020–2023, the medication-cost proportion declined in both nutritional groups. Descriptively, the annual decline was larger among well-nourished patients (-2.85%) than among patients at nutritional risk (-0.96%). Possible explanations include differences in immune function36˒37, wound healing38, postoperative complication risk11˒38, and treatment patterns. Postoperative nutritional support is routinely provided after SC surgery in many Chinese hospitals, whereas preoperative nutritional interventions are more commonly administered to patients identified as being at nutritional risk39˒40. Differences in treatment strategies may therefore contribute to the observed patterns in medication-cost composition. The proportion of antibiotic costs in total medication costs also increased in both nutritional groups, with annual growth rates of 7.33% among patients at nutritional risk and 6.83% among well-nourished patients.
Associations between patient characteristics and SC-related medical costs also differed by preoperative nutritional status. Medical costs generally increased with age at diagnosis and tumor stage, consistent with previous literature33˒34. This pattern was more pronounced among patients at nutritional risk, who may have greater risks of postoperative complications and lower treatment tolerance41˒42. Hypertension was associated with higher medication and hospital service costs in the at-nutritional-risk group. Poor nutritional status has been associated with impaired cardiovascular homeostasis and metabolic changes that may contribute to blood pressure dysfunction43. Heart disease and diabetes were associated with higher examination and hospital service costs among well-nourished patients. Tumor location was also associated with differences in cost categories. Among patients at nutritional risk, middle-part and multicentric tumors were associated with higher medication costs. Such tumors may require total or subtotal gastrectomy44˒45, and patients with poor nutritional status undergoing extensive surgery may be more vulnerable to postoperative infections and complications46. Among well-nourished patients, upper-part tumors were associated with higher surgery and material costs than other tumor sites. Upper gastric tumors can present greater technical difficulty during surgery47, potentially requiring longer operative time and greater use of surgical materials.
Several implications arise for the management of SC and allocation of medical resources, particularly in Zhejiang Province and other eastern regions of China. Because materials, medications, and examinations were the major cost drivers, broader coverage of essential medical materials and drugs within centralized procurement systems and targeted subsidies for anti-infection and anti-complication medications and surgical and examination materials may help reduce the economic burden of SC treatment. Given the observed heterogeneity in cost composition across nutritional statuses, future diagnosis-related group payment reforms may consider nutritional status as a stratifying factor. However, item-level medication cost data are needed to determine how nutritional status and nutritional interventions influence SC-related medical costs before such policy approaches can be fully evaluated. Routine nutritional screening and support may also facilitate treatment strategies tailored to nutritional status, although further research is needed to determine the economic implications of nutritional support. The present findings extend two related areas of previous research. Earlier studies of the economic burden of SC in China either did not examine the proportional breakdown of costs7 or relied on data from the 2000s and 2010s33˒34. In addition, previous studies have examined associations between nutritional risk and hospital costs, as well as the clinical and economic implications of nutritional interventions18–20. The present analysis adds cost-category and nutritional-status stratification using recent clinical data and complements previous work on nutritional interventions in gastrointestinal cancer40.
Several limitations should be considered. First, postoperative nutritional status was not available. Nutritional status may deteriorate after surgery, and postoperative changes may be associated with adverse outcomes, including surgical site infections and delayed recovery, that may increase medical costs. Analyses based only on preoperative NRS-2002 scores may therefore underestimate the overall impact of nutritional risk on costs. Second, outpatient costs, including radiotherapy and chemotherapy, and indirect costs, including home nutritional support, hired nursing, and income loss, were not included. Third, the study was conducted at a single tertiary hospital in Ningbo, eastern China, which may limit generalizability. Differences in healthcare resources, medical insurance policies, and patient characteristics between eastern and western regions, or between urban and rural areas, may affect applicability, particularly because the high proportion of stage I–II patients may partly reflect the Zhejiang gastrointestinal cancer screening program. Fourth, nutritional intervention expenses were included in medication costs, but the medical record system provided only aggregated medication costs, without item-level details. Nutritional-support costs could therefore not be separately quantified or evaluated within nutritional-status groups. Selection bias resulting from the exclusion of patients with missing tumor stage or tumor site information also cannot be ruled out.
Future studies may address these limitations through multicenter designs that incorporate broader cost categories, detailed socioeconomic information, longitudinal assessments of preoperative and postoperative nutritional status, and item-level costs for medications and nutritional support. A four-cell stratification based on nutritional status and nutritional-intervention intensity could help distinguish the biological and clinical effects of malnutrition from the treatment-pattern effects of nutritional support. Longer observation periods covering sufficient pre-, during-, and post-COVID periods may also allow evaluation of the potential differential impact of the pandemic on SC-related medical costs across nutritional statuses. In conclusion, SC-related medical costs varied across preoperative nutritional statuses. Subsidies for essential medications and medical materials may be considered to reduce the economic burden of SC treatment. The potential role of nutrition-status-stratified treatment strategies and routine nutritional support in reducing costs should be evaluated in future studies that provide detailed information on nutritional interventions and their associated costs.
Disclosures
The authors declare no conflicts of interest.
AUTHOR CONTRIBUTION:
Zeng-Bao Hu contributed to the original drafting of the manuscript, methodology, formal analysis, and visualization. Hao-Xun Mao contributed to manuscript review and editing, and project administration. Stuart McDonald contributed to manuscript review, editing, and supervision. Hua Yu contributed to manuscript review and editing, conceptualization, methodology, supervision, data curation, and project administration. Yi Lin contributed to manuscript review and editing, conceptualization, methodology, and supervision. All authors reviewed and approved the final manuscript
Acknowledgements
Ningbo No.2 Hospital is acknowledged for providing the data.
Materials
| Name | Company | Catalog Number | Comments |
|---|---|---|---|
| Nutrition Risk Screening 2002 (NRS-2002) | N/A | N/A | Used to assess preoperative nutritional status and classify patients as well-nourished (score <3) or at nutritional risk (score ≥3) |
| Stata Statistical Software | StataCorp LLC, College Station, TX, USA | Release 17 | Used for statistical analysis |
References
- Bray F et al. Global cancer statistics 2022: GLOBOCAN estimates of incidence and mortality worldwide for 36 cancers in 185 countries. CA Cancer J Clin. 2024;74(3):229–263. https://doi.org/10.3322/caac.21834
- Wong MC et al. Global incidence and mortality of gastric cancer, 1980–2018. JAMA Netw Open. 2021;4(7):e2118457. https://doi.org/10.1001/jamanetworkopen.2021.18457
- Lin JL et al. Global incidence and mortality trends of gastric cancer and predicted mortality of gastric cancer by 2035. BMC Public Health. 2024;24(1):1763. https://doi.org/10.1186/s12889-024-19104-6
- Zhu H et al. Global welfare based economic burden of gastric cancer and projections to 2050. iScience. 2026. https://doi.org/10.1016/j.isci.2026.115414
- Han B et al. Cancer incidence and mortality in China, 2022. J Natl Cancer Cent. 2024;4(1):47–53. https://doi.org/10.1016/j.jncc.2024.01.006
- Song Y et al. The global, regional and national burden of stomach cancer and its attributable risk factors from 1990 to 2019. Sci Rep. 2022;12(1):11542. https://doi.org/10.1038/s41598-022-15839-7
- Zhang K et al. Expenditure and financial burden for stomach cancer diagnosis and treatment in China: a multicenter study. Front Public Health. 2020;8:310. https://doi.org/10.3389/fpubh.2020.00310
- Zheng X et al. Impact of Diagnosis-Related Groups (DRG) reform on cost homogeneity of treatment for patients with malignant tumours. Sci Rep. 2024;14(1):21212. https://doi.org/10.1038/s41598-024-71917-y
- Luo M et al. The impact of DRG payment reform on inpatient costs for different surgery types: an empirical analysis based on Chinese tertiary hospitals. Front Public Health. 2025;13:1563204. https://doi.org/10.3389/fpubh.2025.1563204
- Gavazzi C et al. Importance of early nutritional screening in patients with gastric cancer. Br J Nutr. 2011;106(12):1773–1778. https://doi.org/10.1017/S0007114511002509
- Rosania R, Chiapponi C, Malfertheiner P, Venerito M. Nutrition in patients with gastric cancer: an update. Gastrointest Tumors. 2016;2(4):178–187. https://doi.org/10.1159/000445188
- Seo SH et al. Association of nutritional status-related indices and chemotherapy-induced adverse events in gastric cancer patients. BMC Cancer. 2016;16:1–9. https://doi.org/10.1186/s12885-016-2934-5
- Mizukami T, Piao Y. Role of nutritional care and general guidance for patients with advanced or metastatic gastric cancer. Future Oncol. 2021;17(23):3101–3109. https://doi.org/10.2217/fon-2021-0186
- Yin J, Qu J, Liang X, Wang M. Prognostic significance of controlling nutritional status score for patients with gastric cancer: a systematic review and meta-analysis. Exp Ther Med. 2023;25(5):202. https://doi.org/10.3892/etm.2023.11901
- Jiang N et al. Prognostic nutritional index predicts postoperative complications and long-term outcomes of gastric cancer. World J Gastroenterol. 2014;20(30):10537. https://doi.org/10.3748/wjg.v20.i30.10537
- Guo W et al. Screening of the nutritional risk of patients with gastric carcinoma before operation by NRS 2002 and its relationship with postoperative results. J Gastroenterol Hepatol. 2010;25(4):800–803. https://doi.org/10.1111/j.1440-1746.2009.06198.x
- Da Li Q et al. Nutrition deficiency increases the risk of stomach cancer mortality. BMC Cancer. 2012;12:1–12. https://doi.org/10.1186/1471-2407-12-315
- Liu H et al. Nutritional risk, health outcomes, and hospital costs among Chinese immobile older inpatients: a national study. Front Nutr. 2021;8:758657. https://doi.org/10.3389/fnut.2021.758657
- Schuetz P et al. Nutritional support during the hospital stay is cost-effective for preventing adverse outcomes in patients with cancer. Front Oncol. 2022;12:916073. https://doi.org/10.3389/fonc.2022.916073
- Shi H et al. Malnourished, gastrointestinal cancer patients undergoing surgery: burden of nutritional risk, use of oral nutritional supplements, and impact on health outcomes. Asia Pac J Clin Nutr. 2025;34(3):325. https://doi.org/10.6133/apjcn.202506_34(3).0007
- Zheng R et al. Cancer incidence and mortality in China, 2016. J Natl Cancer Cent. 2022;2(1):1–9. https://doi.org/10.1016/j.jncc.2022.02.002
- Tao Z et al. The impact of health literacy on smoking patterns among male residents: insights from Ningbo City. Front Public Health. 2025;13:1487400. https://doi.org/10.3389/fpubh.2025.1487400
- Lin Y, Mei Q, Qian X, He T. Salt consumption and the risk of chronic diseases among Chinese adults in Ningbo city. Nutr J. 2020;19(1):9. https://doi.org/10.1186/s12937-020-0521-8
- Zhang Y et al. High prevalence of Helicobacter pylori mixed infections identified by multilocus sequence typing in Ningbo, China. Front Microbiol. 2023;14:1207878. https://doi.org/10.3389/fmicb.2023.1207878
- Kondrup J et al. Nutritional risk screening (NRS 2002): a new method based on an analysis of controlled clinical trials. Clin Nutr. 2003;22(3):321–336. https://doi.org/10.1016/S0261-5614(02)00214-5
- Bian Y, Xie F, Han J, Ding Y. Nutritional evaluation study based on NRS 2002, OPNI, and their combined use in patients with adverse drug reactions after chemotherapy: a cross-sectional study. Ann Transl Med. 2022;10(4):180. https://doi.org/10.21037/atm-22-256
- Amin MB et al. AJCC Cancer Staging Manual. Springer; New York; 2017.
- Shao X et al. Case report: a rare synchronous multiple gastric carcinoma achieved progression-free disease through NGS-guided serial treatment. Front Oncol. 2023;13:1195837. https://doi.org/10.3389/fonc.2023.1195837
- Vázquez Rosas T et al. Social distancing and economic crisis during COVID-19 pandemic reduced cancer control in Latin America and will result in increased late-stage diagnoses and expense. JCO Glob Oncol. 2021;7:694–703. https://doi.org/10.1200/GO.21.00016
- Forster V. COVID-19 is still causing drug shortages that impact cancer care. Cancer Therapy Advisor. 2022. Available at: https://www.cancertherapyadvisor.com/features/covid19-pandemic-drug-shortages-cancer-care/. Accessed April 8, 2026.
- Boutros M, Moujaess E, Kourie HR. Cancer management during the COVID-19 pandemic: choosing between the devil and the deep blue sea. Crit Rev Oncol Hematol. 2021;167:103273. https://doi.org/10.1016/j.critrevonc.2021.103273
- Hyeda A, da Costa ÉSM, Kowalski SC. The trend and direct costs of screening and chemotherapy treatment of breast cancer in the new coronavirus pandemic: total and interrupted time series study. BMC Health Serv Res. 2022;22(1):1466. https://doi.org/10.1186/s12913-022-08884-5
- Sun XJ et al. Medical expenses of urban Chinese patients with stomach cancer during 2002–2011: a hospital-based multicenter retrospective study. BMC Cancer. 2018;18(1):435. https://doi.org/10.1186/s12885-018-4357-y
- Yang Z et al. Annual cost of illness of stomach and esophageal cancer patients in urban and rural areas in China: a multi-center study. Chin J Cancer Res. 2018;30(4):439. https://doi.org/10.21147/j.issn.1000-9604.2018.04.07
- Wang Y et al. Effectiveness of risk-adapted upper gastrointestinal cancer screening in China: prospective cohort study. JMIR Public Health Surveill. 2024;10(1):e62864. https://doi.org/10.2196/62864
- Valdés-Ramos R, Benítez-Arciniega AD. Nutrition and immunity in cancer. Br J Nutr. 2007;98(S1):S127–S132. https://doi.org/10.1017/S0007114507833009
- Ding D et al. Effects of preoperative and postoperative enteral nutrition on postoperative nutritional status and immune function of gastric cancer patients. Turk J Gastroenterol. 2015;26(2):181–185. https://doi.org/10.5152/tjg.2015.3993
- Ravasco P. Nutrition in cancer patients. J Clin Med. 2019;8(8):1211. https://doi.org/10.3390/jcm8081211
- Liu LH et al. Effect of early stepwise nutrition management on feeding tolerance of postoperative patients with gastric cancer. World J Gastrointest Surg. 2025;17(12):111864. https://doi.org/10.4240/wjgs.v17.i12.111864
- Yu H et al. Effects of postdischarge oral nutrition supplements on body composition, immune status, and inflammatory responses in malnourished patients with gastrointestinal cancer after surgery. Gastrointest Tumors. 2025;13:e005. https://doi.org/10.48130/git-0026-0003
- Giordano G, Terranova R, Mastrantoni L, Landi F. Nutritional challenges in older cancer patients: a narrative review of assessment tools and management strategies. Nutrients. 2025;17(18):2928. https://doi.org/10.3390/nu17182928
- Tsuzuki N et al. Investigating the nutritional status characteristics of terminal cancer patients by the type of cancer. Fujita Med J. 2025;11(3):105–110. https://doi.org/10.20407/fmj.2024-007
- Silva FC, de Menezes RC, Chianca DA Jr. The implication of protein malnutrition on cardiovascular control systems in rats. Front Physiol. 2015;6:246. https://doi.org/10.3389/fphys.2015.00246
- Sakuma T et al. Synchronous multicentric signet ring cell carcinoma of the stomach. Dig Endosc. 2005;17(1):85–88. https://doi.org/10.1111/j.1443-1661.2005.00462.x
- Dinçer B et al. Subtotal versus total gastrectomy for mid- and distal gastric poorly cohesive carcinoma: a retrospective controlled study. Front Oncol. 2025;15:1717678. https://doi.org/10.3389/fonc.2025.1717678
- Kang MK, Lee HJ. Impact of malnutrition and nutritional support after gastrectomy in patients with gastric cancer. Ann Gastroenterol Surg. 2024;8(4):534–552. https://doi.org/10.1002/ags3.12788
- Gong Y et al. Clinicopathological characteristics and prognosis of upper gastric cancer patients in China: a 32-year single-center retrospective clinical study. Gastroenterol Res Pract. 2019;2019(1):9248394. https://doi.org/10.1155/2019/9248394