This protocol describes the enrichment of thyrotropes from hypothyroid adult mouse pituitary glands using enzymatic dissociation and CD90-based fluorescence-activated cell sorting, enabling downstream molecular analyses and short-term primary culture of a thyrotrope-enriched cell population.
A subscription to JoVE is required to view this content. Sign in or start your free trial.
Method Article
Enrichment of Mouse Pituitary Thyrotropes from Hypothyroid Mice Using CD90-Based Fluorescence-Activated Cell Sorting
In This Article
Summary
Abstract
Thyrotropes are specialized endocrine cells in the anterior pituitary gland that secrete thyroid-stimulating hormone (TSH) and regulate thyroid activity. TSH secretion is positively regulated by hypothalamic thyrotropin-releasing hormone and negatively regulated by circulating thyroid hormones. Thyrotropes constitute only a small fraction of pituitary cells (~5%), complicating efforts to isolate and study their physiology. Here, we describe an enhanced approach for isolating thyrotropes from hypothyroid adult mice. Hypothyroidism was induced to expand the thyrotrope population prior to enzymatic dissociation of the anterior pituitary gland and fluorescence-activated cell sorting using the CD90.2 surface antigen. Processing anterior pituitary glands from twelve mice yielded approximately 1.5 × 10⁶ CD90.2-positive cells enriched for Tshb messenger RNA expression. CD90.2-positive cells represented approximately 25% of anterior pituitary cells and exhibited approximately fivefold higher Tshb expression compared with CD90.2-negative cells, indicating substantial thyrotrope enrichment. Isolated cells remained viable in short-term culture and retained responsiveness to triiodothyronine treatment. This protocol enables enrichment and culture of mouse thyrotropes for downstream molecular, transcriptomic, epigenomic, and physiological analyses.
Introduction
The pituitary gland is an endocrine organ located at the base of the brain that exerts hierarchical control over hormonal homeostasis. Its activity is regulated by hypothalamic signals that stimulate or inhibit the production of pituitary hormones, which in turn govern the function of peripheral endocrine organs. The gland contains a heterogeneous and dynamic population of cells, including stem/progenitor cells and differentiated hormone-producing cells1. In response to physiological stress or injury, pituitary stem/progenitor cells can activate, self-renew, and differentiate into multiple hormone-secreting lineages2,3. Structurally, the pituitary is organized into two major lobes: the posterior lobe (PL), composed of pituicytes and neurosecretory terminals that release oxytocin and vasopressin, and the anterior lobe (AL), which contains specialized endocrine cell types secreting growth hormone, prolactin, thyroid-stimulating hormone (TSH), adrenocorticotropic hormone, and the gonadotropins follicle-stimulating hormone (FSH) and luteinizing hormone (LH). The anterior pituitary also harbors nonhormonal cell types, such as S100B-positive folliculostellate cells, endothelial cells, and pericytes, which support endocrine function4,5,6. Rodents additionally contain melanotrophs within the intermediate lobe of the pituitary gland7,8.
Interest in pituitary function, differentiation, and development has driven the development of multiple protocols aimed at isolating adult pituitary stem and progenitor cells in rodent models. Rats are frequently used in pituitary physiology research because their larger pituitary glands yield greater cell numbers and improve recovery during tissue processing4,9. In contrast, isolating pituitary cells from mice remains technically challenging, and standardized protocols are limited. Recent protocols using adult pituitary stem/progenitor cell aggregates provide useful tools for modeling pituitary development and function10; however, these systems do not yet allow direct isolation of specific endocrine cell populations. Among the hormone-producing cell types of the anterior pituitary, thyrotropes are the principal regulators of the hypothalamic–pituitary–thyroid (HPT) axis, controlling thyroid hormone (TH) synthesis and secretion in mammals. The TSH produced by thyrotropes is a heterodimeric glycoprotein composed of a common α-subunit (encoded by Cga and shared with FSH and LH) and a β-subunit (encoded by Tshb), which confers receptor specificity. These cells are highly sensitive to circulating triiodothyronine (T3) and thyroxine (T4) levels. The thyrotrope population expands when T3 and T4 levels are low during hypothyroidism and contracts during hyperthyroidism through a classical negative-feedback mechanism11,12,13.
Despite their essential physiological role, thyrotropes remain difficult to study because they constitute only a small fraction of anterior pituitary cells (approximately 5%) and share phenotypic characteristics with other endocrine populations. This scarcity, together with the absence of robust in vitro models, has limited mechanistic investigations of thyrotrope regulation and HPT axis control. The TαT1 tumor cell line represents a commonly used thyrotrope-like model14, but it does not fully reflect physiological responses; in particular, T3-dependent repression of Tshb is often difficult to assess because of its very low basal transcription level15. Consequently, many studies have relied on non-thyrotrope cell lines such as HEK293, COS, CV1, GH3, or JEG3 cells expressing different Tshb constructs15. However, these are heterologous systems that can introduce non-physiological regulatory artifacts, including effects driven by plasmid backbones rather than endogenous transcriptional mechanisms.
Here, we present a step-by-step protocol for isolating thyrotropes from the adult mouse pituitary gland, adapted from a previously established method in rats9, and optimized for the smaller size and lower thyrotrope content of the mouse pituitary. Several key modifications were introduced to enhance the yield of Tshb-expressing cells and ensure reliable downstream analysis. The protocol leverages expression of the surface antigen CD90, a surface marker enriched in thyrotropes. CD90 (also known as THY1) is a glycosylphosphatidylinositol-anchored membrane protein16,17 that mediates juxtacrine signaling through heterotypic interactions with the integrin β2 ligand (ITGB2). Although CD90 is commonly associated with immune and neural cell populations, previous transcriptomic studies identified Thy1 enrichment in thyrotropes. THY1-dependent contact signaling occurs in diverse cell types, including hematopoietic cells, T cells, fibroblasts, endothelial cells, and neurons, where it regulates adhesion, migration, apoptosis, tumor suppression, and fibrosis18,19,20.
Importantly, single-cell transcriptomic profiling of the rat anterior pituitary identified Thy1 as one of the most highly expressed adhesion-related genes in thyrotropes5, suggesting that THY1 is a surface marker enriched in thyrotropes. Moreover, publicly available mouse pituitary single-cell ribonucleic acid (RNA)-sequencing datasets indicate that Thy1/CD90 expression is enriched in thyrotropes22,23. However, its expression is not entirely restricted to this lineage, with detectable expression in subsets of PIT1-lineage cells, including somatotropes and lactotropes, as well as progenitor-like populations. Single-cell transcriptomic studies have demonstrated substantial transcriptional overlap among PIT1-lineage pituitary cells, including the identification of a common PIT1 progenitor population capable of generating somatotropes, lactotropes, and thyrotropes24. Similarly, Thy1/CD90 does not exclusively identify the thyrotrope population but may be used to enrich mouse thyrotropes. Building on these findings, the use of THY1-targeted antibodies in our isolation strategy provides an effective method for enriching thyrotropes following hypothyroidism-induced expansion and enables functional studies, including assessment of hormonal responses to T3.
The protocol begins by feeding wild-type C57BL/6 mice a low-iodine diet and inhibiting thyroid function with methimazole (MMI) and potassium perchlorate (KClO4) in the drinking water25. This treatment induces significant hypothyroidism within one week and expands the population of Tshb-expressing thyrotropes in the anterior pituitary. TSH-producing cells under hypothyroid conditions undergo substantial physiological and morphological adaptations, including hyperplasia, hypertrophy, abundant vacuolated cytoplasm, prominent cytoplasmic processes, and enlarged lysosomes, reflecting adaptation to the absence of TH feedback26,27,28. Thus, induction of hypothyroidism can be used as a strategy to expand the thyrotrope population.
Following hypothyroidism induction, mice are anesthetized with isoflurane and subjected to cardiac perfusion with Ca2+/Mg2+-free HEPES-buffered saline solution to maximize cell viability during tissue dissociation. After harvesting, the anterior pituitary gland undergoes gentle enzymatic digestion to generate a single-cell suspension that is incubated with a phycoerythrin-cyanine 7-conjugated anti-CD90.2 antibody to enrich thyrotropes by fluorescence-activated cell sorting (FACS). Labeled cells are subsequently collected either into growth medium for short-term culture or into TRIzol for RNA extraction. To validate the enrichment strategy, Tshb messenger RNA expression was measured in sorted populations and found to be highly enriched in CD90-positive cells. This method supports a broad range of downstream applications in mice, including gene expression profiling, transcriptomic and epigenomic analyses, high-throughput assays, and primary cell culture, and provides a valuable platform for investigating the cellular and molecular mechanisms underlying thyrotrope function and regulation of the HPT axis.
Access restricted. Please log in or start a trial to view this content.
Protocol
This protocol describes the isolation of thyrotropes from the AL of freshly dissected pituitary glands obtained from adult mice following at least 1 week of hypothyroidism induction. All animal procedures were performed in accordance with institutional and National Institutes of Health guidelines for the care and use of laboratory animals. The Institutional Animal Care and Use Committee of the University of Texas Medical Branch approved all animal procedures.
Male and female mice were pooled during the experiments because no sex-dependent differences in thyrotrope yield or downstream analyses were observed. Approximately 12 mice were used per experiment, although larger cohorts of up to 20 animals can be processed by proportionally scaling all reagent volumes.
Successful isolation depends on rapid and consistent perfusion, minimal dissection time, complete removal of the PL, and high-density plating of primary cells. The recommended maximum processing time between euthanasia, perfusion, pituitary dissection, and initiation of enzymatic digestion was 6 h. Cells were plated at a density of 2.0–2.5 × 10⁵ cells per 0.7 cm2 well (the surface area of one well of an 8-well glass chamber slide). A minimum viability of 95% was required to support short-term thyrotrope culture.
All reagents used for single-cell suspension generation were prepared under sterile conditions. Work surfaces were sterilized with 70% ethanol, dissection instruments were autoclaved before use, and all cell culture preparation steps were performed in a biosafety cabinet using aseptic technique. This protocol was standardized for 12 animals. Scale all reagent volumes proportionally when using a different number of mice. Refer to the Table of Materials for all reagents, consumables, and equipment.
During hypothyroidism induction, mice were housed under specific pathogen-free conditions at 20°C–24°C and 40%–60% relative humidity with a 12 h light/12 h dark cycle and ad libitum access to food and water. Animals were group-housed (up to three mice per cage) in individually ventilated cages containing standard bedding and environmental enrichment, including nesting material and shelter. Successful hypothyroidism induction was confirmed by measuring hepatic iodothyronine deiodinase (Dio1) expression. A reduction of at least 50% in Dio1 messenger RNA (mRNA) expression relative to euthyroid control mice was considered indicative of successful hypothyroidism induction.
1. Hypothyroidism induction in C57BL/6 mice
NOTE: Perform this procedure over 7–10 days to induce hypothyroidism in vivo through an iodine-deficient diet and chemical inhibition of thyroid function. See Figure 1A for the experimental design and Figure 1B for validation of hypothyroidism induction.
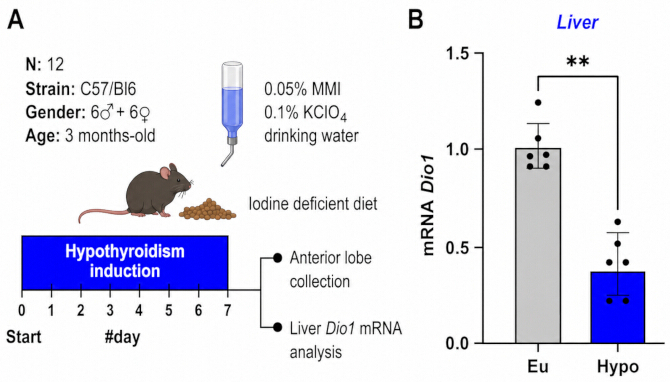
Figure 1. Induction of hypothyroidism in C57BL/6 mice. (A) Schematic representation of the experimental workflow used to induce hypothyroidism in adult C57BL/6 mice. Mice received 0.05% methimazole (MMI) and 0.1% potassium perchlorate (KClO₄) in drinking water together with an iodine-deficient diet for 7 days before anterior pituitary isolation. (B) Reverse-transcription quantitative polymerase chain reaction (RT-qPCR) analysis of hepatic Dio1 messenger ribonucleic acid (mRNA) expression in euthyroid and hypothyroid mice. Cyclophilin A (CyA) was used as the reference gene. Data are presented as mean ± standard deviation (SD) (n = 6 per group). Statistical significance was determined using Student’s t-test. **P < 0.001. Please click here to view a larger version of this figure.
- Prepare MMI/KClO₄ drinking water
- Dissolve 1 g MMI and 2 g KClO₄ in 2 L of filtered water.
- Stir the solution at room temperature (20°C–25°C) for 1 h until complete dissolution.
CAUTION: MMI and KClO₄ are hazardous chemicals. Wear gloves, a lab coat, and eye protection during preparation and handling.
NOTE: MMI inhibits iodide organification, whereas KClO₄ blocks iodide uptake through the sodium–iodide symporter25. Replace the drinking solution every 2 days to maintain the correct dosage and minimize contamination from bedding, food debris, and microbial growth. If not used immediately, store the solution in a tightly sealed light-resistant container at 4°C for up to 14 days.
- Induce hypothyroidism
- House 8-week-old male or female C57BL/6 mice in groups of up to three animals per cage under iodine-free housing conditions.
NOTE: House mice under specific pathogen-free conditions at 20°C–24°C and 40%–60% relative humidity with a 12 h light/12 h dark cycle and ad libitum access to food and water. Maintain animals in individually ventilated cages containing standard bedding and environmental enrichment, including nesting material and shelter. Acclimate animals for 3 days before initiating treatment. House male and female mice separately. For the experiments described here, the euthyroid group consisted of six males and six females housed in separate cages, and the hypothyroid group consisted of six males and six females housed in separate cages. Pool ALs from male and female mice within the same treatment group during cell preparation because no sex-dependent differences in thyrotrope yield or downstream analyses were observed. - Feed the mice an iodine-deficient diet ad libitum for 7–10 days.
NOTE: Initiate the iodine-deficient diet and MMI/KClO₄ treatment simultaneously. - Provide drinking water containing 0.05% MMI and 0.1% KClO₄ ad libitum throughout the treatment period.
NOTE: Maintain treatment until euthanasia. Monitor body weight, food intake, water intake, and clinical signs daily throughout hypothyroidism induction. Successful hypothyroidism induction is typically associated with reduced body-weight gain and clinical signs such as decreased activity or dull fur compared with euthyroid controls. Seven-day and ten-day induction periods produce comparable thyrotrope enrichment efficiency.
- House 8-week-old male or female C57BL/6 mice in groups of up to three animals per cage under iodine-free housing conditions.
2. Cardiac perfusion and AL dissection
NOTE: Perform this procedure in approximately 15 min per mouse to maximize tissue viability and preserve cell integrity during pituitary isolation.
- Prepare perfusion and collection solutions
- Prepare HEPES-buffered saline solution (HBSS) without Ca2+ and Mg2+
- Combine 667 mL of 0.9% NaCl, 20 mL of 1 M HEPES, and 313 mL of double-distilled water (ddH₂O) to prepare 1 L of custom-prepared HBSS without Ca2+ and Mg2+.
- Autoclave the solution and store it at 4°C until use.
- Prepare heparinized HBSS without Ca2+ and Mg2+
- Add 27 µL enoxaparin sodium (100 mg/mL stock solution) to 50 mL of custom-prepared HBSS without Ca2+ and Mg2+.
- Prepare collection medium (CM)
- Combine 440 mL Dulbecco’s modified Eagle medium, 50 mL heat-inactivated fetal bovine serum (FBS), 4 mM L-glutamine, and 10 mL of 1 M HEPES to a final volume of 500 mL.
- Filter-sterilize the solution using a 0.22 µm filter and store it at 4°C for up to 1 month.
NOTE: Prepare 50 mL aliquots under a biosafety cabinet before storage to minimize contamination. - Warm the CM to 20°C–25°C before use.
- Sterilize dissecting instruments
- Sterilize scissors, forceps, tweezers, needle holders, iris forceps, surgical spoons, and blunt probes with 75% ethanol before use.
NOTE: Allow instruments to air-dry completely after ethanol sterilization before tissue contact.
- Sterilize scissors, forceps, tweezers, needle holders, iris forceps, surgical spoons, and blunt probes with 75% ethanol before use.
- Prepare HEPES-buffered saline solution (HBSS) without Ca2+ and Mg2+
- Perform cardiac perfusion
- Deeply anesthetize the mouse using isoflurane delivered in 100% oxygen. Induce anesthesia in a chamber at 5% isoflurane and maintain anesthesia through a nose cone at 3% isoflurane with continuous monitoring and waste-gas scavenging.
CAUTION: Perform isoflurane anesthesia procedures in accordance with institutional safety guidelines and use appropriate scavenging systems to minimize inhalation exposure. - Confirm complete anesthesia by verifying the absence of the pedal withdrawal reflex using a toe pinch.
- Spray the animal with 75% ethanol and place it on the perfusion stage within the collection pan.
- Pin the limbs to expose the peritoneal region.
- Open the thoracic cavity carefully while avoiding damage to major organs and blood vessels.
- Cut along the ribs to create a chest flap, fold the flap over the head, and secure it with a hemostat.
- Stabilize the heart using a clamp and insert a 23-gauge needle into the apex of the left ventricle.
- Connect the needle to a peristaltic pump using silicone tubing.
- Begin perfusion with heparinized HBSS without Ca2+ and Mg2+ maintained at room temperature.
- Incise the right atrium immediately after perfusion begins to allow drainage.
- Perfuse the animal for 5 min at a flow rate of 3 mL/min.
NOTE: Confirm successful perfusion by observing visible paling of the liver.
- Deeply anesthetize the mouse using isoflurane delivered in 100% oxygen. Induce anesthesia in a chamber at 5% isoflurane and maintain anesthesia through a nose cone at 3% isoflurane with continuous monitoring and waste-gas scavenging.
- Isolate the AL
- Decapitate the mouse immediately after perfusion.
- Remove the scalp and cranial bones using fine dissecting scissors and forceps to expose the brain.
- Insert a surgical spoon between the brain and skull.
- Lift the brain gently and cut the optic chiasm.
- Remove the thin meningeal membrane (dura mater) covering the pituitary gland under a stereomicroscope using fine tweezers.
- Carefully dissect and discard the PL as shown in Figure 2A.
NOTE: Identify the AL as the larger pink tissue located rostrally. Identify the PL as the smaller white-translucent tissue located dorsally. - Trim surrounding connective tissue and residual meningeal membranes with a blunt probe to improve access to the AL.
- Grasp the AL with blunt tweezers and transfer it into a 15 mL polypropylene tube containing 1.8 mL CM.
NOTE: Pool ALs from 12 animals into the same collection tube. - Keep the sample at room temperature until all dissections are completed.
NOTE: Do not exceed 3 h between tissue collection and initiation of enzymatic digestion to minimize loss of cell viability.
- Confirm hypothyroidism induction
- Collect a small liver sample (approximately 50 mg) from each mouse.
- Quantify hepatic Dio1 mRNA expression by real-time reverse transcription polymerase chain reaction and compare it with untreated euthyroid controls (Figure 1B).
NOTE: Define successful hypothyroidism induction as a reduction of at least 50% in hepatic Dio1 expression relative to euthyroid controls. Dio1 expression positively correlates with circulating TH levels29; therefore, reduced Dio1 expression confirms successful hypothyroidism induction.
- Repeat tissue collection
- Repeat Steps 2.2–2.4. until ALs from 12 mice have been collected.
- Proceed immediately to Step 3.
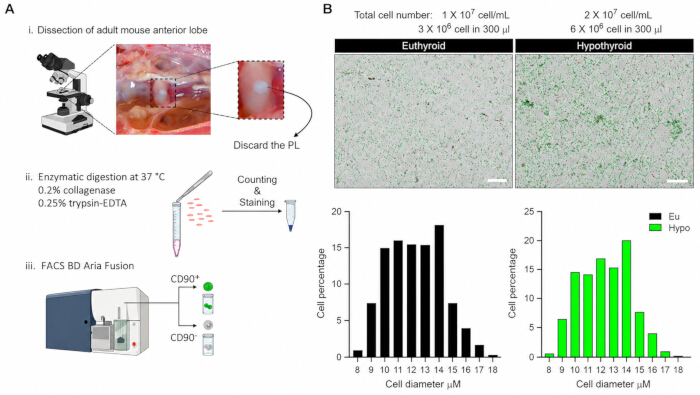
Figure 2. Preparation of a single-cell suspension from mouse anterior pituitary. (A) Workflow illustrating anterior lobe (AL) dissection, enzymatic dissociation, and preparation of a single-cell suspension for fluorescence-activated cell sorting (FACS). The workflow includes posterior lobe removal, collagenase digestion, trypsin–ethylenediaminetetraacetic acid (EDTA) digestion, and filtration before FACS analysis. (B) Representative images of viability dye staining and automated cell counting of dissociated anterior pituitary cells from euthyroid and hypothyroid mice. Total cell yield and viable-cell concentration are indicated. Scale bar = 200 µm. (C) Distribution of anterior pituitary cell diameters following tissue dissociation and preparation for downstream FACS analysis. Please click here to view a larger version of this figure.
3. Preparation of a single-cell suspension from mouse AL
NOTE: Perform this procedure in approximately 60 min to generate a single-cell suspension from anterior pituitary tissue.
- Prepare enzymatic digestion solutions
- Prepare 2% collagenase solution
- Dissolve 100 mg collagenase from Clostridium histolyticum (>125 collagenase digestion units/mg solid) in 4.9 mL ddH₂O.
- Add 100 µL of 1 M HEPES to obtain a final volume of 5 mL.
- Sterilize the solution using a 0.22 µm filter.
- Aliquot the solution into 200 µL volumes and store at −30°C for up to 2 months.
NOTE: Avoid repeated freeze–thaw cycles. Do not reuse thawed collagenase aliquots.
- Prepare 0.25% trypsin–ethylenediaminetetraacetic acid (EDTA)
- Mix 1 mL of 0.5% trypsin–EDTA with 1 mL of HBSS without Ca2+ and Mg2+.
- Store the solution at 4°C until use.
NOTE: Use the diluted trypsin–EDTA solution on the day of preparation. Do not store or reuse diluted trypsin–EDTA.
- Prepare 2% collagenase solution
- Perform collagenase digestion
- Add 200 µL of 2% collagenase solution to the collected AL tissues.
- Mix the tissue gently by pipetting with a P1000 micropipette fitted with low-retention tips.
- Incubate the suspension in a 37°C water bath for 15 min.
NOTE: Keep the tube cap closed during incubation to minimize contamination. - Tap the tube gently every 5 min during incubation.
- Perform deoxyribonuclease I (DNase I) digestion
- Add 5 µL DNase I (1 U/µL) directly to the suspension without removing the supernatant.
- Tap the tube gently 10 times to mix the solution.
- Incubate the suspension at 37°C for 5 min.
- Pellet the tissue
- Centrifuge the suspension at 100 × g for 5 min at room temperature.
- Remove the supernatant carefully using a 1 mL pipette.
NOTE: Leave approximately 50 µL of residual liquid above the pellet during supernatant removal to minimize cell loss.
- Perform trypsin digestion
- Add 2 mL of 0.25% trypsin–EDTA to the pellet.
- Incubate the suspension at 37°C for 10–15 min until no visible intact tissue fragments remain.
NOTE: Do not exceed 15 min to avoid excessive tissue digestion and reduced cell viability.
- Stop enzymatic digestion and dissociate the tissue
- Add 2 mL CM to stop trypsinization.
- Pipette the suspension gently up and down 10–20 times using a micropipette set to 1 mL until no visible tissue fragments remain.
NOTE: Use low-retention pipette tips during mechanical dissociation. An acceptable single-cell suspension is a uniform, low-viscosity suspension containing predominantly single cells with minimal visible aggregates or debris (≤5%–10% clumps by microscopic inspection using Trypan Blue exclusion).
- Collect the single-cell suspension
- Centrifuge the suspension at 100 × g for 5 min at room temperature.
- Remove the supernatant carefully.
- Proceed immediately to Step 4.
NOTE: Begin staining within 15 min of single-cell suspension preparation and complete cell sorting within 1 h whenever possible. Maintain cells on ice during this interval to minimize viability loss.
4. Staining for fluorescence-activated cell sorting
NOTE: Perform this procedure in approximately 60 min to stain dissociated anterior pituitary cells for FACS of CD90-positive cells.
- Prepare the cell suspension
- Add 350 µL staining buffer consisting of phosphate-buffered saline (PBS, 1×) containing 2% FBS and 0.09% sodium azide to the cell pellet.
- Resuspend the pellet gently by pipetting up and down 10 times using a P1000 micropipette fitted with low-retention tips to obtain a single-cell suspension.
- Transfer the suspension into a 1.5 mL low-binding microcentrifuge tube.
- Determine cell concentration and viability
- Remove a 5 µL aliquot from the suspension for cell counting.
- Mix the aliquot with 5 µL viability dye.
- Load 10 µL of the mixture into an automated cell counter.
NOTE: Proceed to FACS when cell viability is ≥85% as determined by viability dye exclusion and when minimal debris and cell aggregates are observed. - Confirm that the total cell concentration is approximately 1 × 10⁷ cells/mL for euthyroid samples and 2 × 10⁷ cells/mL for hypothyroid samples (Figure 2B). Cell-size distribution following dissociation is shown in Figure 2C.
- Prepare compensation controls
- Transfer 50 µL of the cell suspension into 300 µL staining buffer.
- Divide the suspension into three 100 µL aliquots in separate 1.5 mL microcentrifuge tubes.
- Prepare the following controls: (i) unstained control, (ii) propidium iodide (PI)-only control, and (iii) phycoerythrin-cyanine 7 (PE-Cy7) CD90.2-only control.
- Stain the cells
- Add 3 µL PE-Cy7-conjugated anti-CD90.2 antibody to 300 µL cell suspension.
NOTE: The antibody concentration was determined by prior titration experiments. A final dilution of 1:100 provided optimal separation between positive and negative populations while minimizing background staining. - Add 1 µL antibody to the CD90.2 compensation control to obtain a final dilution of 1:100.
- Incubate all samples on ice in the dark for 30 min.
NOTE: Mix samples gently every 10 min during incubation to maintain homogeneous staining.
- Add 3 µL PE-Cy7-conjugated anti-CD90.2 antibody to 300 µL cell suspension.
- Wash the stained cells
- Add 1 mL cold staining buffer to each tube.
- Centrifuge the samples at 210 × g for 5 min at room temperature.
NOTE: If available, disable the centrifuge brake to minimize disruption of the cell pellet during deceleration. - Remove and discard the supernatant carefully.
- Resuspend the stained cells
- Resuspend the main cell suspension in 300 µL staining buffer.
NOTE: Add PI immediately before sorting to a final concentration of 1 µg/mL. - Resuspend each compensation control in 100 µL staining buffer.
- Resuspend the main cell suspension in 300 µL staining buffer.
- Filter the cell suspension
- Filter the cell suspension through a flow cytometry tube fitted with a 35 µm cell strainer immediately before sorting.
- Proceed to fluorescence-activated cell sorting
- Proceed immediately to Step 5 and sort the stained cells using a fluorescence-activated cell sorter.
5. FACS gating and sorting strategy
NOTE: Perform this procedure in approximately 60 min to isolate viable CD90.2-positive thyrotropes by FACS.
- Configure the cell sorter
- Install a 100 µm nozzle on the cell sorter.
- Set the sheath pressure to 20 psi.
NOTE: Use sterile PBS-based sheath fluid maintained at room temperature.
- Perform instrument quality control
- Run instrument quality control procedures according to the manufacturer's instructions before sample acquisition.
NOTE: Equivalent manufacturer-recommended quality control workflows may be used on alternative cell sorters. - Verify drop delay and stream stability using calibration beads.
- Run instrument quality control procedures according to the manufacturer's instructions before sample acquisition.
- Perform fluorescence compensation
- Acquire single-color compensation controls.
- Perform fluorescence compensation before gating and sorting.
NOTE: Calculate compensation using unstained and single-stained controls. Verify and adjust compensation matrices manually before sorting when necessary.
- Define the gating strategy
- Exclude debris using forward-scatter and side-scatter parameters (Figure 3A,B).
- Gate single cells using forward-scatter height versus forward-scatter area and side-scatter height versus side-scatter area (Figure 3A,B).
- Exclude dead cells by gating PI-negative cells.
- Gate CD90.2-positive cells for thyrotrope enrichment.
NOTE: Define CD90.2-positive cells as events exhibiting fluorescence intensity greater than 103 in the CD90 detection channel (Figure 3C–F).
- Prepare collection tubes
- Prepare collection tubes according to the intended downstream application.
NOTE: Prefill low-retention collection tubes with either 1 mL QIAzol lysis reagent for RNA isolation or Medium 199 supplemented with 10% charcoal-stripped fetal bovine serum for cell culture applications.
- Prepare collection tubes according to the intended downstream application.
- Sort CD90.2-positive thyrotropes
- Sort CD90.2-positive single cells into collection tubes.
- Collect cells for RNA analysis
- Collect cells directly into 1 mL lysis reagent.
- Vortex the tubes for 1 min to lyse the cells.
- Freeze the samples immediately on dry ice.
- Store the samples at −80°C until RNA extraction.
- Collect cells for primary culture
- Collect cells into culture medium supplemented with 10% charcoal-stripped fetal bovine serum and 1% penicillin-streptomycin.
- Seed the cells into 8-well glass chamber slides at a density of at least 2 × 10⁵ cells/well in a final volume of 200 µL.
- Culture the cells for up to 72 h at 37°C in a humidified incubator containing 5% CO₂.
NOTE: Acceptable culture performance is indicated by visible cell attachment within 24 h, approximately 60%–80% attachment efficiency, and ≥70%–80% viability after 72 h. - Add 100 nM T3 to the culture medium when required.
NOTE: Initiate T3 treatment after cell attachment, typically 24 h after plating, and maintain treatment until sample collection at 72 h. Prepare T3 stock solution in 40 mM NaOH and include vehicle-treated controls at the same final solvent concentration.
NOTE: Charcoal-stripped serum maintains a TH-depleted culture environment and improves detection of experimentally induced T3-dependent suppression of Tshb expression.
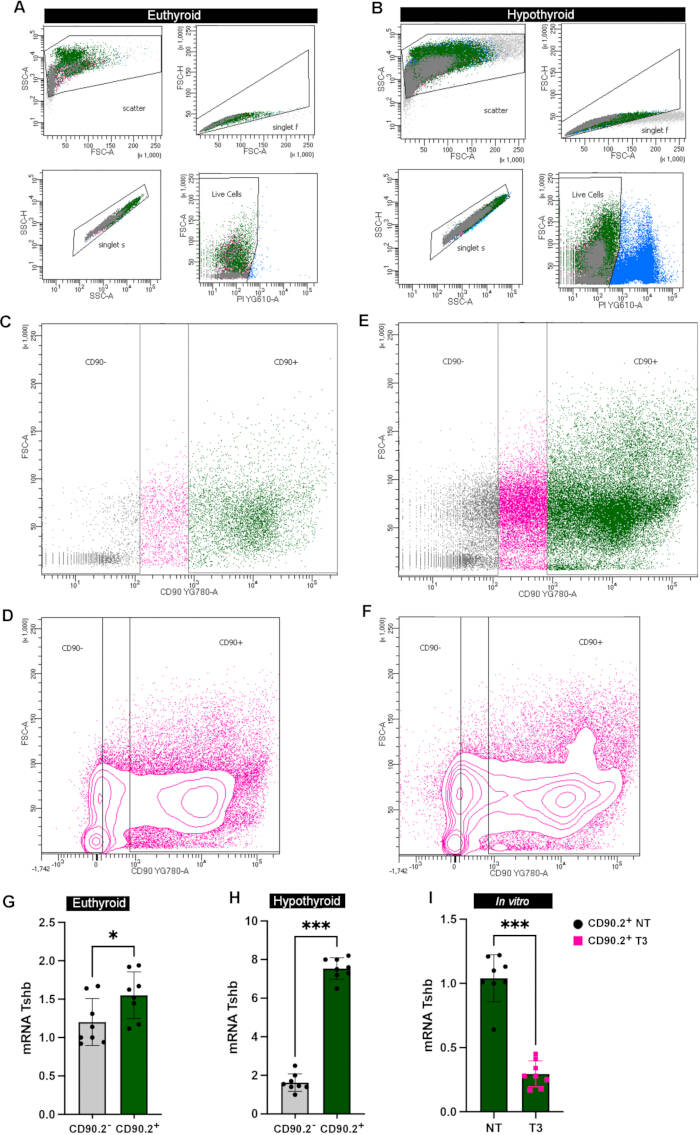
Figure 3. FACS gating strategy and validation of thyrotrope enrichment. (A,B) Sequential gating strategy used to isolate viable single anterior pituitary cells. Gates include debris exclusion using forward-scatter area (FSC-A) and side-scatter area (SSC-A), singlet discrimination using forward-scatter height (FSC-H) versus FSC-A and side-scatter height (SSC-H) versus SSC-A, and exclusion of propidium iodide (PI)-positive dead cells. (C–F) Representative FACS plots showing identification and enrichment of CD90.2-positive and CD90.2-negative cell populations using a phycoerythrin-cyanine 7 (PE-Cy7)-conjugated anti-CD90.2 antibody. (G–I) Reverse-transcription quantitative polymerase chain reaction (RT-qPCR) validation of thyrotrope enrichment in sorted cell populations. Abbreviations: FSC-A, forward-scatter area; SSC-A, side-scatter area; FSC-H, forward-scatter height; SSC-H, side-scatter height; PI, propidium iodide; PE-Cy7, phycoerythrin–cyanine 7; NT, untreated. Please click here to view a larger version of this figure.
6. Gene expression analysis of Tshb mRNA in CD90-positive versus CD90-negative cells by real-time polymerase chain reaction
NOTE: Perform this procedure in approximately 5 h to quantify Tshb mRNA expression in sorted cell populations.
- Collect sorted cells for RNA extraction
- Collect equal numbers of CD90-positive and CD90-negative cells (2.5 × 10⁵ cells) into separate 1.5 mL tubes containing 1 mL lysis reagent.
- Lyse the cells
- Vortex the samples vigorously for 1 min to lyse the cells completely and place the samples on ice.
NOTE: Store lysed samples at −80°C before RNA extraction if necessary.
- Vortex the samples vigorously for 1 min to lyse the cells completely and place the samples on ice.
- Extract total RNA
- Extract total RNA according to the manufacturer’s instructions provided with the RNA extraction kit.
NOTE: Perform DNase digestion during purification using RNase-free DNase I according to the manufacturer's instructions to remove residual genomic deoxyribonucleic acid (DNA) before elution. - Measure RNA concentration using a spectrophotometer.
NOTE: Use samples with an A260/A280 ratio of approximately 1.8–2.1 and an A260/A230 ratio greater than 1.8 for complementary DNA (cDNA) synthesis.
- Extract total RNA according to the manufacturer’s instructions provided with the RNA extraction kit.
- Synthesize cDNA
- Synthesize cDNA from 100 ng total RNA according to the manufacturer's instructions provided with the first-strand cDNA synthesis kit.
NOTE: Use oligo(dT) primers during cDNA synthesis. - Prepare the template-primer mixture according to Table 1.
- Mix the reagents gently and centrifuge briefly to collect the sample at the bottom of the tube.
- Denature the template-primer mixture at 65°C for 10 min.
- Cool the samples immediately on ice.
- Prepare the reverse-transcription reaction mixture according to Table 2 to obtain a final volume of 20 µL.
NOTE: Prepare a master mix by multiplying the reagent volumes listed in Table 2 by the total number of samples and adding an additional 10% excess volume to account for pipetting variability. - Mix the reaction gently without vortexing and centrifuge briefly.
- Incubate the reaction at 50°C for 60 min.
- Inactivate the reaction at 85°C for 5 min.
- Chill the samples on ice.
- Proceed directly to reverse-transcription quantitative polymerase chain reaction (RT-qPCR) or store the cDNA at −30°C until use.
NOTE: cDNA may be stored at −30°C for up to 6 months under nuclease-free conditions. Avoid repeated freeze–thaw cycles.
NOTE: Perform cDNA synthesis steps in a thermocycler equipped with a heated lid to minimize evaporation.
- Synthesize cDNA from 100 ng total RNA according to the manufacturer's instructions provided with the first-strand cDNA synthesis kit.
- Prepare the RT-qPCR reaction mixture
- Prepare the RT-qPCR reaction mixture according to Table 3.
- Load the RT-qPCR plate
- Add 9 µL RT-qPCR reaction mixture to each well of a 96-well plate.
- Add 1 µL cDNA template corresponding to the reverse-transcribed product generated from 5 ng of input total RNA.
- Mix the samples gently and centrifuge briefly.
- Perform RT-qPCR
- Perform RT-qPCR according to the manufacturer's instructions provided with the SYBR Green master mix.
NOTE: Use an initial denaturation step of 95°C for 2 min followed by 40 cycles of 95°C for 5 s and 60°C for 30 s. Acquire fluorescence at the end of each extension step. Perform melt-curve analysis from 65°C to 95°C in 0.5°C increments to verify single-product amplification.
- Perform RT-qPCR according to the manufacturer's instructions provided with the SYBR Green master mix.
- Normalize Tshb expression
- Normalize Tshb expression to Cyclophilin A (CyA) expression using the ΔCt method.
NOTE: Validate CyA stability before analysis by confirming minimal Ct variation across experimental groups.
- Normalize Tshb expression to Cyclophilin A (CyA) expression using the ΔCt method.
- Calculate relative gene expression
- Calculate relative Tshb expression in CD90-positive cells relative to CD90-negative cells using the 2−ΔΔCt method.
NOTE: Perform RT-qPCR analysis using eight biological samples, each analyzed in technical duplicate reactions (Figure 3G–I).
- Calculate relative Tshb expression in CD90-positive cells relative to CD90-negative cells using the 2−ΔΔCt method.
| Reagent | Volume | Final amount/concentration |
| Total RNA | Variable | 100 ng |
| Anchored oligo(dT)18 primer (50 pmol/µL) | 1 µL | 2.5 µM |
| PCR-grade water | Variable | Adjust to 13 µL total volume |
| Total | 13 µL | — |
Table 1: Template–primer mixture preparation for complementary deoxyribonucleic acid synthesis. Reagents, volumes, and final amounts used to prepare the template–primer mixture for complementary deoxyribonucleic acid (cDNA) synthesis. Each reaction contained 100 ng total ribonucleic acid (RNA), an anchored oligo(dT)18 primer, and polymerase chain reaction (PCR)-grade water adjusted to a final volume of 13 µL. The reported 2.5 µM concentration refers to the primer concentration in the 13 µL template–primer mixture before addition of the reverse-transcription reaction components.
| Reagent | Volume | Final amount/concentration |
| Transcriptor Reverse Transcriptase Reaction Buffer (5×) | 4 µL | 1× |
| Protector RNase Inhibitor (40 U/µL) | 0.5 µL | 20 U |
| Deoxynucleotide mix (10 mM each) | 2 µL | 1 mM each |
| Transcriptor Reverse Transcriptase (20 U/µL) | 0.5 µL | 10 U |
| Template–primer mixture (Table 1) | 13 µL | — |
| Total | 20 µL | — |
Table 2: Reverse-transcription reaction mixture for complementary deoxyribonucleic acid synthesis. Reagents, volumes, and final concentrations used for first-strand complementary deoxyribonucleic acid (cDNA) synthesis. The final reaction volume was 20 µL. The reported deoxynucleotide triphosphate concentrations (1 mM each) refer to the final concentrations in the complete reaction mixture.
| Reagent | Volume | Final amount/concentration |
| PowerTrack SYBR Green Master Mix (2×) | 5 µL | 1× |
| Tshb forward and reverse oligonucleotide primers (see Table of Materials) | 0.5 µL | 400 nM |
| PCR-grade water | 3.5 µL | Adjust to 9 µL reaction volume |
| Subtotal reaction volume | 9 µL | — |
| cDNA template | 1 µL | 5 ng |
| Final reaction volume | 10 µL | — |
Table 3: Reverse-transcription quantitative polymerase chain reaction reaction mixture preparation. Reagents, volumes, and final concentrations used for reverse-transcription quantitative polymerase chain reaction (RT-qPCR) amplification of Tshb messenger ribonucleic acid (mRNA). The reaction mixture volume before template addition was 9 µL. Add 1 µL complementary deoxyribonucleic acid (cDNA) template immediately before amplification to obtain a final reaction volume of 10 µL.
Access restricted. Please log in or start a trial to view this content.
Results
Twelve 8-week-old C57BL/6 mice (6 males and 6 females) were treated with MMI and KClO₄ in drinking water together with an iodine-deficient diet for 1 week to induce hypothyroidism (Figure 1A). Hepatic type 1 Dio1 mRNA expression was quantified in euthyroid and hypothyroid mice to confirm successful hypothyroidism induction29. Hypothyroid mice exhibited an approximately 60% reduction in hepatic Dio1 mRNA expression compared with euthyroid contro...
Access restricted. Please log in or start a trial to view this content.
Discussion
The CD90-based FACS protocol described here provides a reproducible method for enriching primary thyrotropes from adult mouse pituitary tissue while preserving hormonal responsiveness. This method addresses a long-standing technical limitation in the study of thyrotrope biology and HPT axis regulation. Historically, investigations of thyrotrope regulation have relied heavily on the TαT1 cell line; however, TαT1 cells exhibit very low basal Tshb expression and do not consistently demonstrate canonical T...
Access restricted. Please log in or start a trial to view this content.
Disclosures
The other authors have no relevant disclosures.
Acknowledgements
This work was supported by the National Institute of Diabetes and Digestive and Kidney Diseases (DK15070, DK65066, DK77148 to A.C.B.).
Access restricted. Please log in or start a trial to view this content.
Materials
| Name | Company | Catalog Number | Comments |
|---|---|---|---|
| 0.22 µm filter | Corning | 430769 | For collection medium sterilization |
| 0.22 µm syringe filter | Pall Life Sciences | PN4602 | For collagenase sterilization |
| 0.5% Trypsin–EDTA | Gibco | 15400-054 | For cell dissociation |
| 1.5 mL low-binding microcentrifuge tubes | Invitrogen | AM12450 | For FACS staining |
| 15 mL polypropylene tubes | Falcon | 352097 | For anterior lobe collection and cell dissociation |
| 23-gauge needle | BD Vacutainer Safety-Lok | 367283 | For cardiac perfusion |
| 8-well glass chamber slide | Millipore | PEZGS0816 | For post-FACS culture |
| Accudrop beads | BD Biosciences | 345249 | For drop delay calibration during FACS |
| Anti-mouse PE-Cy7 anti-CD90.2 antibody | Invitrogen | 25-0902-82 | For FACS staining |
| Automated cell counter | DeNovix | s-10700 | For cell counting |
| Charcoal-stripped fetal bovine serum | Gibco | 12676029 | For post-FACS thyrotrope culture |
| Collagenase from Clostridium histolyticum | Sigma-Aldrich | C9263 | For cell dissociation |
| Collection pan | Standard laboratory dissection tray | N/A | For cardiac perfusion |
| Custom-prepared HEPES-buffered saline solution (HBSS) without Ca2+ and Mg2+ | N/A | N/A | For perfusion and cell dissociation |
| Cyclophilin A (CyA) oligonucleotide primer forward | Integrated DNA Technologies | 5′-GCC GAT GAC GAG CCC TTG-3′ | For RT-qPCR |
| Cyclophilin A (CyA) oligonucleotide primer reverse | Integrated DNA Technologies | 5′-TGC CGC CAG TCG CAT TAT-3′ | For RT-qPCR |
| DMEM, 1× | Gibco | 11965-092 | For collection medium |
| DNase I solution | Promega | M6101 | For cell dissociation |
| Enoxaparin sodium injection | Sandoz | 0781-3119-64 | For perfusion |
| Fetal bovine serum (FBS) | Cytiva HyClone | SH30088.02HI | For collection medium |
| Flow cytometry staining buffer | Invitrogen | 00-4222-26 | For FACS staining |
| Hemostat | Fine Science Tools | 13008-12 | For thoracic cavity stabilization |
| HEPES, 1 M | Gibco | 15630-080 | For collection medium |
| HEPES, 1 M | Teknova | H1035 | For HBSS preparation |
| Iodine-deficient diet | Envigo | TD.95007 | For in vivo hypothyroidism induction |
| Iris forceps | Fine Science Tools | 11065-07 | For pituitary dissection |
| Isoflurane | Piramal Critical Care | 66794-017-25 | For anesthesia |
| L-glutamine | Gibco | 35050-061 | For collection medium |
| Medium 199 | Gibco | 11150-059 | For post-FACS culture |
| Methimazole (MMI) | Sigma-Aldrich | M8506-100G | For in vivo hypothyroidism induction |
| MicroAmp Fast 96-well reaction plate | Applied Biosystems | 4346907 | For RT-qPCR |
| Penicillin–Streptomycin | Gibco | 15140122 | For post-FACS culture |
| Peristaltic pump | Fisher Scientific | GP1000 | For cardiac perfusion |
| Potassium perchlorate (KClO4) | Sigma-Aldrich | 241830-500G | For in vivo hypothyroidism induction |
| PowerTrack SYBR Green Master Mix | Applied Biosystems | A46109 | For RT-qPCR |
| Propidium iodide | eBioscience | 00-6990-50 | For viability staining during FACS |
| QIAzol lysis reagent | Qiagen | 79306 | For RNA extraction |
| Silicone tubing | Cole-Parmer | EW-96410-13 | For cardiac perfusion |
| Stereomicroscope | Nikon | SMZ-745T | For anterior lobe dissection |
| StepOnePlus Real-Time PCR System | Applied Biosystems | 4376600 | For RT-qPCR |
| Surgical spoon | Fine Science Tools | 10090-13 | For brain lifting during pituitary exposure |
| Transcriptor First Strand cDNA Synthesis Kit | Roche | 4379012001 | For cDNA preparation |
| Trypan Blue | Thermo Fisher Scientific | T10282 | For cell counting |
| Tshb oligonucleotide primer forward | Integrated DNA Technologies | 5′-TCT GTG CTG GGT ATT GTA TGA C-3′ | For RT-qPCR |
| Tshb oligonucleotide primer reverse | Integrated DNA Technologies | 5′-GCG GCT TGG TCG AGT AGT TG-3′ | For RT-qPCR |
| Water bath | Fisher Scientific Isotemp Water Bath | 15-462-5Q | For enzymatic digestion |