This retrospective case-control study evaluated serum miR-146a, miR-642a, miR-2861, and metabolic markers in women with polycystic ovary syndrome. Coordinated alterations in miRNAs, adipokines, insulin resistance, inflammation, and testosterone were observed, while a combined biomarker model showed stronger discriminatory performance than individual markers.
Research Article
MicroRNA and Nutrient Metabolic Protein Signatures in Polycystic Ovary Syndrome and Their Links to Insulin Resistance and Inflammation
In This Article
Summary
Abstract
Polycystic ovary syndrome (PCOS) is a common endocrine and metabolic disorder in women of reproductive age, but the relationships between circulating microRNAs (miRNAs) and nutrition-related proteins remain incompletely understood. This study investigated the associations of serum miR-146a, miR-642a, and miR-2861 with metabolic and inflammatory markers in PCOS. The study included 62 women with PCOS and 71 healthy controls. Serum miR-146a, miR-642a, and miR-2861 were measured by quantitative real-time PCR, while adiponectin (ADPN), leptin (LEP), retinol-binding protein 4 (RBP4), homeostasis model assessment of insulin resistance (HOMA-IR), interleukin-6 (IL-6), and testosterone (T) were also assessed. Methodological validation evaluated sample processing conditions, assay precision, and agreement between analytical methods. Compared with controls, women with PCOS showed increased miR-146a expression and decreased miR-642a and miR-2861 expression. ADPN levels were reduced, whereas LEP, RBP4, HOMA-IR, IL-6, and T levels were elevated. miR-146a was negatively correlated with ADPN and positively correlated with LEP, RBP4, HOMA-IR, IL-6, and T. miR-642a was negatively correlated with RBP4, HOMA-IR, and IL-6, while miR-2861 was positively correlated with ADPN. Methodological validation showed acceptable assay stability, precision, and agreement between methods. The model combining the three miRNAs with ADPN, LEP, RBP4, HOMA-IR, IL-6, and T achieved an area under the curve of 0.929, with 82.26% sensitivity and 94.37% specificity. These findings demonstrate coordinated alterations in circulating miRNAs and metabolic markers in PCOS and support further evaluation of their combined diagnostic potential.
Introduction
PCOS is the most common endocrine and metabolic disorder in women of reproductive age. Its global prevalence is estimated to range from 6% to 20%. Approximately 70% of affected women have insulin resistance, and more than half are overweight or obese1. PCOS may lead to ovulatory dysfunction, infertility, type 2 diabetes, cardiovascular disease, and other long-term complications, thereby seriously affecting reproductive health and quality of life2. Although its pathogenesis has not been fully elucidated, PCOS is generally considered to involve multiple factors, including genetic susceptibility, chronic low-grade inflammation, abnormalities in insulin signaling pathways, and disruption of the local ovarian microenvironment. Against this background, identifying specific molecular markers that reflect disease progression is of clear value for early diagnosis and precise intervention in PCOS3,4.
MiRNAs are a class of non-coding RNAs approximately 22 nucleotides in length. These molecules regulate gene expression after transcription by either promoting the breakdown of mRNA or inhibiting translation. Therefore, these molecules are crucial for many cellular processes, including cell growth, differentiation, responses to inflammation, and metabolic regulation5,6. Previous studies have shown characteristic dysregulation of miR-146a, miR-642a, and miR-2861 in the serum of patients with PCOS. Upregulation of miR-146a may mediate chronic inflammatory responses through targeted regulation of the TLR4/NF-κB pathway7, whereas decreased expression of miR-642a and miR-2861 has been closely associated with insulin resistance and impaired ovarian granulosa cell function8,9. ADPN, LEP, and RBP4, which are proteins related to nutrition, play a crucial role in regulating metabolic balance. Changes in their levels can directly affect how lipids are processed, how sensitive the body is to insulin, and the state of inflammation. This is considered a key part of the molecular basis of metabolic problems seen in PCOS10,11. However, most published studies have examined either miRNAs or nutrition-related proteins separately in relation to PCOS12,13, and the molecular relationship between the two has yet to be clarified in a systematic way.
In this study, we measured the expression levels of three miRNAs and six core biomarkers in patients with PCOS, analyzed the correlations among these markers and their associations with clinical biochemical indices, and further explored whether miRNAs may participate in the pathological process of PCOS through associations with nutrition-related proteins. The findings of this study may enrich current understanding of the molecular basis of PCOS, provide potential targets for therapies aimed at nutritional and metabolic regulation, and offer laboratory evidence for early screening, efficacy monitoring, and individualized management of PCOS.
Protocol
Statement of ethics
The study was conducted in accordance with the Declaration of Helsinki and was approved by the Medical Ethics Committee of Ganzhou Hospital of Traditional Chinese Medicine (approval no. GZSZYYKYLL20240092, Date: 2024-12-20).
All materials, reagents, assay kits, and equipment used in this protocol are listed in the Table of Materials.
Study design
This retrospective case-control study included 62 patients with PCOS diagnosed at the gynecology outpatient clinic of Ganzhou Hospital of Traditional Chinese Medicine between June 2024 and August 2025 and 71 healthy women of reproductive age examined at the hospital’s health management center during the same period. Controls were selected to achieve group-level comparability in age; BMI was not used as a matching variable and was evaluated as a baseline characteristic.
Study subjects
Inclusion criteria: The inclusion criteria for the PCOS group were as follows: (1) age >18 years; (2) diagnosis of PCOS according to the modified Rotterdam criteria endorsed by the 2023 International Evidence-based Guideline, requiring at least two of the following three features after exclusion of related disorders: oligo-ovulation or anovulation, defined as menstrual cycles longer than 35 days or fewer than eight cycles per year; clinical hyperandrogenism and/or biochemical hyperandrogenism, with biochemical hyperandrogenism defined as a serum total T concentration above the assay-specific upper reference limit; and polycystic ovarian morphology, defined as at least 20 follicles in one ovary or an ovarian volume of at least 10 mL when complete follicle counting was not feasible14; (3) complete electronic medical records; (4) no hormone replacement therapy, hypoglycemic agents, or immunosuppressants during the preceding 3 months; and (5) availability of a fasting serum sample collected at enrollment and stored in the institutional biobank.
The inclusion criteria for the control group were as follows: (1) attendance for a health examination during the same period; (2) regular menstrual cycles; (3) normal ovarian morphology on transvaginal ultrasonography; (4) no history of endocrine disorders, gynecological disease, infertility, or clinically significant hepatic or renal dysfunction; and (5) availability of a fasting serum sample collected on the day of examination and stored in the institutional biobank.
The exclusion criteria were as follows: (1) endometriosis, uterine fibroids, ovarian tumors, pelvic inflammatory disease, or other gynecological disorders; (2) thyroid dysfunction, Cushing syndrome, hyperprolactinemia, congenital adrenal hyperplasia, or other endocrine disorder that could account for ovulatory dysfunction or hyperandrogenism; (3) severe cardiac, hepatic, renal, or pulmonary dysfunction, malignant tumors, autoimmune diseases, or hematologic disorders; (4) pregnancy, delivery, or abortion within the preceding 6 months; (5) use of glucocorticoids, oral contraceptives, or other medications affecting glucose or lipid metabolism during the preceding 3 months; (6) psychiatric disorders or cognitive impairment; (7) missing key clinical information; and (8) severe serum hemolysis, defined as a hemoglobin concentration >2.0 g/L, lipemia, jaundice, more than one freeze–thaw cycle, or interrupted sample storage. Thyroid dysfunction, hyperprolactinemia, and non-classic congenital adrenal hyperplasia were excluded using thyroid-stimulating hormone, serum prolactin, and 17-hydroxyprogesterone measurements, respectively; follicle-stimulating hormone was reviewed where appropriate, while Cushing syndrome or an adrenal tumor was investigated when clinically indicated. The same pre-analytical procedure was applied to all clinical samples, and no sample included in the primary analysis underwent more than one freeze–thaw cycle.
Serum sample collection and storage
Fasting venous blood (10 mL) was collected in the morning into anticoagulant-free tubes, allowed to clot at room temperature for 30 min, and centrifuged at 1,505 x g for 15 min at 4 °C. Serum was divided into 200 µL aliquots and stored at −80 °C until analysis. The same pre-analytical procedure was applied to all clinical samples, and no sample included in the primary analysis underwent more than one freeze–thaw cycle.
Preparation of samples for methodological validation
Ten pooled serum samples from healthy volunteers were used to evaluate the effects of centrifugation speed (1,505, 3,000, and 4,000 x g for 15 min), freeze–thaw frequency (0, 1, 3, and 5 cycles), storage temperature (4 °C, −20 °C, and −80 °C for 7 days), storage duration (1, 3, 6, and 12 months at −80 °C), and hemolysis (<0.1, 0.1–0.5, and 0.5–2.0 g/L hemoglobin).
Laboratory testing
All laboratory assays were performed by the same trained technician under standardized environmental conditions and according to prespecified operating procedures. Serum miRNAs were quantified by qRT-PCR; ADPN, LEP, and RBP4 were measured by sandwich ELISA; T and IL-6 were measured by chemiluminescence-based immunoassays; and glucose-metabolic variables were obtained using routine automated laboratory methods.
Serum miRNA quantification by qRT-PCR
Total RNA was extracted from 200 µL of serum using TRIzol reagent. Spectrophotometric RNA concentration and A260/A280 purity data were not available for the archived serum RNA preparations. qRT-PCR assay acceptability was therefore assessed by the presence of a single specific melting-curve peak and concordance among three technical replicates. After chloroform phase separation, isopropanol precipitation, and two washes with 75% ethanol, the RNA pellet was dissolved in enzyme-free water. The 20 µL reaction system contained 4 µL of 5x buffer, 1 µL of reverse transcriptase, 1 µL of 10 µM stem-loop primer, and 5 µL of RNA template. The reaction conditions were 16 °C for 30 min, 42 °C for 30 min, and 85 °C for 5 s. The reverse-transcribed products were stored at −20 °C. Quantitative PCR was carried out using the TaKaRa SYBR Premix Ex Taq II kit. Each 20 µL reaction contained 10 µL of 2× SYBR mixture, 0.8 µL each of forward and reverse primers (10 µM), and 2 µL of cDNA template. Amplification was performed on an Applied Biosystems 7500 real-time PCR system under the following conditions: pre-denaturation at 95 °C for 30 s; 40 cycles of 95 °C for 5 s and 60 °C for 30 s; melting curve analysis was then performed to confirm amplification specificity. U6 snRNA served as the internal reference gene, and relative expression levels of miR-146a, miR-642a, and miR-2861 were calculated using the 2-ΔΔCt method. Each sample was tested in triplicate. The sequences of all primers used in this study are listed in Table 1.
Serum protein marker detection
Serum ADPN, LEP, and RBP4 concentrations were measured by double-antibody sandwich ELISA using the Human Total ADPN/Acrp30 Quantikine ELISA Kit (analytical sensitivity, 0.891 ng/mL; assay range, 3.9–250 ng/mL), Human Leptin Quantikine ELISA Kit (analytical sensitivity, 7.8 pg/mL; assay range, 15.6–1,000 pg/mL), and Human RBP4 Quantikine ELISA Kit (analytical sensitivity, 0.628 ng/mL; assay range, 1.56–100 ng/mL), respectively. Each assay was specific for the corresponding human analyte, and serum samples were diluted according to the manufacturer’s instructions. Absorbance was measured at 450 nm, and concentrations were calculated using four-parameter logistic standard curves. The intra-assay or inter-assay CVs were 2.5% or 3.2% for ADPN, 2.7% or 3.4% for LEP, and 2.6% or 3.3% for RBP4.
T measurement
Serum T was measured by electrochemiluminescence immunoassay using a Roche Cobas e601 automated immunoassay analyzer.
Glucose-metabolic and inflammatory measurements
Fasting plasma glucose, fasting insulin, and HbA1c values were obtained from same-day routine clinical laboratory records rather than from the archived serum aliquots used for the miRNA and metabolic protein assays. Fasting plasma glucose was measured by the glucose oxidase method, fasting insulin by immunoturbidimetry, and HbA1c by high-performance liquid chromatography. HOMA-IR was calculated as [fasting plasma glucose (mmol/L) × fasting insulin (mIU/L)]/22.5. Serum IL-6 was measured by chemiluminescence immunoassay.
Methodological validation
The alternative-method comparisons were performed to determine whether the primary measurements were robust to assay platform and were not used to generate the principal between-group results. Expression levels of the three miRNAs and five biochemical markers were measured under the different processing conditions described above, and the coefficient of variation for each indicator was calculated as CV = (standard deviation/mean) x 100%. A CV <15% was considered acceptable for evaluating the stability of assay results under different sample processing and storage conditions. Within-day precision was assessed by repeated measurement of the same pooled serum sample 10 times on a single day, whereas between-day precision was determined from measurements performed once daily over five consecutive days. For each indicator, the mean, standard deviation, and corresponding CV were calculated. For analytical agreement testing, five biochemical analytes—ADPN, LEP, RBP4, IL-6, and T—were measured in the validation samples using the primary assay and a Roche chemiluminescence-based immunoassay platform. Bland–Altman analysis was used to calculate the 95% limits of agreement. The primary qRT-PCR assay was used for all clinical miRNA measurements, whereas the miScript SYBR Green PCR Kit was used only as an orthogonal method in the analytical agreement experiment; Pearson correlation coefficients were calculated between the two qRT-PCR systems.
Statistical analysis
Data analysis was performed using statistical software. All continuous variables were first tested for normality with the Shapiro-Wilk test. Data with a normal distribution are expressed as mean ± standard deviation. Comparisons between two groups were made with the independent-samples t test, while comparisons among multiple groups were performed using one-way analysis of variance, followed by the LSD-t test for pairwise comparisons. Data not conforming to a normal distribution are presented as median (interquartile range) [M (P25, P75)]. Comparisons between two groups were then performed with the Mann-Whitney U test, and comparisons among multiple groups with the Kruskal-Wallis H test. Categorical data were presented as frequencies and percentages. We used the χ2 test or Fisher’s exact test to compare the groups. Correlations between variables were assessed using Pearson correlation analysis or Spearman rank correlation analysis according to data distribution. As an exploratory analysis, Pearson correlations between each miRNA and the six metabolic markers were repeated within non-obese (BMI <28 kg/m2) and obese (BMI ≥28 kg/m2) PCOS subgroups. Correlation coefficients were compared using Fisher’s r-to-z transformation, and the resulting between-subgroup p values were adjusted using the Benjamini–Hochberg false-discovery-rate procedure. We evaluated diagnostic performance using receiver operating characteristic (ROC) curves and the area under the curve (AUC). In addition, we analyzed combined detection using a logistic regression model. All tests were two-sided, and p < 0.05 was considered statistically significant.
Results
Baseline characteristics of the study population
A total of 62 patients with PCOS and 71 healthy controls were included in this study. The two groups were comparable in age, ethnic composition, and other baseline characteristics (p > 0.05). By contrast, menstrual cycles were significantly longer in the PCOS group than in the control group (p < 0.001), which is consistent with the typical clinical presentation of PCOS (Table 2).
Serum miRNA expression levels
Serum miRNA analysis revealed a clear difference in expression profiles between patients with PCOS and healthy controls. In the PCOS group, the relative expression value of miR-146a calculated using the 2−ΔΔCt method was 2.15 ± 0.49, representing a 35.22% increase compared with the control group (p < 0.05; Figure 1A). The corresponding relative expression values of miR-642a and miR-2861 were 0.56 ± 0.12 and 0.46 ± 0.10, respectively, and both were lower than those in the control group (p < 0.05; Figure 1B,C).
Serum protein marker and biochemical profiles
Concomitant with the alterations in miRNA expression, patients diagnosed with PCOS also presented notable alterations in their serum nutrition-related protein profile. ADPN, a key regulator of insulin sensitivity, was reduced in the PCOS group (p < 0.05; Figure 2A), whereas LEP and RBP4 were markedly elevated (p < 0.001; Figure 2B,C). HOMA-IR, IL-6, and T were also higher in the PCOS group than in the control group (p < 0.05; Figure 2D–F).
Correlations of miRNAs with protein markers and biochemical indices
Within the PCOS group, miR-146a was negatively correlated with ADPN (r = −0.51, p < 0.001) and positively correlated with LEP (r = 0.69, p < 0.001), RBP4 (r = 0.30, p = 0.017), HOMA-IR (r = 0.44, p < 0.001), IL-6 (r = 0.65, p < 0.001), and T (r = 0.60, p < 0.001; Figure 3A). miR-642a was negatively correlated with RBP4 (r = −0.64, p < 0.001), HOMA-IR (r = −0.68, p < 0.001), and IL-6 (r = −0.28, p = 0.028; Figure 3B). miR-2861 was positively correlated with ADPN (r = 0.66, p < 0.001) and negatively correlated with HOMA-IR (r = −0.34, p = 0.006) and IL-6 (r = −0.41, p = 0.001; Figure 3C). The overall correlation analysis results are shown in Figure 3D.
Quality control results
Across the evaluated pre-analytical conditions, analyte-specific CVs ranged from 3.5% to 9.8%. Intra-assay CVs ranged from 2.5% to 3.2%, and inter-assay CVs ranged from 3.2% to 3.9%. Correlation coefficients between the primary and alternative analytical methods ranged from 0.915 to 0.956; the corresponding 95% limits of agreement are reported in Supplementary Table 3. Detailed analyte-level results are provided in Supplementary Table 3, Supplementary Table 2, and Supplementary Table 3.
BMI-stratified correlation analysis
Among the 62 women with PCOS, 37 were classified as non-obese and 25 as obese. Nominal between-subgroup differences were observed for the correlations of miR-146a with HOMA-IR (p = 0.010) and IL-6 (p = 0.014), and for the correlation of miR-2861 with HOMA-IR (p = 0.021); however, none remained significant after false-discovery-rate correction (all q ≥ 0.122). The complete exploratory results are presented in Supplementary Table 4.
Diagnostic performance of different biomarker combinations
Among the individual biomarkers, miR-146a showed the highest AUC (0.753). The combined miRNA model, with a linear predictor of 1.915 + 1.485 × miR-146a − 3.298 × miR-642a − 4.926 × miR-2861, yielded an AUC of 0.873 (95% CI, 0.813–0.933).
The model incorporating miR-146a, miR-642a, miR-2861, ADPN, LEP, RBP4, HOMA-IR, IL-6, and T, with a linear predictor of −3.610 + 0.653 × miR-146a − 1.999 × miR-642a − 3.387 × miR-2861 − 0.141 × ADPN + 0.078 × LEP + 0.011 × RBP4 + 0.762 × HOMA-IR − 0.018 × IL-6 + 1.311 × T, yielded the highest AUC of 0.929 (95% CI, 0.884–0.974), with a sensitivity of 82.26% and a specificity of 94.37% at a cut-off probability of >0.55 (Figure 4, Table 3).
Data Availability statement:
Raw data for this study will be uploaded as a Supplementary File.
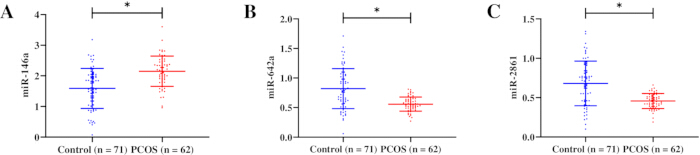
Figure 1: Serum miRNA expression in PCOS and healthy controls. (A) Relative expression of miR-146a. (B) Relative expression of miR-642a. (C) Relative expression of miR-2861. *p < 0.05. This figure compares the serum expression levels of miR-146a, miR-642a, and miR-2861 between women with PCOS and healthy controls, with between-group differences assessed using the independent-samples t test. Please click here to view a larger version of this figure.
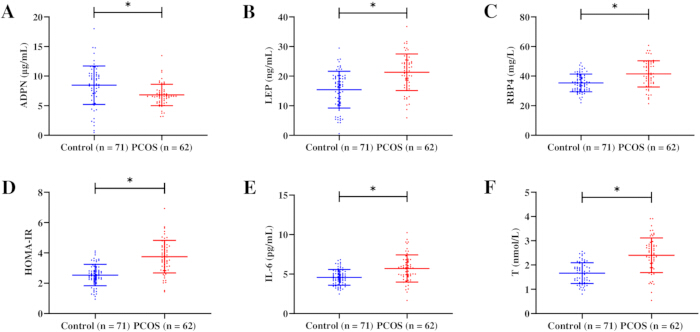
Figure 2: Serum metabolic markers in PCOS and healthy controls. (A) Serum ADPN. (B) Serum LEP. (C) RBP4. (D) HOMA-IR. (E) Serum IL-6. (F) Serum T. *p < 0.05. This figure compares serum ADPN, LEP, RBP4, HOMA-IR, IL-6, and T levels between women with PCOS and healthy controls, with between-group differences assessed using the independent-samples t test. Please click here to view a larger version of this figure.
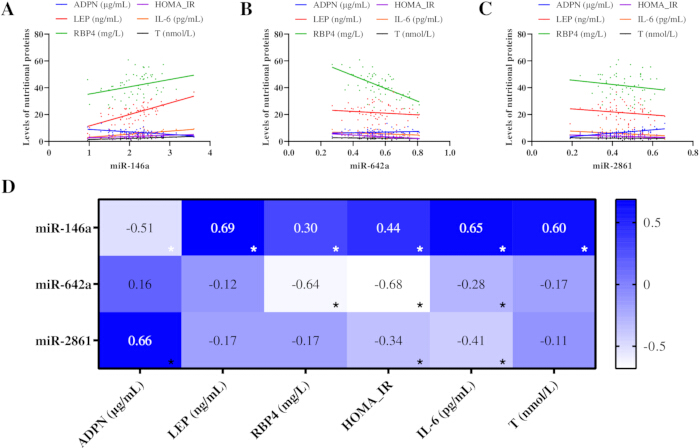
Figure 3: Correlations between serum miRNAs and metabolic markers in PCOS. (A) Scatterplots with fitted linear regression lines showing the relationships of miR-146a with ADPN, LEP, RBP4, HOMA-IR, IL-6, and T. (B) miR-642a with ADPN, LEP, RBP4, HOMA-IR, IL-6, and T. (C) miR-2861 with ADPN, LEP, RBP4, HOMA-IR, IL-6, and T. (D) Heatmap of Pearson correlation coefficients. *p < 0.05. This figure presents the relationships between the three serum miRNAs and six metabolic markers in women with PCOS, with correlations evaluated using Pearson correlation analysis. Please click here to view a larger version of this figure.
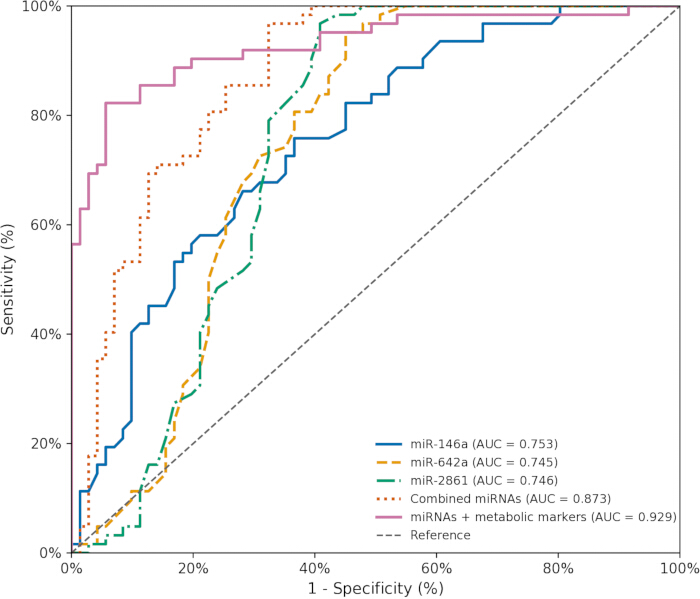
Figure 4: Diagnostic performance of serum biomarkers for PCOS. The area under the curve for each marker or model is shown in the legend. This figure compares the diagnostic performance of individual miRNAs and combined biomarker models for PCOS using ROC curve analysis, with the combined models constructed by binary logistic regression. Please click here to view a larger version of this figure.
Table 1: Primer sequences used for quantitative real-time PCR analysis. This table lists the forward and reverse primer sequences used for qRT-PCR measurement of the three miRNAs and U6 snRNA, and no statistical analysis was applicable. Please click here to download this file.
Table 2: Baseline characteristics of the study population. This table compares the demographic and clinical characteristics of the PCOS and control groups, with continuous variables analyzed using the independent-samples t test and categorical variables using the χ2 test or Fisher’s exact test. Please click here to download this file.
Table 3: Diagnostic performance of biomarkers for PCOS. This table summarizes the cut-off values, AUCs, 95% confidence intervals, sensitivities, and specificities of individual and combined biomarkers, with diagnostic performance evaluated using ROC analysis and combined models constructed using binary logistic regression. Please click here to download this file.
Supplementary Table 1: Assay stability under different sample conditions. This table summarizes the coefficients of variation for the measured miRNAs and biochemical markers under different sample processing and storage conditions. Please click here to download this file.
Supplementary Table 2: Precision of miRNA and biochemical marker measurements. This table summarizes the intra-assay and inter-assay coefficients of variation for the measured miRNAs and biochemical markers. Please click here to download this file.
Supplementary Table 3: Agreement between analytical methods. This table summarizes the agreement between the primary and alternative analytical methods for the measured miRNAs and biochemical markers. Please click here to download this file.
Supplementary Table 4: BMI-stratified miRNA-marker correlations in PCOS. This table summarizes correlations between serum miRNAs and metabolic markers in non-obese and obese women with PCOS and the statistical comparison of correlation coefficients between BMI subgroups. Please click here to download this file.
Discussion
Using standardized serum biochemical assays and qRT-PCR, this study analyzed serum samples from 62 patients with PCOS and 71 healthy controls. We found a characteristic pattern of dysregulated miRNA and nutrition-related protein expression in PCOS, together with significant post-transcriptional associations between the two. All experiments underwent rigorous methodological validation. The precision, stability, and inter-method agreement of the detection system all met the standards expected of a high-quality laboratory, which supports the reliability of the present findings.
The biochemical hallmarks of PCOS include chronic low-grade inflammation and insulin resistance, and this abnormal metabolic microenvironment is an important driver of disordered nutrition-related protein expression15,16. As the body’s largest endocrine organ, adipose tissue secretes nutrition-related proteins that regulate systemic metabolic homeostasis through autocrine, paracrine, and endocrine actions17. In the present study, serum ADPN levels were lower in patients with PCOS than in controls, whereas LEP and RBP4 levels were elevated. A potential explanation is that ADPN promotes glucose uptake and fatty acid oxidation by activating the AMPK pathway; therefore, a decrease in ADPN expression can significantly impair insulin sensitivity18. In contrast, elevated RBP4 has been linked to insulin resistance, and experimental evidence indicates that RBP4 can attenuate insulin-stimulated IRS1 phosphorylation in primary human adipocytes19,20.
miRNAs are important regulators of gene expression after transcription. They work by binding to the 3' untranslated region of target mRNAs, which prevents translation. The correlation analysis showed that miR-642a had the strongest negative correlation with RBP4. Therefore, the reduced presence of miR-642a in the context of PCOS could help explain the increased levels of RBP4. Furthermore, a positive correlation was found between miR-2861 and ADPN. This finding suggests a potential relationship between miR-2861 and ADPN regulation, although the underlying mechanism remains to be determined. The strong positive correlation between miR-146a and LEP could be due to a positive feedback loop that occurs during chronic inflammation. Increased levels of miR-146a can specifically promote the release of inflammatory cytokines. These cytokines then stimulate adipocytes to produce LEP, as shown in reference21. Although several miRNA–marker correlations differed nominally between BMI strata, none remained significant after false-discovery-rate correction; the subgroup findings should therefore be considered exploratory, particularly given the modest sample sizes.
The reported expression levels of nutrition-related proteins are not entirely uniform across different studies, a discrepancy largely attributable to variations in assay standardization. Prior investigations, for example, have employed ELISA kits that exhibited insufficient quality control, thereby resulting in increased variability in the obtained measurements22. Moreover, the stability of nutrition-related proteins can be significantly affected by factors such as centrifugation conditions, storage duration, and repeated freeze–thaw cycles23. Consequently, this research undertook a systematic validation and meticulous control of these methodological variables. The within-day and between-day CV values for all indicators were below 4.0%, and the influence of sample processing remained within the acceptable range24. On that basis, the data obtained in this study should be more reliable and more comparable.
Finally, we found that the combined detection of miRNAs and nutrition-related proteins performed better diagnostically than any single biomarker alone. Biochemically, this is understandable because these markers reflect different aspects of PCOS pathogenesis: miRNAs capture abnormalities in post-transcriptional regulation, whereas nutrition-related proteins reflect the functional state of metabolic pathways25,26. By integrating markers from multiple biochemical pathways, it becomes possible to characterize the molecular features of the disease more comprehensively and thereby improve diagnostic accuracy. From the perspective of laboratory testing, serum miRNA and nutrition-related protein assays are both noninvasive, rapid, and suitable for batch analysis, suggesting real potential for translation into routine clinical testing27. Beyond diagnostic assessment, this biomarker panel could be evaluated longitudinally to monitor metabolic and inflammatory responses to dietary, lifestyle, or pharmacological interventions. The observed miRNA–protein associations also provide hypotheses for testing miRNA mimics or inhibitors, although their therapeutic relevance requires direct mechanistic evaluation together with assessment of delivery, off-target effects, and safety.
Several limitations should nonetheless be acknowledged. First, this study measured only the total serum expression levels of nutrition-related proteins and did not examine differences in post-translational modifications such as phosphorylation or glycosylation, even though such modifications often determine biological activity28. Second, this was an observational study, and no cell or animal experiments were performed to directly verify the targeted regulatory effects of miRNAs on nutrition-related proteins; the mechanistic inferences drawn here therefore still require further functional validation. Finally, the expression of nutrition-related proteins in different tissues was not assessed, so their tissue-source specificity could not be determined. Further investigation is needed to address these issues in a more systematic and thorough way. The absence of spectrophotometric RNA concentration and purity data for the archived serum RNA preparations should also be considered when interpreting the qRT-PCR findings.
This study identified coordinated alterations in serum miR-146a, miR-642a, miR-2861, ADPN, LEP, RBP4, HOMA-IR, IL-6, and T in women with PCOS. Several miRNA–metabolic marker correlations were observed, and a combined model showed stronger discriminatory performance than the individual biomarkers. These findings support further external validation and functional investigation but do not establish direct molecular regulation or causality.
Disclosures
The authors declare no conflicts of interest.
Materials
| Name | Company | Catalog Number | Comments |
|---|---|---|---|
| -80 °C ultra-low temperature freezer | Thermo Fisher (USA) | Forma 900 | Long-term low-temperature storage of serum samples |
| Adiponectin (ADPN) ELISA kit | R&D Systems (USA) | DY1065 | Quantitative detection of serum ADPN concentration |
| Automatic biochemical analyzer | Beckman Coulter (USA) | AU5800 | Detection of fasting blood glucose, insulin, and glycated hemoglobin |
| Automatic microplate reader | Tecan (Switzerland) | Infinite M200 Pro | Absorbance measurement at 450 nm for ELISA experiments |
| Blood glucose detection kit | Beckman Coulter (USA) | A11A01 | Detection of serum fasting glucose by glucose oxidase method |
| Cobas e601 chemiluminescence immunoassay analyzer | Roche (Germany) | Cobas e601 | Electrochemiluminescence detection of serum testosterone and IL-6 |
| Enzyme-free cryopreservation tube | Axygen (USA) | MCT-150-C | Serum sample aliquoting, -80 °C ultra-low temperature storage |
| Eppendorf Research plus Pipette | Eppendorf (Germany) | Research plus 0.5-1,000 μL | Serum aspiration, RNA/reagent pipetting, sample aliquoting |
| Glycated hemoglobin (HbA1c) kit | Beckman Coulter (USA) | A11A03 | Detection of serum HbA1c by high-performance liquid chromatography |
| IL-6 detection kit | Roche (Germany) | 5200057190 | Quantification of serum interleukin-6 |
| Insulin detection kit | Beckman Coulter (USA) | A11A02 | Detection of serum fasting insulin by immunoturbidimetry |
| Leptin (LEP) ELISA kit | R&D Systems (USA) | DY398 | Quantitative detection of serum LEP concentration |
| Low-temperature high-speed centrifuge | Xiangyi Instrument (China) | TDZ5-WS | Centrifugation of samples at the specified centrifugal forces |
| miScript SYBR Green PCR Kit | Qiagen (Germany) | 218073 | Methodological consistency verification for miRNA detection |
| PrimeScript RT Reverse Transcription Kit | TaKaRa (Japan) | RR036A | miRNA reverse transcription to synthesize cDNA |
| Real-time fluorescence quantitative PCR instrument | Applied Biosystems (USA) | 7500 | miRNA qRT-PCR amplification and fluorescence detection |
| Retinol binding protein 4 (RBP4) ELISA kit | R&D Systems (USA) | DY6005 | Quantitative detection of serum RBP4 concentration |
| SPSS statistical software | IBM (USA) | 25 | Data normality test, inter-group comparison, correlation, and ROC analysis |
| SYBR Premix Ex Taq II Kit | TaKaRa (Japan) | RR420A | miRNA fluorescence quantitative PCR amplification |
| Testosterone (T) detection kit | Roche (Germany) | 5200067190 | Quantification of serum testosterone levels |
| TRIzol total RNA extraction reagent | Invitrogen (USA) | 15596026 | Total RNA extraction from serum samples |
| Vacuum blood collection tube without anticoagulant | BD Biosciences (USA) | 367812 | Collects fasting cubital vein blood for serum separation |
References
- Stener-Victorin E, et al. Polycystic ovary syndrome. Nat Rev Dis Primers. 2024;10(1):27.
- Dokras A, Luque-Ramírez M, Escobar-Morreale HF. Polycystic ovary syndrome: origins and implications: Long-term health outcomes in polycystic ovary syndrome. Reproduction. 2025;170(2):e250118.
- Ma YC, Law KS, Wang WS, Chang HM. Phenotypic variations in polycystic ovary syndrome: metabolic risks and emerging biomarkers. J Endocrinol. 2025;267(1):e250226.
- Nandi A, Singh K, Sharma K. Advancement in early diagnosis of polycystic ovary syndrome: biomarker-driven innovative diagnostic sensor. Mikrochim Acta. 2025;192(5):331.
- Qu J, Lin Z. Autophagy regulation by crosstalk between miRNAs and ubiquitination system. Int J Mol Sci. 2021;22(21):11912.
- Bell-Hensley A, Das S, McAlinden A. The miR-181 family: wide-ranging pathophysiological effects on cell fate and function. J Cell Physiol. 2023;238(4):698-713.
- Wei R, et al. Qingfei Litan decoction alleviated Klebsiella pneumoniae-induced pneumonia by targeting the TLR4/MyD88/NF-κB axis via miR-146a-5p. J Ethnopharmacol. 2025;349:119947.
- Beveridge DJ, et al. The tumor suppressor miR-642a-5p targets Wilms tumor 1 gene and cell-cycle progression in prostate cancer. Sci Rep. 2021;11(1):18003.
- Yu K, Cui S, Xue T. LncRNA MIR22HG is downregulated in adenomyosis and upregulates miR-2861 through demethylation to inhibit endometrial cell proliferation. J Obstet Gynaecol Res. 2021;47(5):1837-1845.
- Orszulak D, et al. Adipokines as biochemical marker of polycystic ovary syndrome in adolescents - review. Front Endocrinol (Lausanne). 2025;16:1475465.
- Koleva-Tyutyundzhieva D, Ilieva-Gerova M, Deneva T, Orbetzova M. Metabolic and inflammatory adipokine profiles in PCOS: a focus on adiposity, insulin resistance, and atherogenic risk. Int J Mol Sci. 2025;26(19):9702.
- Dymanowska I, et al. MicroRNAs as biomarkers for metabolic disorders in polycystic ovary syndrome (PCOS): a review. Med Sci Monit. 2024;30:e946480.
- Ramaswamy P, et al. Circulating cell-free microRNAs in women with polycystic ovary syndrome: advancing towards biomarker discovery and therapeutic targets. Reprod Sci. 2025;32(7):2137-2179.
- Teede HJ, et al. Recommendations from the 2023 international evidence-based guideline for the assessment and management of polycystic ovary syndrome. J Clin Endocrinol Metab. 2023;108(10):2447-2469.
- Szukiewicz D, Trojanowski S, Kociszewska A, Szewczyk G. Modulation of the inflammatory response in polycystic ovary syndrome (PCOS): searching for epigenetic factors. Int J Mol Sci. 2022;23(23):14663.
- Kim JJ. Obesity and polycystic ovary syndrome. J Obes Metab Syndr. 2024;33(4):289-301.
- Gu X, Wang L, Liu S, Shan T. Adipose tissue adipokines and lipokines: functions and regulatory mechanism in skeletal muscle development and homeostasis. Metabolism. 2023;139:155379.
- Abdalla MMI. Therapeutic potential of adiponectin in prediabetes: strategies, challenges, and future directions. Ther Adv Endocrinol Metab. 2024;15:20420188231222371.
- Yang Q, et al. Serum retinol binding protein 4 contributes to insulin resistance in obesity and type 2 diabetes. Nature. 2005;436(7049):356-362.
- Ost A, et al. Retinol-binding protein-4 attenuates insulin-induced phosphorylation of IRS1 and ERK1/2 in primary human adipocytes. FASEB J. 2007;21(13):3696-3704.
- Zhu F, et al. MiR-146a alleviates inflammatory bowel disease in mice through systematic regulation of multiple genetic networks. Front Immunol. 2024;15:1366319.
- Aydin S, et al. An overview of ELISA: a review and update on best laboratory practices for quantifying peptides and proteins in biological fluids. J Int Med Res. 2025;53(2):3000605251315913.
- Candia J, et al. Effects of in vitro hemolysis and repeated freeze-thaw cycles in protein abundance quantification using the SomaScan and Olink assays. J Proteome Res. 2025;24(5):2517-2528.
- Liang X, et al. Quality assessment from biobank plasma and serum specimens: a systematic review. PeerJ. 2025;13:e20122.
- Singh I, Moar K, Maurya PK. Diagnostic and prognostic biomarkers in polycystic ovary syndrome. Clin Chim Acta. 2025;576:120425.
- Hadi S, et al. Extracellular fluid miRNAs in PCOS. Clin Chim Acta. 2025;576:120404.
- Insenser M, et al. Validation of circulating microRNAs miR-142-3p and miR-598-3p in women with polycystic ovary syndrome as potential diagnostic markers. Hum Reprod. 2023;38(5):951-960.
- Schofield LC, Dialpuri JS, Murshudov GN, Agirre J. Post-translational modifications in the Protein Data Bank. Acta Crystallogr D Struct Biol. 2024;80(Pt 9):647-660.