Here, we present a reproducible protocol for developing and evaluating explainable artificial intelligence models for healthcare analytics. The workflow integrates data preprocessing, predictive modeling, SHAP-, LIME-, and Grad-CAM-based explainability, quantitative evaluation, and human-centered validation to support transparent and trustworthy clinical decision-making.
A subscription to JoVE is required to view this content. Sign in or start your free trial.
Research Article
A Reproducible Protocol for Developing and Evaluating Explainable Artificial Intelligence Frameworks in Healthcare Analytics
In This Article
Summary
Abstract
Explainable Artificial Intelligence (XAI) is increasingly recognized as an indispensable tool for building trustworthy AI systems in healthcare, where transparency and the ability to explain decisions are essential components of clinical decision-making. This publication presents a reproducible experimental approach to developing and evaluating explainable AI systems for healthcare analytics. The developed pipeline integrates the steps of data preprocessing, predictive modeling, interpretation generation, and evaluation into one seamless workflow that can be applied to both structured clinical data and medical imaging datasets. Ensemble machine learning models have demonstrated strong predictive performance on structured tabular datasets, whereas deep learning models are effective for learning complex patterns in medical imaging data. Techniques such as SHAP, LIME, and Grad-CAM are global and local explanations that facilitate model interpretation. Very helpful. The quantitative assessment of the framework spans many different metrics such as accuracy, precision, recall, F1 score, ROC-AUC, explanation metrics, fidelity, and stability. The results indicate that when the experimental conditions are controlled, the framework demonstrated improved predictive performance and explanation quality under the evaluated experimental conditions. As a document guided by protocol, this piece of work backs the reproducibility and scalability, the persistent implementation by other living beings. This transparent, understandable AI model is the foundation upon which clinical decision-making support and healthcare analytics systems gain trust and usage on a large scale.
Introduction
Artificial intelligence (AI) has become an important component of modern healthcare by supporting disease diagnosis, prognosis, risk stratification, medical image analysis, and clinical decision-making1. Advances in machine learning and deep learning have enabled healthcare systems to process large volumes of structured and unstructured data, often achieving predictive performance comparable to or exceeding conventional statistical approaches2. Despite these advances, many AI models operate as complex black-box systems, making it difficult for clinicians and healthcare stakeholders to understand how predictions are generated3. This lack of transparency can limit trust, adoption, and accountability in high-stakes healthcare environments4,5.
Explainable artificial intelligence (XAI) has emerged as a promising approach for improving the transparency and interpretability of machine learning models6. Widely used explanation techniques, including SHAP (Shapley additive explanations), LIME (Local interpretable model-agnostic explanations), and Gradient-weighted class activation mapping (Grad-CAM), provide insights into model behavior through feature attribution and visual explanation mechanisms7,8,9. These methods have been increasingly applied to healthcare applications to support clinical interpretation, model auditing, and decision support10,11. However, explainability alone does not guarantee reliability, reproducibility, or clinical utility. Recent studies have highlighted challenges related to explanation instability, sensitivity to perturbations, limited clinician validation, and inconsistencies between explanation outputs and true model reasoning12,13,14,15.
In addition to explainability challenges, reproducibility remains a significant concern in healthcare machine learning research16,17,18. Many published studies provide limited information regarding preprocessing procedures, software environments, hyperparameter configurations, validation strategies, and implementation workflows, making independent replication difficult19,20,21. Furthermore, healthcare AI studies frequently focus on predictive performance while providing limited guidance regarding explanation quality assessment, clinician-centered evaluation, and practical implementation considerations22. These limitations may hinder the translation of explainable AI systems from research environments to real-world healthcare settings23,24,25,26,27.
Current healthcare XAI workflows often evaluate individual explanation techniques or predictive models in isolation and rarely provide standardized protocols that integrate data preparation, predictive modeling, explainability assessment, human-centered evaluation, and reproducibility resources28,29,30,31. Consequently, researchers and practitioners may encounter difficulties when reproducing workflows, comparing explanation methods, or evaluating the practical utility of explainable AI systems across different healthcare datasets and application domains. A comprehensive and reproducible protocol is therefore needed to facilitate consistent implementation, evaluation, and reporting of healthcare explainable AI workflows32,33,34,35.
Here, we present a reproducible protocol for developing, evaluating, and interpreting explainable artificial intelligence systems in healthcare analytics. The protocol integrates data preprocessing, predictive modeling, explainability assessment using SHAP, LIME, and Grad-CAM, clinician-centered evaluation, validation procedures, and reproducibility resources within a unified workflow. The objective is to provide a standardized framework that supports transparent model development, explanation quality assessment, and reproducible implementation across diverse healthcare datasets36,37,38,39. The methodological contribution of this work lies in the integration of predictive analytics, explainability evaluation, clinician validation, and reproducibility practices into a single protocol suitable for healthcare AI research, education, and deployment-oriented studies40,41,42,43.
The primary contribution of this work is not the development of a novel explainability algorithm.
Rather, it provides a standardized, reproducible, and experimentally validated protocol that integrates predictive modeling, explainability assessment, visualization, evaluation, and human-centered interpretation into a unified workflow suitable for healthcare analytics and JoVE-based protocol dissemination. The primary objective of this work is not to introduce a novel predictive algorithm but to provide a standardized, reproducible, and experimentally validated protocol for implementing explainable artificial intelligence workflows in healthcare analytics. The protocol integrates data preprocessing, predictive modeling, explainability assessment, clinician-centered evaluation, and reproducibility resources into a unified framework suitable for adoption, replication, and educational dissemination.
Access restricted. Please log in or start a trial to view this content.
Protocol
All datasets used in this study were obtained from publicly available and fully anonymized repositories, including the UCI Machine Learning Repository, PhysioNet MIMIC-III database, and NIH Chest X-ray datasets. No identifiable patient information was accessed. The study complied with institutional research ethics guidelines for secondary analysis of publicly available de-identified data. Formal Institutional Review Board approval was not required because no human participants were directly recruited and no protected health information was used.
1. Overview of the Experimental Frameworks
- Develop a reproducible, explainable artificial intelligence (XAI) pipeline for transparent healthcare analytics. Organize the workflow into the Data Layer, Preprocessing Layer, Modeling Layer, Explainability Layer, Evaluation Layer, and Visualization Layer.
- Integrate these modules into a unified workflow capable of processing structured clinical data, electronic health records, and medical imaging datasets.
- Ensure that each module contributes to reproducibility, interpretability, scalability, and standardized experimental execution.
- Design the modular architecture to support continuous data streaming and ensure that each stage of the pipeline contributes to reproducibility, interpretability, and scalability throughout the experimental workflow.
2. Computational Environment and System Configuration
- Install the required software dependencies before executing the workflow by opening a command-line terminal and running the following command:
pip install numpy pandas scikit-learn tensorflow shap lime opencv-python matplotlib seaborn - Verify the successful installation of all software packages and confirm compatibility with the software versions listed in the Table of Materials before proceeding with data preprocessing and model development.
- Use Python 3.11 as the primary programming environment. Install and configure NumPy 1.26 and Pandas 2.1 for data manipulation and feature engineering tasks. Install Scikit-learn 1.5 for machine learning model development and evaluation.
- Install TensorFlow 2.15 for deep learning model training and inference. Install SHAP 0.46 and LIME 0.2.0 for explainability analysis. Install OpenCV 4.10 for image processing tasks. Install Matplotlib 3.9 and Seaborn 0.13 for data visualization and result reporting. Refer to the Table of Materials for complete software specifications and implementation details required for reproducibility.
- Configure the computational environment using a workstation equipped with a multi-core processor, graphics processing unit (GPU) acceleration, and sufficient memory resources to accommodate large healthcare datasets and deep learning workloads.
- Set fixed random seeds for data partitioning, model initialization, and training procedures to ensure reproducibility across experimental runs. Enable logging mechanisms to record data preprocessing operations, model configurations, hyperparameter settings, training procedures, and evaluation results throughout the workflow.
- Configure the model architectures, optimization parameters, learning rates, batch sizes, training settings, and hyperparameter values according to the specifications summarized in Table 1. Adhere to these settings during replication experiments to ensure consistency with the reported results.
- Expected Output- A fully configured and reproducible computational environment with all required software packages, hardware resources, logging mechanisms, and model configuration settings available for subsequent data preprocessing, model development, explainability analysis, and evaluation procedures.
| Component | Parameter | Value | Description |
| Random Forest | n_estimators | 100 | Number of trees |
| Random Forest | max_depth | None | Tree depth |
| XGBoost | learning_rate | 0.01 | Learning rate |
| XGBoost | n_estimators | 100 | Boosting rounds |
| CNN | epochs | 25 | Training epochs |
| CNN | batch_size | 32 | Batch size |
| CNN | optimizer | Adam | Optimization algorithm |
| MLP | hidden_layers | 2 | Number of hidden layers |
| MLP | activation | ReLU | Activation function |
| General | train_split | 70% | Training data ratio |
| General | validation_split | 15% | Validation ratio |
| General | test_split | 15% | Testing ratio |
Table 1: Implementation Details and Hyperparameter Configuration.
This table summarizes the computational environment, software libraries, machine learning and deep learning model configurations, optimization settings, learning rates, batch sizes, training parameters, and hyperparameter values used throughout the experimental evaluation of the proposed explainable AI framework.
3. Dataset Preparation and Preprocessing
- Select publicly available healthcare datasets to ensure transparency and reproducibility of the experimental workflow.;
- Use four representative healthcare scenarios to validate the proposed framework: (i) breast cancer diagnosis using the Wisconsin Breast Cancer Dataset, (ii) diabetes risk prediction using the Pima Indians Diabetes Dataset, (iii) clinical outcome prediction using MIMIC-III electronic health records, and (iv) thoracic disease classification using the NIH Chest X-ray Dataset. Choose these datasets to evaluate the framework across structured clinical records, longitudinal electronic health records, and medical imaging modalities commonly used in healthcare decision-support systems.
- Import each dataset into the Python environment and separate the records into input features and target variables. Organize structured clinical data for disease prediction tasks, electronic health records for longitudinal outcome analysis, and medical imaging datasets for diagnostic classification tasks. Verify the integrity of each dataset before proceeding with preprocessing operations.
- Identify and address missing values using appropriate imputation techniques. Standardize numerical features through feature scaling and normalization procedures to ensure comparability across variables.
- Encode categorical variables using suitable encoding methods based on dataset characteristics. Perform feature selection using correlation analysis and model-based feature importance measures to identify the most relevant variables and reduce data dimensionality.
- Resize all medical images to 224, 224 pixels prior to model training. Normalize pixel intensity values according to the requirements of the selected deep learning architecture. Apply data augmentation techniques, including image rotation and horizontal flipping, to improve model generalization and reduce overfitting. Verify image quality and ensure consistency of image dimensions throughout the dataset.
- Assess data integrity by evaluating dataset completeness, consistency, and feature-label alignment. Verify that all records are correctly assigned to their corresponding target classes. Review dataset characteristics, including sample size, feature count, and data modality, as summarized in Table 2.
- Implement dataset-specific validation procedures to ensure methodological rigor and reproducibility. Record the sample size, class distribution, train-validation-test split strategy, leakage prevention measures, hyperparameter optimization procedures, cross-validation design, and external testing protocol for each dataset. Summarize these validation procedures in Table 3.
- Perform preprocessing quality-control checks by assessing missing-value handling, outlier removal, feature scaling, categorical encoding, class distribution preservation, and dataset partitioning procedures. Verify that preprocessing operations are applied consistently across all datasets.
- Confirm the absence of substantial data leakage during dataset partitioning. Review the preprocessing validation results presented in Figure 1 to ensure that standardized datasets have been generated for subsequent machine learning and explainability analyses.
- Expected Output- Generate cleaned and standardized datasets with missing values appropriately addressed, categorical variables encoded, numerical features normalized, and records partitioned into training, validation, and testing subsets. Ensure that dataset characteristics, class distributions, and validation procedures correspond to those reported in Table 2 and Table 3, and confirm successful preprocessing validation as illustrated in Figure 1.
| Dataset | Type | Samples | Features | Target |
| Breast Cancer | Tabular | 569 | 30 | Benign/Malignant |
| Diabetes | Tabular | 768 | 8 | Diabetes Outcome |
| MIMIC-III | EHR | ~60,000 | Clinical Variables | Mortality |
| Chest X-ray | Imaging | ~112,000 | Images | Disease Labels |
Table 2: Dataset Characteristics and Healthcare Use Cases.
This table provides a summary of the healthcare datasets used in the study, including dataset type, number of samples, feature count, target variables, healthcare application domain, and associated clinical use cases. The datasets encompass structured clinical records, electronic health records, and medical imaging data to demonstrate framework applicability across diverse healthcare analytics scenarios.
| Dataset | Sample Size | Class Distribution | Split Strategy | Leakage Prevention | Hyperparameter Search | Cross Validation | External Test |
| Breast Cancer (UCI Wisconsin) | 569 | 357 Benign / 212 Malignant | 70/15/15 | Train-only preprocessing | Grid Search | 5-Fold Stratified CV | Independent Holdout Set |
| Pima Indians Diabetes | 768 | 500 Non-Diabetic / 268 Diabetic | 70/15/15 | Train-only preprocessing | Grid Search | 5-Fold Stratified CV | Independent Holdout Set |
| MIMIC-III EHR | 5274 | Outcome-stratified cohorts | 70/15/15 Patient-level | Patient-level separation | Random Search | 5-Fold Patient-level CV | Independent Holdout Set |
| NIH Chest X-ray | 112120 | Pneumonia/Normal stratified | 70/15/15 | Image-level separation | Random Search | 5-Fold Stratified CV | Independent Holdout Set |
Table 3: Dataset-Level Validation and Experimental Design.
This table summarizes the validation methodology employed for each dataset, including sample size, class distribution, train-validation-test split strategy, leakage prevention procedures, hyperparameter optimization methods, cross-validation design, and external testing protocols. These measures were implemented to ensure methodological rigor, reproducibility, and unbiased model evaluation.
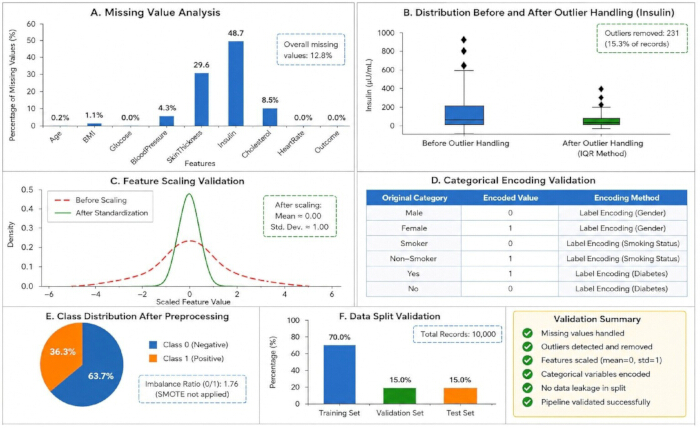
Figure 1: Validation of Data Preprocessing Pipeline.
Validation results for key preprocessing operations performed before model development. (A) Missing-value analysis across representative healthcare features. (B) Distribution of a numerical variable before and after outlier handling. (C) Feature scaling validation using standardization. (D) Categorical encoding validation. (E) Class distribution following preprocessing. (F) Validation of train-validation-test data partitioning. These results confirm successful preprocessing and preparation of the datasets for predictive modeling and explainability analysis. Please click here to view a larger version of this figure.
4. System Architecture of the Explainable AI Framework
- Organize the framework using a layered architecture to facilitate modular processing, improve workflow transparency, and support reproducible implementation. Configure the Data Layer to receive and manage raw healthcare datasets. Route all incoming datasets through the Data Layer before initiating preprocessing operations.
- Perform data cleaning, transformation, normalization, feature engineering, and encoding procedures within the Preprocessing Layer. Ensure that all preprocessing operations are completed before model development.
- Develop predictive models within the Modeling Layer using machine learning and deep learning algorithms. Train Gradient Boosting, Random Forest, Multilayer Perceptron (MLP), and Convolutional Neural Network (CNN) models using the preprocessed datasets and optimized hyperparameter configurations.
- Apply explainability techniques within the Explainability Layer to interpret model predictions. Generate feature-attribution explanations using SHAP and LIME for structured datasets. Generate Grad-CAM heatmaps for image-based models to visualize regions contributing to model predictions.
- Evaluate predictive and explainability performance within the Evaluation Layer. Calculate accuracy, precision, recall, F1-score, ROC-AUC, fidelity, stability, and clinician-centered evaluation metrics. Record all evaluation outputs for subsequent analysis and reporting.
- Generate clinically interpretable visual outputs within the Visualization Layer. Create performance comparison plots, feature-importance visualizations, SHAP summary plots, LIME explanations, Grad-CAM heatmaps, and clinician-oriented reporting dashboards. Store all visual outputs for inclusion in the final experimental report.
- Review the complete framework architecture illustrated in Figure 2 before proceeding with workflow execution.
- Expected Output- Generate fully trained machine learning and deep learning models, including Gradient Boosting, Random Forest, CNN, and MLP architectures. Store model configurations, optimized hyperparameters, training logs, checkpoint files, explainability outputs, and visualization artifacts for subsequent evaluation and interpretability analysis.
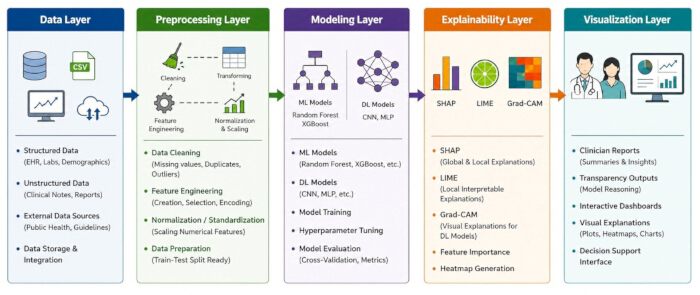
Figure 2: System Architecture of the Explainable AI Framework for Healthcare Analytics. Please click here to view a larger version of this figure.
5. Workflow Execution
- Acquire healthcare datasets from publicly available repositories and store the datasets in structured formats suitable for machine learning and deep learning analysis. Review the complete workflow illustrated in Figure 3 before initiating the experimental procedure.
- Perform data cleaning and preprocessing according to the procedures described in Section 3. Normalize numerical variables using appropriate scaling methods. Encode categorical variables using suitable encoding techniques. Identify and impute missing values using dataset-specific imputation strategies. Verify data quality, feature-label alignment, and dataset completeness before proceeding with model development.
- Partition each dataset into training, validation, and testing subsets to support unbiased model evaluation. Preserve class distributions during dataset partitioning and implement leakage-prevention measures where applicable. Reserve the testing subset exclusively for final model evaluation.
- Train machine learning models on structured datasets using ensemble-based algorithms, including Gradient Boosting and Random Forest. Train deep learning models on imaging datasets using Convolutional Neural Network (CNN) architectures capable of learning spatial image features. Update model parameters iteratively during training and monitor validation performance after each training epoch. Apply early stopping when validation performance deteriorates or fails to improve according to the predefined stopping criteria.
- Optimize model hyperparameters using systematic search strategies, including grid search and randomized search. Adjust learning rate, number of estimators, tree depth, batch size, number of epochs, and other model-specific parameters according to validation performance. Select the final model based on predictive performance and generalization capability across validation datasets.
- Apply explainability methods after completing model training. Generate global explanations using feature-attribution techniques to identify variables contributing most strongly to model predictions. Generate local explanations to analyze individual prediction cases and evaluate model behavior at the sample level. Create Grad-CAM heatmaps for image classification models to highlight regions of the image that contribute to the predicted outcome. Store all explanation outputs for subsequent analysis and reporting.
- Evaluate predictive performance using accuracy, precision, recall, F1-score, and receiver operating characteristic area under the curve (ROC-AUC). Assess explanation quality using fidelity and stability metrics to evaluate explanation reliability and consistency. Compare model performance across datasets and explainability methods to assess framework robustness and generalizability.
- Generate visualization outputs and analytical reports to communicate results in a clinically interpretable manner. Create performance comparison charts, feature-importance plots, SHAP summary visualizations, LIME explanation outputs, Grad-CAM heatmaps, and other clinically relevant visualizations. Review all visual outputs to ensure clarity and consistency before reporting.
- Document all preprocessing operations, model configurations, hyperparameter settings, explainability procedures, validation strategies, and evaluation results. Maintain detailed experimental records to facilitate reproducibility and independent replication of the workflow. Verify consistency of results across repeated experimental runs and archive all workflow artifacts for future reference.
- Expected Output- Generate a fully trained predictive model with optimized hyperparameters, saved model weights, training logs, performance metrics, and explainability outputs, including SHAP explanations, LIME explanations, and Grad-CAM heatmaps. Store all model artifacts, evaluation reports, and visualization outputs for subsequent analysis and reproducibility assessment.
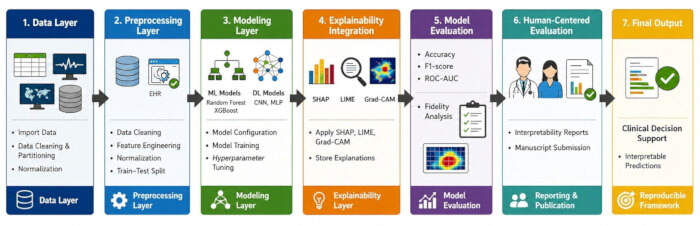
Figure 3: End-to-End Workflow of the Explainable AI Pipeline. Please click here to view a larger version of this figure.
6. Model Evaluation and Explainability Assessment
- Evaluate predictive model performance using standard classification metrics, including accuracy, precision, recall, F1-score, and receiver operating characteristic area under the curve (ROC-AUC). Calculate accuracy to measure overall classification correctness.
- Calculate precision to assess the proportion of correctly identified positive predictions. Calculate recall to evaluate the models ability to identify positive cases. Calculate the F1-score to balance precision and recall. Calculate ROC-AUC to assess discriminative performance across different classification thresholds.
- Apply these evaluation metrics consistently across all datasets and model architectures to facilitate objective performance comparison. Record all metric values and store the evaluation results for subsequent statistical analysis and reporting.
- Assess explainability performance using fidelity and stability metrics. Calculate fidelity to determine the extent to which generated explanations accurately reflect model predictions and decision-making behavior.
- Calculate stability by comparing explanations generated from similar input samples and quantifying the consistency of explanation outputs. Verify that fidelity and stability values meet the predefined quality criteria before interpreting model explanations.
- Compare explainability performance across SHAP, LIME, and Grad-CAM outputs.
- Expected Output- Generate quantitative evaluation results, including accuracy, precision, recall, F1-score, ROC-AUC, fidelity, and stability metrics. Produce explainability outputs and visualizations suitable for scientific reporting, reproducibility assessment, and clinical interpretation.
7. Human-Centered Evaluation
- Recruit 12 healthcare professionals consisting of 6 physicians, 3 radiologists, and 3 clinical data analysts. Select participants with prior experience in clinical decision-making, medical image interpretation, healthcare analytics, or electronic health record review. Obtain informed consent from all participants before initiating the evaluation procedure.
- Randomly select 100 cases from the testing datasets after completion of model training and explainability analysis. Generate two evaluation conditions for each case:
- prediction-only output and
- prediction accompanied by explainability information. Randomize the presentation order of cases and evaluation conditions to minimize presentation bias and learning effects.
- Prepare standardized evaluation forms containing prediction results, explanation outputs, and assessment questionnaires. Present cases individually to participants using a computer-based evaluation interface.
- Instruct participants to review each case independently without discussing responses with other evaluators. Allow participants to complete all evaluations under identical experimental conditions.
- Administer a five-point Likert-scale questionnaire adapted from published explainable artificial intelligence evaluation studies. Instruct participants to rate trust, interpretability, and usability for each reviewed case. Record questionnaire responses electronically and verify completion of all survey items before proceeding to statistical analysis.
- Measure objective indicators of clinical usefulness during the evaluation process. Record decision agreement by comparing participant decisions with the corresponding reference labels or ground-truth outcomes. Calculate decision agreement as the percentage of participant decisions matching the reference outcome.
- Record review time for each case by measuring the interval between case presentation and final response submission. Calculate average review time separately for prediction-only and prediction-with-explanation conditions.
- Calculate mean trust, interpretability, and usability scores across all participants and evaluation cases. Compare scores obtained under prediction-only and prediction-with-explanation conditions.
- Perform paired t-tests after completion of all participant evaluations to determine whether differences in trust, interpretability, usability, decision agreement, and review time are statistically significant. Use a significance threshold of p 0.05 for all statistical comparisons.
- Calculate Fleiss Kappa after collecting responses from all participants to assess inter-rater agreement. Use the aggregated participant ratings to determine the consistency of evaluations across reviewers. Interpret Fleiss Kappa values according to established agreement guidelines and record the resulting agreement statistics.
- Summarize participant demographics, evaluation methodology, questionnaire design, statistical analysis procedures, objective performance measures, and inter-rater agreement results in Table 4.
- Review model outputs under both evaluation conditions and compare participant responses across conditions. Verify that explanations improve trust, interpretability, and usability without negatively affecting decision quality.
- Confirm the consistency of participant assessments using the calculated Fleiss Kappa statistic. Record all evaluation outcomes for subsequent reporting and reproducibility assessment.
- Expected Output- Generate clinician trust scores, interpretability ratings, usability ratings, decision-agreement measures, review-time statistics, paired t-test results, and inter-rater agreement statistics. Produce quantitative evidence describing the clinical usefulness, interpretability, and trustworthiness of the explainable artificial intelligence framework.
| Parameter | Value |
| Experts | 12 |
| Physicians | 6 |
| Radiologists | 3 |
| Clinical Data Analysts | 3 |
| Cases Reviewed | 100 |
| Evaluation Design | Randomized (Prediction-only vs Prediction+Explanation) |
| Survey Instrument | 5-point Likert Scale |
| Trust Assessment | Interpretability, Trust, Usability |
| Statistical Test | Paired t-test (p 0.05) |
| Inter-rater Reliability | Fleiss Kappa |
| Objective Measures | Decision Agreement, Review Time |
Table 4: Human-Centered Evaluation Protocol and Clinician Assessment Design.
This table presents the clinician evaluation framework used to assess the interpretability, trustworthiness, and usability of the explainable AI system. Information regarding participant demographics, case review methodology, survey design, statistical analysis procedures, inter-rater reliability assessment, and objective evaluation measures is summarized.
8. Validation and Reproducibility Assessment
- Perform validation and ablation studies to assess the robustness and reliability of the proposed framework. Identify features with high importance scores using the selected explainability methods. Remove important features incrementally and retrain the predictive models after each feature-removal step.
- Evaluate model performance after each ablation experiment using accuracy, precision, recall, F1-score, and ROC-AUC metrics. Compare the resulting performance values with baseline model performance to determine the contribution of individual features to predictive outcomes.
- Assess explanation stability by generating explanations for similar input samples using SHAP, LIME, and Grad-CAM. Compare explanation outputs across repeated evaluations and quantify consistency using the predefined stability metrics. Verify that explanations remain stable under minor input variations and repeated experimental runs.
- Record all experimental procedures throughout the workflow. Document data preprocessing operations, dataset partitioning procedures, model architectures, hyperparameter settings, training configurations, explainability methods, validation strategies, and evaluation metrics. Store all configuration parameters and experimental outputs in a structured format to facilitate reproducibility and independent verification.
- Review all experimental records to ensure completeness and consistency. Verify that the workflow can be replicated using the documented procedures, configuration files, and software specifications. Maintain a modular workflow structure to facilitate adaptation of the protocol for future studies and support conversion into a video-based experimental protocol consistent with JoVE methodological requirements.
9. Reproducibility Resources
- Execute all experiments using fixed random seeds to ensure reproducible results across repeated runs. Maintain source code, preprocessing scripts, configuration files, environment specifications, model parameters, and visualization scripts within a publicly accessible repository.
- Provide detailed instructions for dataset acquisition, preprocessing, experiment execution, model training, explainability generation, validation procedures, and regeneration of all reported tables and figures. Archive all workflow components required for independent replication, including software specifications, preprocessing workflows, configuration files, dataset access instructions, model checkpoints, and visualization assets.
- Summarize the software resources, preprocessing workflows, configuration files, dataset access instructions, and reproducibility assets used throughout the framework in Table 5.
- Expected Output- Generate a complete reproducible experimental package containing preprocessing scripts, configuration files, trained models, model checkpoints, explainability outputs, validation reports, visualization artifacts, software specifications, and documentation necessary for independent replication and verification of the proposed framework.
| Resource | Description |
| Source Code | Python implementation scripts for data preprocessing, model training, explainability, and evaluation |
| Environment File | requirements.txt containing package dependencies and versions |
| Configuration Files | Model architecture settings, hyperparameters, and experiment configurations |
| Fixed Random Seeds | Seed = 42 used for reproducible experiments |
| Dataset Access Instructions | Links and procedures for acquiring public healthcare datasets |
| Preprocessing Scripts | Scripts for data cleaning, normalization, encoding, and feature selection |
| Figure Generation Scripts | Scripts to regenerate all manuscript figures |
| Table Generation Scripts | Scripts to reproduce reported tables and metrics |
| Example Inputs | Sample datasets and input files |
| Example Outputs | Prediction results, explanations, and evaluation reports |
Table 5: Reproducibility Resources and Experimental Assets.
This table summarizes the resources provided to support experimental reproducibility, including source code, preprocessing scripts, configuration files, environment specifications, dataset access instructions, fixed random seed settings, figure-generation scripts, and example input/output files required for reproducing the reported results.
Access restricted. Please log in or start a trial to view this content.
Results
We thoroughly evaluated the explanatory AI component of our entire pipeline, assessing how well it predicted across different types of healthcare data, including both structured clinical data and medical images. The outcomes indicated consistent predictive performance across the evaluated datasets. Among the models tested, the gradient boosting model achieved the highest accuracy at 97.4%, followed by the random forest model at 94.2%. Deep learning methods applied to image sets achieved 91.3% accuracy, while multi-layer ...
Access restricted. Please log in or start a trial to view this content.
Discussion
This study developed and evaluated a reproducible explainable artificial intelligence (XAI) workflow for healthcare analytics that integrates predictive modeling, explainability assessment, clinician-centered evaluation, and reproducibility resources within a single protocol. The results demonstrated that ensemble-based machine learning models, particularly Gradient Boosting and Random Forest, achieved the highest predictive performance on the evaluated structured healthcare datasets, whereas deep learning models were mo...
Access restricted. Please log in or start a trial to view this content.
Disclosures
The authors declare that they have no competing financial interests or conflicts of interest related to this work. The research was conducted independently without any commercial or financial relationships that could be construed as a potential conflict of interest.
Artificial Intelligence Usage Disclosure
Artificial intelligence tools were used for language refinement, grammar checking, and editorial assistance during manuscript preparation. All scientific content, experimental design, data analysis, interpretation, and final manuscript verification were performed by the authors. The authors reviewed and validated all AI-assisted outputs to ensure accuracy, integrity, and compliance with journal guidelines.
Acknowledgements
The authors would like to thank their respective institutions for providing the necessary infrastructure and research support to carry out this study. The authors also acknowledge the use of publicly available datasets and open-source tools that facilitated the development and evaluation of the proposed explainable AI framework. Special thanks are extended to domain experts who provided valuable insights during the human-centered evaluation phase.
Access restricted. Please log in or start a trial to view this content.
Materials
| Name | Company | Catalog Number | Comments |
|---|---|---|---|
| GPU Workstation | Manufacturer dependent | NA | Training deep learning models |
| Jupyter Notebook | Project Jupyter | Latest stable release | Interactive experiment execution |
| LIME | LIME | Version 0.2.0 | Local interpretable explanations |
| Matplotlib | Matplotlib Project | Version 3.9 | Data visualization |
| MIMIC-III Database | PhysioNet | Version 1.4 | Electronic health record analysis |
| NIH Chest X-ray Dataset | NIH Clinical Center | Public Dataset | Thoracic disease classification |
| NumPy | NumPy Developers | Version 1.26 | Numerical computing and array operations |
| OpenCV | OpenCV Foundation | Version 4.10 | Image preprocessing |
| Pandas | Pandas Development Team | Version 2.1 | Data manipulation and preprocessing |
| Pima Indians Diabetes Dataset | UCI Machine Learning Repository | Public Dataset | Diabetes risk prediction |
| Python 3.11 | Python Software Foundation | Version 3.11 | Primary programming environment |
| Scikit-learn | scikit-learn | Version 1.5 | Machine learning algorithms and evaluation |
| Seaborn | Seaborn | Version 0.13 | Statistical visualization |
| SHAP | SHAP | Version 0.46 | Feature attribution and explainability |
| TensorFlow | TensorFlow | Version 2.15 | Deep learning model development |
| Windows / Ubuntu Linux | Microsoft / Canonical | NA | Operating system |
| Wisconsin Breast Cancer Dataset | UCI Machine Learning Repository | Public Dataset | Breast cancer diagnosis |
References
- Lundberg SM, et al. From local explanations to global understanding with explainable AI for trees. Nat Mach Intell. 2020;2(1):56-67.
- Ribeiro MT, Singh S, Guestrin C. Why should I trust you. Explaining the predictions of any classifier. Presented at: Proceedings of the 22nd ACM SIGKDD International Conference on Knowledge Discovery and Data Mining; 2016. p. 1135-44. doi:10.1145/2939672.2939778.
- Selvaraju RR, et al. Grad-CAM: Visual explanations from deep networks via gradient-based localization. Int J Comput Vis. 2020;128(2):336-59.
- Tjoa E, Guan C. A survey on explainable artificial intelligence: Toward medical XAI. IEEE Trans Neural Netw Learn Syst. 2021;32(11):4793-813.
- Samek W, et al. Explainable AI: Interpreting, Explaining and Visualizing Deep Learning. Springer; Cham; 2019.
- Arrieta AB, et al. Explainable artificial intelligence: Concepts, taxonomies, opportunities and challenges toward responsible AI. Inf Fusion. 2020;58:82-115.
- Holzinger A, et al. Causability and explainability of artificial intelligence in medicine. Wiley Interdiscip Rev Data Min Knowl Discov. 2020;10(5):e1312.
- Topol E. Deep medicine: How artificial intelligence can make healthcare human again. Nat Med. 2020;25:44-56.
- Esteva A, et al. A guide to deep learning in healthcare. Nat Med. 2019;25(1):24-9.
- Rajpurkar P, Chen E, Banerjee O, Topol EJ. AI in health and medicine. Nat Med. 2022;28:31-38.
- Doshi-Velez F, Kim B. Towards a rigorous science of interpretable machine learning. arXiv. 2021. doi:10.48550/arXiv.1702.08608.
- Molnar C. Interpretable Machine Learning. Lulu Press; 2022.
- Rudin C. Stop explaining black box machine learning models for high-stakes decisions and use interpretable models instead. Nat Mach Intell. 2019;1(5):206-15.
- Zhang Q, Zhu S. Visual interpretability for deep learning: A survey. Front Inf Technol Electron Eng. 2020;21:27-39.
- Holzinger A, Biemann C, Pattichis CS, Kell DB. What do we need to build explainable AI systems for the medical domain. arXiv. 2020. Available at: https://arxiv.org/abs/1712.09923.
- McDermott MB, et al. Reproducibility in machine learning for health. Nat Med. 2021;27:1016-23.
- Kelly CJ, et al. Key challenges for delivering clinical impact with AI. BMC Med. 2019;17:195.
- Ahmad MA, Teredesai A, Eckert C. Interpretable machine learning in healthcare. Proc ACM Conf Health Inference Learn. 2021;4:1-7.
- Ghassemi M, Oakden-Rayner L, Beam AL. The false hope of current approaches to explainable AI in healthcare. Lancet Digit Health. 2021;3(11):e745-50.
- Carvalho DV, Pereira EM, Cardoso JS. Machine learning interpretability: A survey on methods and metrics. Inf Fusion. 2020;58:82-115.
- Chen RJ, et al. Synthetic data in healthcare: A narrative review. Nat Biomed Eng. 2021;5:493-97.
- Zhou B, et al. Learning deep features for discriminative localization. Presented at: Proceedings of the IEEE Conference on Computer Vision and Pattern Recognition; 2016. p. 2921-29.
- Vellido A. The importance of interpretability and visualization in machine learning for applications in medicine and health care. Expert Syst Appl. 2020;146:113222.
- Lipton ZC. The mythos of model interpretability. Commun ACM. 2018;61(10):36-43.
- Guidotti R, et al. A survey of methods for explaining black box models. ACM Comput Surv. 2018;51(5):93.
- Suresh H, Guttag J. A framework for understanding unintended consequences of machine learning. Commun ACM. 2021;64(12):42-50.
- Wiens J, et al. Do no harm: A roadmap for responsible machine learning for health care. Nat Med. 2019;25(9):1337-40.
- Rajkomar A, Dean J, Kohane I. Machine learning in medicine. N Engl J Med. 2019;380(14):1347-58.
- Lundberg SM, Lee SI. A unified approach to interpreting model predictions. Presented at: Advances in Neural Information Processing Systems. 2017;30:4765-74.
- Agarwal R, et al. Neural additive models: Interpretable machine learning with neural nets. Presented at: Advances in Neural Information Processing Systems. 2021;34:4699-711.
- Singh C, Murdoch WJ, Yu B. Hierarchical interpretations for neural network predictions. Proc Natl Acad Sci U S A. 2020;117(32):19950-57.
- Tonekaboni S, Joshi S, McCradden MD, Goldenberg A. What clinicians want: Contextualizing explainable machine learning for clinical end use. Nat Mach Intell. 2019;1(5):176-85.
- Wang F, Preininger A. AI in health care: Applications, challenges, and future directions. Annu Rev Biomed Data Sci. 2019;2:221-52.
- Azizi S, et al. Big self-supervised models advance medical AI. Nat Med. 2021;27(8):1431-42.
- Zhang Y, et al. Explainable deep learning for healthcare: Methods, applications and challenges. IEEE Access. 2020;8:120455-475.
- Holzinger A, et al. Explainable AI methods: A brief overview. Mach Learn Knowl Extr. 2021;3(2):606-27.
- Rudin C, Radin J. Why are we using black box models in AI when we do not need to A lesson from an explainable AI competition. Nat Mach Intell. 2019;1(5):206-15.
- Doshi-Velez F, et al. Accountability of AI Under the Law: The Role of Explanation. Harvard University; Cambridge; 2020.
- Kaur H, et al. Interpreting interpretability: Understanding data scientists' use of interpretability tools for machine learning. Presented at: Proceedings of the CHI Conference on Human Factors in Computing Systems; 2020. p. 1-14.
- Caruana R, et al. Intelligible models for healthcare: Predicting pneumonia risk and hospital 30-day readmission. Presented at: Proceedings of the ACM SIGKDD International Conference on Knowledge Discovery and Data Mining; 2015. p. 1721-30.
- Mangalote IAC, et al. Development and validation of a class imbalance-resilient cardiac arrest prediction framework incorporating multiscale aggregation, ICA and explainability. IEEE Trans Biomed Eng. 2025;72(5):1674-84.
- Ansari MY, Mangalote IAC, Masri D, Dakua SP. Neural network-based fast liver ultrasound image segmentation. Presented at: 2023 International Joint Conference on Neural Networks; 2023. p. 1-8.
- Dakua SP, et al. Artificial intelligence enabled biomineralization for eco-friendly nanomaterial synthesis: Charting future trends. Nano Select. 2025;6(5):e202400118.
Access restricted. Please log in or start a trial to view this content.